Pandian Saraswathi Yadav Engineering College, Arasanoor, Sivagangai, Tamilnadu, India
Effect of Confinement on Light Weight
Concrete of Thin Column Section Subjected
To Uniaxial Compressive Load
M.Parameswari
1, N.Saravanakumar
2PG Scholar, Department of Civil, Mepco Schlenk Engineering College, Tamilnadu, India1
Assistant Professor, Department of Civil, Mepco Schlenk Engineering College, Tamilnadu, India2
ABSTRACT: Confined effect of hoops on light-weight concrete thin column subjected to compressive uniaxial loads by varying the volumetric ratio of the hoops is investigated in this study. The confinement effect is used to increase the axial load bearing and ductile ability of the structure. The normal concrete is replaced with light-weight concrete in members like partition walls and parapets, suspended ceiling, since they are not part of main load resisting structural system. A total of 5 number of thin column section specimens were casted and tested under uniaxial compressive loads. The specimens are of size 400 mm x 300 mm x 150 mm. Thin column sections contain 10 nos. of 12 mm diameter bars as main reinforcement and 6 mm diameter bars as hoops. The different hoop volumetric ratio (Psv) used in this investigation is 0.40%, 0.53%, 0.67%, 0.80 and 1.00%, etc… The concrete and steel grades used are M-20 and Fe-415 respectively. The properties of fresh light-weight concrete were confirmed with slump test, flow test and compaction test. From the stress-strain curves the effect of change in volumetric ratio on axial capacity, axial ductility of the specimens, effect of confinement, effect of hoops and effect of stress-strain behavior of thin column sections were obtained. The results shows that inadequate traverse reinforcement of elements leads to low flexural strength, low shear strength, and low flexural ductility. In order to overcome these failures sufficient traverse reinforcement is provided. This provides confinement to the concrete core and also prevents the buckling of longitudinal reinforcement. The numerical simulation of confined light weight concrete with thin wall column was carried out using ANSYS® finite element software.
KEYWORDS: Light-weight Concrete, Confinement, Ductility, Volumetric Ratio, Thin Column Section.
I. INTRODUCTION
The use of normal weight aggregates in the construction of non-load bearing members leads to increase in the dead weight of the structure. This increase in dead load can be reduced by using the natural light weight aggregate and also it decreases the amount of losses and damages resulted during the earthquake.
Based on the production methods, the light-weight concrete is classified into three different types of light weight concrete; they are cellular concrete, non-fine concrete and light weight aggregate concrete. This can be further classified into three groups’ namely structural light-weight concrete, semi-structural light-weight concrete and non-structural light-weight concrete. There are different types of natural light weight aggregates are available for the manufacture of light-weight aggregate concrete i.e., pumice, scoria, tuff, breccia and volcanic cinders.
A. Background
ISSN (Online): 2319-8753 ISSN(Print) : 2347 - 6710
I
nternationalJ
ournal ofI
nnovativeR
esearch inS
cience,E
ngineering andT
echnologyAn ISO 3297: 2007 Certified Organization Volume 4, Special Issue 5, April 2015
International Conference On Emerging Trends in Engineering and Technology (ICETET’15) On 13th & 14th March 2015
Organized by
Pandian Saraswathi Yadav Engineering College, Arasanoor, Sivagangai, Tamilnadu, India
The reduced weight allows easy transportation and reduction in cost. Pumice aggregate also having low density and better insulating property.[6]Several studies have been done on confinement effect. This study involves various shapes of confinement in the specimen with structural light-weight concrete.The main advantage of confinement is that the delay in concrete failure and also increases the strength and ductility of the concrete section. [4] It is having major advantages in high seismic risk region places. This light -weight concrete is also having better resistance for insulation and fire. Many experimental and analytical works were done on the confinement effect of normal weight concrete but less valuable studies on the confinement effect of natural light weight concrete have been presented.
B.Research Significance
Light-weight concrete contains low dead load and therefore it is mainly used in high seismic region. This low dead load helps to decreases the damage during the earth quake and also it reduces the total construction cost. The effect of confinement on light weight concrete thin column section is not yet well known. This experimental work is going to give information about confinement of light weight concrete of wall section under uniaxial compressive loads.
C.Materials Description
Tab.1 Material Description
MATERIALS DESCRIPTION
Cement OPC - 53 Grade
C.A Pumice(10-12mm)
F.A Locally Available Sand
Admixture Conplast SP430
Steel Fe250 And Fe450(Main Bar 12mm & Hoops 6mm)
Water As per requirement of code ACI 211.2.91
D. Mix Design
Light weight concrete mixtures were designed according to the code ACI 211.2.91. An acceptable workability was achieved using Conplast SP430 super plasticizer. To produce light-weight aggregate concrete, pumice were used as coarse aggregates. All mixes were designed to achieve a slump of 50 - 60 mm. Density of light-weight concrete is 1800 Kg/m3. This mix design of light weight concrete depends on type of aggregate which used in concrete. In this experimental program the materials used are similar to conventional concrete with only difference of using pumice aggregate as coarse aggregate.
II.EXPERIMENTAL PROGRAM
A. Thin Column Specimens
There are 5 specimens of light weight concrete column of thin section of size 400 mm x 300 mm x 150 mm (Fig.1) were made and tested under uniaxial compression testing machine.
Pandian Saraswathi Yadav Engineering College, Arasanoor, Sivagangai, Tamilnadu, India
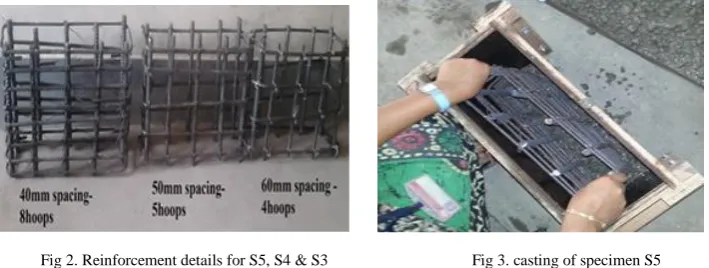
Fig 2. Reinforcement details for S5, S4 & S3 Fig 3. casting of specimen S5
For all five thin column sections 12 mm bar is used as main reinforcement and 6 mm bar is used as hoop reinforcement. Volumetric ratios of the hoops will be varied for all the five wall sections. The variation of hoops spacing’s is 25 mm, 50 mm, 75 mm.
B.Volumetric Ratio Of Hoops
The ratio between the volume of hoops and confined core concrete is called as the volumetric ratio of hoops. (Rasvi&Saaticioglu, 1999)
Volumetric ratio, Ρsv = 𝐴𝑠𝑡 .2(𝑝+𝑙)
𝑝.𝑙.𝑠
x 100
Where,
Psv = Volumetric ratio of hoops; Ast = Area of hoops;
s = Center to center hoop spacing (mm); p = Length of confined core;
l = Width of confined core.
The tested specimen shows that the load carrying capacity increased when the ratio of hoop spacing decreases. Specimen number 5 has very low hoop spacing value. This shows high volumetric ratio comparing to all the specimens.
Fig4. Load Setup Instrument
Tab.2 Tested Specimen
SPECIMEN SPECIFICATION
HOOP SPACIN G (mm)
NUMBER OF HOOPS
VOLUMETRIC RATIO (%)
S1 100 2 0.40
S2 75 3 0.53
S3 60 4 0.67
S4 50 5 0.80
ISSN (Online): 2319-8753 ISSN(Print) : 2347 - 6710
I
nternationalJ
ournal ofI
nnovativeR
esearch inS
cience,E
ngineering andT
echnologyAn ISO 3297: 2007 Certified Organization Volume 4, Special Issue 5, April 2015
International Conference On Emerging Trends in Engineering and Technology (ICETET’15) On 13th & 14th March 2015
Organized by
Pandian Saraswathi Yadav Engineering College, Arasanoor, Sivagangai, Tamilnadu, India
C.Test Setup
The specimens were tested using Universal Testing Machine (UTM) with capacity of 1000 kN. The schematic representation of CTM is shown in Fig.2. Loads are applied continuously up to the failure of specimen. In order to distribute the applied stress uniformly on the column section, steel plate of size 200 mm x 400 mm x 6 mm are placed on the top and bottom of the specimens. Three dial gauges are used to measure the axial deformations. Two dial gauges installed at the short column side and one at the long column side. Initially, the data are recorded for every 10 kN.
III.RESULTS AND DISCUSSIONS
A.Failure Modes And Capacity
An experimental program was thus designed to investigate the confinement behavior of light weight concrete of thin column section. By giving the uniaxial compressive loading to the specimens the crack propagation and load carrying capacity of light weight concrete thin column sections were observed and measured. The results showed that due to the change in volumetric ratio of hoops, the failure modes of all the thin column sections are different. Due to the confinement effect, the cover spalling occurred first at upper end, than the extension of crack delays to attain the core of the concrete. Table 3.1 shows that increasing the volumetric ratio will increase the maximum stress and cracking stress of the thin column section. Therefore, it shows that the confinement effect delays the failure mode of the light weight concrete thin column sections.
For higher volumetric ratio, the specimen (S5) attains the maximum stress of 14.48 MPa. This shows that increasing the volumetric ratio increases the confinement effect of the thin column section.
Tab.3. Failure Modes And Capacity
SPECIMEN SPECIFICATION CRACKING STRESS (Mpa) MAX. STRESS (Mpa)
RATIO OF CRACKING STRESS AND MAX. STRESS
S1 2.83 7.86 36.01
S2 3.25 8.32 39.06
S3 4.39 10.46 41.96
S4 5.85 12.85 45.52
S5 6.72 14.48 46.40
B.Effect Of Volumetric Ratio On Axial Capacity
The effects of volumetric ratio of hoops on axial capacity of all the thin column sections are presented in table.4 and figure.3. Table 4 shows that axial capacity for the volumetric ratio of 0.40%, 0.53%, 0.67%, 0.80%, and 1.0%.
Tab.4 Volumetric Ratio Of Hoops And Axial Load
SPECIMEN SPECIFICATION
VOLUMETRIC RATIO (%)
AXIAL COMPRESSIVE LOAD CAPACITY(KN)
S1 0.40 471.6
S2 0.53 499.2
S3 0.67 627.6
S4 0.80 771
Pandian Saraswathi Yadav Engineering College, Arasanoor, Sivagangai, Tamilnadu, India
Fig5. Relationships between Volumetric Ratio and Axial Compressive Load
C.Effect Of Volumetric Ratio On Axial Ductility Of The Specimens
Tab 5. Axial Ductility
SPECIMEN 85% OF MAX
STRESS (Mpa)
MAX STRAIN
(mm /mm) STRAIN @ 85% STRESS
(mm/mm) STRAIN DUCTILITY
S1 668.1 0.011 0.004 0.3
S2 707.2 0.014 0.007 0.5
S3 889.1 0.012 0.01 0.833
S4 1092.2 0.009 0.011 1.222
S5 1230.8 0.008 0.013 1.625
From the strain ductility which is the ratio between strains at 85% of peak stress to max strain, the ductility of column subjected to axial load can be estimated. (Suggested by Rasvi and Saaticioglu, 1989). The same method was also used by Sudarsana et al (2004), Tavio et al (2008) and KetutSudarsana (2013). Table 4 illustrates the effects of the hoops volumetric ratio on ductility of all the thin column sections. Table 5 shows the strain ductility values for different volumetric ratio.
D. Effect Of Stress-Strain Curves
ISSN (Online): 2319-8753 ISSN(Print) : 2347 - 6710
I
nternationalJ
ournal ofI
nnovativeR
esearch inS
cience,E
ngineering andT
echnologyAn ISO 3297: 2007 Certified Organization Volume 4, Special Issue 5, April 2015
International Conference On Emerging Trends in Engineering and Technology (ICETET’15) On 13th & 14th March 2015
Organized by
Pandian Saraswathi Yadav Engineering College, Arasanoor, Sivagangai, Tamilnadu, India
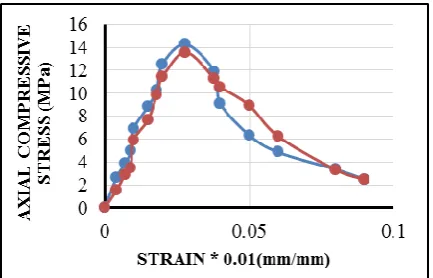
From this comparison chart, the curves shows that the specimen S5 having more uniaxial compressive strength than S4 specimen. It shows that increasing the volumetric ratio will also increase the strength of the light weight concrete of thin column sections. The same concept will be applicable for the specimens S3 & S2 and S2 & S1. Also maximum compressive strength for this concrete gives 14.48 MPa. Many investigations were carried out in order to know the maximum compressibility of lightweight concretes when using admixtures. By doing this the pumice can be used as structural light weight concretepurpose.
IV. NUMERICAL INVESTIGATION
For analyzing the complex structures finite element method is the best tool and also a cost effective method. Using various parameters like stress, strain and Poisson’s ratio obtained from experimental results, a model has been created in ANSYS 15.0. The element selection plays a key role in the simulation of entire finite element software. In this work SOLID 65 is chosen for the purpose of concrete structure and the reinforcement element is chosen as BEAM 188.
Fig7. SOLID 65 Element geometry
The concrete element is a 3-D structural element with a capability of cracking and crushing ability. The most important property of this element is that it can be applied for non-linear analysis which supports cracking. All the eight nodes of this element having three degrees of freedom at each node, translations in the x, y, and z nodal directions. The property of LWC made with pumice aggregate concrete having the property of conventional concrete and also the property of steel is applied for reinforcement.The element SOLID65 is a 3-D linear, quadratic, or cubic two-node beam element. BEAM188 has six or seven degrees of freedom at each node. These include translations in the x, y, and z directions and rotations about the x, y, and z directions. A seventh degree of freedom (warping magnitude) is optional. This element is well-suited for linear, large rotation, and/or large strain non-linear applications. The element includes stress stiffness terms enable to analyze flexural, lateral, and torsional stability problems (using eigenvalue buckling, or collapse studies with arc length methods or nonlinear stabilization). In ANSYS software to apply the axial load on the top of the column specimen, an axial pressure was implemented over the entire top surface of the column model. ANSYS load step option was used to simulate the axial pressure. Load steps were defined according to the actual load steps applied during the test. A solution was obtained by solving several sub-steps in each load step to attain convergence. In each sub-step, an iteration procedure was carried out until providing a convergent solution before moving to the next sub-step.The accuracy of the solution can be increased by the number of sub-steps taken in the analysis. When the load has reached its peak value, the load control mode was switched into the displacement control mode. To the corresponding experimental data the displacement control mode was set into several displacement steps. Using the automatic time steps, the column specimen was displaced until failure. The incremental non-linear equation can be written as follows:
K (u) Δu = ΔP
Pandian Saraswathi Yadav Engineering College, Arasanoor, Sivagangai, Tamilnadu, India
A.Simulation Result Of Thin Column Section
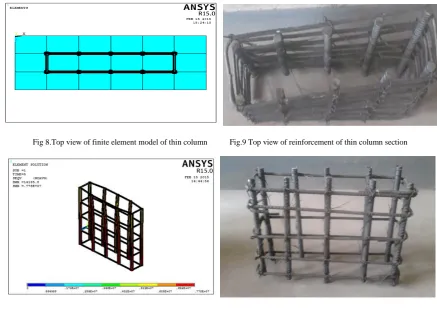
The numerical simulation of the thin column has been modelled and numerically simulated using ANSYS® finite element software. Fig.8 shows the finite element model of specimen developed in ANSYS®. The boundary condition of the model is applied at the bottom area as ux, uy, uz, rx, ry, rx = 0. The load applied is a uniformly distributed load so that the pressure load is applied over the top surface with respect to the experimental loading.
Fig 8.Top view of finite element model of thin column Fig.9 Top view of reinforcement of thin column section
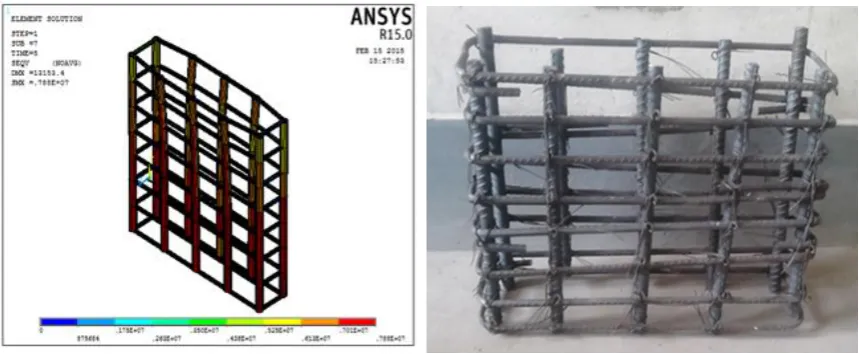
Fig10.Skeletal view of Specimen S4 (Analytical model) Fig 11.Skeletal view of Specimen S4 (experimental model)
Figures 10 &11 shows the skeletal view of thin column structure consists of ten numbers of main reinforcement bars with five numbers of hoops. It was modelled with respect to experimentally fabricated specimen S4 with a hoop spacing of 50 mm each. It is then numerically evaluated to predict the load carrying capacity
ISSN (Online): 2319-8753 ISSN(Print) : 2347 - 6710
I
nternationalJ
ournal ofI
nnovativeR
esearch inS
cience,E
ngineering andT
echnologyAn ISO 3297: 2007 Certified Organization Volume 4, Special Issue 5, April 2015
International Conference On Emerging Trends in Engineering and Technology (ICETET’15) On 13th & 14th March 2015
Organized by
Pandian Saraswathi Yadav Engineering College, Arasanoor, Sivagangai, Tamilnadu, India
Fig.12 shows that the element solution of the specimen S4 which shows early failure to load and fails to withstand the load applied.
Figure 13 shows the crack pattern which is numerically simulated using finite element software. As concrete is brittle in nature it tends to crack whereas steel is ductile material which supports for tensile loads. Hairline cracks will develop over the cover at the time of loading. These are restricted by steel reinforcement to an extent. The failure of this short column leads to direct crushing as the buckling stress is negligible in short column.
As per experimental fabrication of thin concrete column section, the specimen S5 has ten main bars of 12 mm diameter and is covered by secondary reinforcement of 6 mm diameter. Hoops and main reinforcement are of same material. Hoops and reinforcement are substituted by Beam 188 element and the concrete is modelled using Solid 65 element. The hoops are spaced in various spacing and also vary in quantities. Volumetric ratio contributes an important role in load carrying.
Figure 14.Skeletal view of Specimen S5 (Analytical model) Fig.14 Skeletal view of Specimen S4 (Experimental model)
In figures 14&15, the skeletal view of specimen present inside the thin column section is shown. Totally 8 hoops with an equal spacing of 40 mm has been displayed. It exhibits a low displacement value than the specimen S4 on the application of load.
Pandian Saraswathi Yadav Engineering College, Arasanoor, Sivagangai, Tamilnadu, India
The bottom of the structure should be arrested and the load is applied at the top surface as pressure. Fig.15 shows the stress plot occurred in the specimen S5 subjected to axial compressive load which is to predict the load carrying behavior of the designed structure. The crack propagation is one of the most important phenomena to study the behavior of the specimen. The behavior of the confined.light weight concrete structure subjected to axial compression had been simulated and the mode of crack and crack propagation had been plotted.
The result obtained from the numerical simulation has good agreement with that of the experimentally observed result. The experimental value shows that the specimen S4 with 5 no. of hoops with volumetric ratio of 0.80 % exhibits a peak stress of 13.25 MPa and that of specimen S5 with 8 no. of hoops with volumetric ratio of 1.0 % exerts a peak stress of 14.65 Mpa. The numerical simulation results shows that specimen S4 exhibits a peak stress of 17.65 Mpa and that of the specimen S5 with 1.0 % volumetric ratio exhibits a peak stress of 20.62 Mpa. This numerical result shows a good agreement with that of experimental result. Also the numerical study predicts the crack propagation and mode of collapse which is similar to experimental observation.
V.CONCLUSION
Based on the above discussion, the following conclusions can be drawn:
The results showed that the volumetric ratio of concrete is directly proportional to strength of light weight aggregate concrete. Therefore increasing the ratio of transverse reinforcement (ratio of volume of hoops to the volume of core) the peak strength of concrete substantially increases. It can be clearly seen that the extension of crack to the concrete core is delayed by the confinement effect.
Confining of the lowest concrete strength with rectilinear hoops lead to a significant enhancement in strength and ductility. In addition, it is clearly concluded that the pumice light weight concrete is very much suitable for earthquake region due to its lower dead load.
The volumetric ratios of hoops are 1%, 0.80%; 0.67%; 0.53%; 0.40% and their corresponding axial load carrying capacity were obtained as 868.0 kN, 771.0 kN, 627.6kN, 499.2 kN, 471.6kN .
The axial ductility of the sections also increases with an increase in the volumetric ratio of hoops. For volumetric ratio of 1%, 0.80%; 0.67%; 0.53%; 0.40%, their axial ductility were 1.625; 1.222; 0.833; 0.50; 0.30 respectively.
The experimental results show that the increased volumetric ratio gives a good strength to the structure and also high load bearing capacity. From the axial stress contours obtained from the FEM analysis, it can be concluded that the axial stress concentrations are in the center regions of the column cross sections, particularly in the confined areas. Analytical results showed a good agreement with the experimentally observed stress-strain data.
REFERENCES
[1]KetutSudarsana (2013), “Experimental study on confined concrete of thin column sections”, National Conference, Udayana University, Bali, Indonesia..
[2]D Beheshtizadeh& H Azamirad (2005), “Structural light-weight concrete production using eskandan region pumice”, 30th Conference on our world in Concrete and Structures, Islamic Azad University of Shabestar.
[3] Standard Practice for Selecting Proportions for Structural Lightweight Concrete (ACI 211.2-98).
[4]MohdRojiSamidi (1997),”First report research project on light-weight concrete”, UniversitiTeknologi Malaysia, Skudai, Johor Bahru..
[5]Bousalem and Chick (2007), “Development of confined model for rectangular ordinary reinforced concrete columns”, Materials and Structures Journal.
[6]I. Ugur (2003), “Improving the Strength Characteristics of the Pumice Aggregate Light-weight Concretes”, 18th International Mining Congress and Exhibition at Turkey..
[7] Ibrahim S.I.Harba (2012), “Nonlinear finite element analysis of confined HSC columns under concentric and eccentric loadings”, Journal of Engg., and development, Vol.16, No.3.