VOLUME 17 ISSUE 1 (2019), Page 240 – 249
ANALYTIC HIERARCHY PROCESS:
AN EMPIRICAL VALUATION FOR INTANGIBLE ASSETS
Jerri Falson1
Ministry of Finance REPUBLIC OF INDONESIA
Abstract
Intellectual capital or intangible assets has become widely accepted as one of the most important assets of many of the world's largest companies. However, it is often pointed out that conclusion about valuation in intellectual capital shows a significant difference to capture the potential corporate value activities and determine their future earnings. This paper empirically investigates valuation in the intellectual capital by applying the Analytic Hierarchy Process (AHP) by sorting the non-financial value driver for their weight contributions. It uses top-four industrial sectors in Indonesia which are competing in a distinctive sector to find the observable performance differences. Simultaneously, to complete this research, questionnaires were distributed to valuers in the headquarter of Indonesian Directorate General of State Assets Management (DGSAM). AHP model was used to explore the value weights and ranks among those industries. The findings in this paper are focused on investigating the relative value distribution and determining the diverse patterns across industry by highlighting the importance of intellectual capital to create value advantages.
INTRODUCTION
Intellectual capital or intangible assets are recognized as one of the most important assets of many of the world's largest and most powerful companies (Lin & Tang, 2009). Especially in recognition for the purpose of mergers, acquisitions, and accounting report, right now, it is still difficult to understand the reliability of the value of intellectual capital (Frederick, 2009). Intellectual capital can also cause a direct effect in assessing the firm value that sometimes under-valued. Thus, the ability of an enterprise to gain its competitive advantages and to support them as well is partly determined by its core competencies that are embedded deep within an organization (Stan, Dumitrascu, & Pele, 2017). The importance and complexity of intangible assets has created a purpose for valuation, for example in financial reporting purposes as well as for the management of state finances.
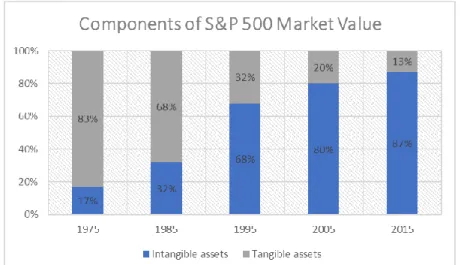
Ocean Tomo (“Ocean Tomo Releases 2015 Annual Study”, 2015) has released its findings from Intangible Asset Market Value Study of the composition of equity market values that reported the components of S&P market value as illustrated in Figure 1. Following the finding, by looking into the trends portion of company’s report in S&P 500, it is crystal clear that since two-decade ago, more than half of investment has been invested in intangible asset.
Figure 1: Comparison between investment in tangible and intangible asset
Source: Ocean Tomo (2015)
valuation process was set up to sort the non-financial value drivers according to their weighted contributions. Using AHP will help companies to assess appropriately and to avoid bias in measuring the fair value of an entity. In addition, by giving the substantial part of intangible assets to the contribution of total assets in many industries, the top-four industries basically from their volatility and their trading volume in Indonesia Stock Exchange, Indonesia, were used as the object of indicator to professional valuer in DGSAM in order to test the suitability of applications, models, and explore the weight of the value of intangible assets and its evaluation among different industries.
This paper examines the intellectual capital in relation to research on contemporary valuation analysis. The focus is on one of the most ‘visible’ research subjects: intangible assets. In doing so, this paper explores the ‘silences and secrets’ of the intellectual practices through which drivers are recognized as a missing problem. This intellectual capital research field is a fertile opportunity to examine the constellation of academic and practical knowledge. This research represents a desire to contribute in business valuation which also has played a central role and important matter of concern in making decision.
RESEARCH BACKGROUND
Indonesia Stock Exchange
The presence of capital market or stock exchange in Indonesia began in the era of Dutch East Indies on December 14, 1912, when the Dutch government through the Amsterdam Stock Exchange established a stock exchange association in Jakarta (ISE, 2014). And legally, PT Bursa Efek Indonesia (the Company) was established based on notarial deed No. 27 dated December 4, 1991 as amended by notarial deeds No. 142 dated December 13, 1991 and No. 254 dated December 21, 1991 (ISE, 2014). By stepping up for its growth, compared to regional exchanges, IDX’s achievement is promising although not the best (ISE, 2016a) However, the performance of Indonesian capital markets had made encouraging progress until 2016.
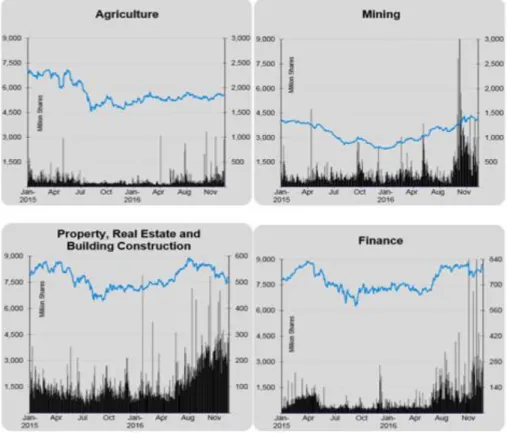
Until the end of 2016, the top big-four sectors in IDX were in mining, agriculture, property and financial, which boosted the overall growth of listed company in Indonesia. Based on data from Indonesia Stock Exchange Statistic (ISE, 2016b), the average index rate indicated that four sectors in the Indonesia Stock Exchange 2015-16 were rather stable (Figure 2). Otherwise, the trading volume that indices by the bar from the left axis shows the dynamics of the number in million shares that has been distributed in the past two years.
AHP
on the proportions between them (Brunelli, 2015). Formally, to operationalize, in a decision process there are several sets of AHP pillars, which are (i) ratio scales, proportionally and normalized ratio scales (ii) reciprocal paired comparisons (iii) the sensitivity of the principal eigenvector (iv) clustering and using pivots to extend the scale (v) synthesis to create a one-dimensional ratio for representing the overall outcome (vi) rank preservation and reversal, and (vii) integrating group judgments (Lamata, 2006).
Figure 2: Comparison between 4 big industries in Indonesia (2016)
Source: ISE (2016b)
aggregate the relative weights of decision elements to arrive at a set of ratings for the decision alternatives (Zahedi, 1986).
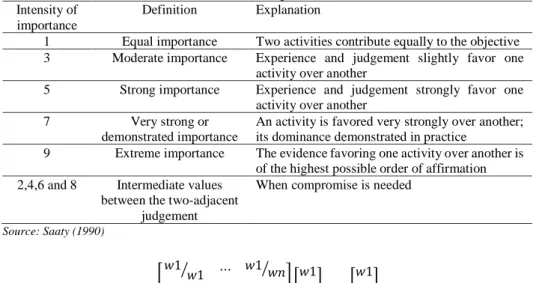
Saaty (1990) proposed a simple formula for pairwise comparison by using a matrix equation which has positive entries in single row and column, as the origin of his fundamental scale of absolute number (Table 1), with reciprocal property (Figure 3). The solution of those multiplication = nw, named the principal right eigenvector which consists of positive entries and is unique to within a multiplicative constant (Saaty, 1990).
Table 1: Level of importance in AHP
Intensity of importance
Definition Explanation
1 Equal importance Two activities contribute equally to the objective 3 Moderate importance Experience and judgement slightly favor one
activity over another
5 Strong importance Experience and judgement strongly favor one activity over another
7 Very strong or
demonstrated importance
An activity is favored very strongly over another; its dominance demonstrated in practice
9 Extreme importance The evidence favoring one activity over another is of the highest possible order of affirmation 2,4,6 and 8 Intermediate values
between the two-adjacent judgement
When compromise is needed
Source: Saaty (1990)
[ 𝑤1
𝑤1
⁄ ⋯ 𝑤1⁄𝑤𝑛
⋮ ⋱ ⋮
𝑤𝑛 𝑤1
⁄ ⋯ 𝑤𝑛⁄𝑤𝑛
] [ 𝑤1
⋮ 𝑤𝑛
] = 𝑛 [ 𝑤1
⋮ 𝑤𝑛
]
Figure 3: AHP Formula
Source: Saaty (1990)
Those results must meet the consistence level of the relative importance of the attributes. Since subjective judgment may present decision biases, its consistency must be checked. It is a common that the pairwise comparison is considered consistent when the consistency index value is less than 0.10.
Intangible Assets
difference between purchase price and book value (Daum, 2003). It focuses on resources that are not material, and highlights the growing importance in the economy and in companies of this hidden wealth (Andriessen, 2004).
Creating the Value Driver
Corporations sometimes choose not to focus on value creation and, instead, unintentionally make decisions that systematically decrease the long-term value of their businesses (Lin & Tang, 2009). The definitions of value creation depends on the relative amount of value that is subjectively realized by a target user (or buyer) who is the focus of value creation, whether individual, organization, or society, and that this subjective value realization must at least translate into the user’s willingness to exchange a monetary amount for the value received (Lepak, Smith, &Taylor, 2007). Lepak, Smith and Taylor (2007) also stated two important economic conditions that may be necessary for value creation activities to endure as:
• the monetary amount exchanged must exceed the producer’s costs (money, time, effort, joy, and the likes) of creating the value in question, at least for the single point in time when the exchange occurs; and
• the monetary amount that a user will exchange is a function of the perceived performance difference between the new value that is created (from the new focal task, product, or service) and the target user’s closest alternative (current task, product, or service).
It is an interesting subject when accounting does not provide an effective information and how to create the value to leverage corporate intellectual capital. Value creation also creates new competitive space for firms and sustainable competitive advantage in business enterprise (Prahalad & Ramaswamy, 2004). However, in building the value creation, managers should decide which assets are the most important drivers of the company's value-creation system (Lin & Tang, 2009). For instances, setting up the efficient manufacturing process, innovation through product development, creating a new brand, e-commerce, and easy data interchange from software application.
Theoretically, an asset, whether tangible or intangible, is assessed through its expected future discounted cash flow. This is the basic principle of the discounted cash flow. From such premise, strategies drawn by a company may positively or negatively affect a given company's value. Consistent with this principle, Lev (2001) defined intangible asset as a right for future benefits that do not have a physical or financial body (stocks or debt securities). In order to allow a better understanding of the intangible asset concept, it is necessary to present its classification.
those non-financial components would be related by the definition of the intangible assets' values. Kalafut and Low (2001) suggested that the critical drivers are innovation, quality, customer relation, management capabilities, alliances, technology, brand value, employee relations, and environmental and community issues. Looking deeply, all of those are non-financial drivers. In understanding the important nature of intangible assets, then the drivers are attributes that may be associated with different types of intangible assets. Meanwhile, the higher or lower intensity in the relative importance of each driver may influence the formation of value for intangible assets (Lin & Tang 2009).
CONSTRUCTING THE RESEARCH MODEL
By understanding the category of drivers developed by Kalafut and Low (2001), a quantitative research was conducted. It consisted of four assessing dimension drivers and 11 assessing criteria for probing into the issue regarding the value of weights of intangible assets in mining, agricultural, property and finance industries. The research model was then validated by speakers and practitioners from Directorate General of State Asset Management (DGSAM) Head Office, to ensure that the model constructed fits the needs and is reasonable.
For primary dataset, a questionnaire was developed to help allocating the assessment dimension. The sample of assessment dimension was derived from certified valuer in DGSAM or at least a non-certified valuer but has completed the 200 hours of training in valuation. A total of 102 copies of questionnaires were issued. While 82 copies were valid, all of them recollected with CI/CR ratio less than 0.1 were selected to be effective analysing samples.
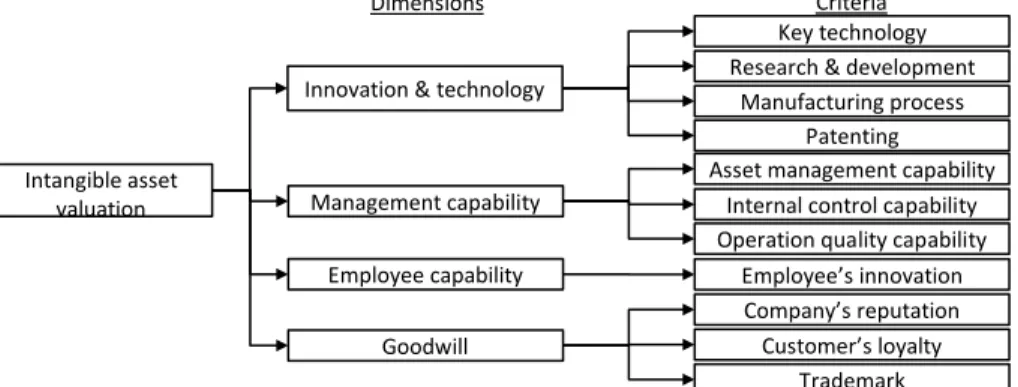
Figure 4: The model of intangible asset evaluation
Source: Lin & Tang (2009)
Therefore, the AHP method was used during the survey, attempting to quantitatively rank the non-financial contributions as shown in Figure 4. The implicit assumption underlying here is that genuine intangible asset values may
Intangible asset valuation
Innovation & technology
Management capability
Employee capability
Goodwill
Dimensions Criteria
Key technology Research & development
Manufacturing process Patenting Asset management capability
Internal control capability
Employee’s innovation Company’s reputation Customer’s loyalty
vary between firms, but professional executives within the same industry should have a converged idea regarding the ways in which the intangible assets should be arrayed when they consider comparing the relative importance of the value drivers. Therefore, directly after obtaining the ideal measure of intangible assets surveyed through AHP, other methods can be used by the management in order to assess the way in which the arrangement of the individual company's intangibles is diverged from the so-called ideal structure; this is particularly useful while encountering business mergers and acquisitions since it serves as a helpful reference for business valuation.
RESULTS AND ANALYSES
Table 2 shows the weights (relative importance) of intangible asset appraising dimensions assigned by the professional executives in DGSAM. ‘Technology innovation’ has been considered as the most important dimension, which has weights 0.55 for Mining industry and 0.48 for Agricultural industry. In the same way, both of Mining and Agricultural industries have the least weight in ‘goodwill’ dimension for 0.05 and 0.06. On the other hand, ‘management capability’ has been reached as the highest dimension which has 0.56 in Property and 0.54 in Finance sector while ‘technology innovation’ only 0.12 and 0.08 in those sectors.
Table 2: The weights of appraising dimension of intangible assets in different industries
Industry category Technology innovation
Management capability
Employee
capability Goodwill
Mining Sector 0.55 0.28 0.12 0.05
Agricultural Sector 0.48 0.29 0.17 0.06
Property 0.12 0.56 0.14 0.17
Finance 0.08 0.54 0.13 0.25
Source: This Study
Table 3: The weight of appraising criteria of intangible assets in different industries
Appraising criterion Mining Agriculture Property Finance Innovation and Technology
Key Technology 0.306 (1) 0.184 (2) 0.030 (10) 0.022 (11)
R & D capability 0.195 (2) 0.252 (1) 0.034 (8) 0.034 (8) Manufacturing process 0.121 (3) 0.114 (3) 0.034 (9) 0.026 (9)
Patenting 0.036 (9) 0.051 (7) 0.024 (11) 0.024 (10)
Management Capability
Asset Management capability 0.062 (5) 0.071 (6) 0.336 (1) 0.288 (1) Internal Control capability 0.056 (7) 0.048 (9) 0.101 (4) 0.104 (3) Operation quality capability 0.058 (6) 0.043 (10) 0.122 (2) 0.168 (2) Employee Capability
Employee’s innovation 0.063 (4) 0.074 (5) 0.059 (7) 0.076 (7) Goodwill
Company’s reputation 0.036 (8) 0.077 (4) 0.112 (3) 0.099 (4) Customers’s loyalty 0.034 (10) 0.051 (8) 0.080 (5) 0.082 (5)
Trademark 0.033 (11) 0.035 (11) 0.068 (6) 0.077 (6)
Source: This Study
For Property sector and Finance industry, the highest was Asset Management capability, with score of 0.336 for Property and 0.288 in Finance. This is followed by Operation quality capability, which scored 0.122 for Property sector and 0.168 Finance (0.122 and 0.168). The distribution highlights the characteristics of those industries at their level of risk-associated with the degree of investment. Therefore, if the firms were responsible for improving asset management capability and operation quality, their action will be reflected in how they develop their relationship with their investors to capture the competitive advantage in those sectors.
CONCLUSION
In the context of this paper, we have seen how intangible assets correspond to corporate value creation and represent the source of non-financial competitive advantage. Intangible asset in its economic aspects is embedded in the problematic dynamics of the market economy and is more likely to help businesses avoid bias due to mainly relying on financial statements when measuring an entity's value.
REFERENCES
Andriessen, D. (2004). Making sense of intellectual capital: Designing a method for the valuation of intangibles. Oxford: Elsevier.
Brunelli, M. (2015). Introduction to the analytic hierarchy process. Finland: Springer. Daum, J.H. (2003). Intangibles assets and value creation. Chichester: Wiley.
Frederick, W. (2009). Recent developments in intellectual capital reporting and their policy implications. OECD Education Working Papers, No. 17. Paris: OECD Publishing.
Indonesia Stock Exchange [ISE] (2014). 2014 Annual Report. Retrieved from http://www.idx.co.id/id-id/beranda/tentangbei/laporantahunan.aspx.
Indonesia Stock Exchange [ISE] (2016a). IDX Fact Book 2016. Retrieved from http://www.idx.co.id/Portals/0/StaticData/Publication/FactBook/FileDownload/ 20161025_FB-2016.pdf.
Indonesia Stock Exchange [ISE] (2016b). IDX Statistics 2016. Retrieved from http://www.idx.co.id/id-id/beranda/publikasi/statistik.aspx.
Kalafut, P. C., & Low, J. (2001). The value creation index: Quantifying intangible value.
Strategy & Leadership, 29(5), 9-15.
Lamata, M. T. (2006). An alternative solution to the analytic hierarchy process.
International Journal of Intelligent Systems, 21, 425-441.
Lepak, D. P., Smith, K. G., & Taylor, M. S. (2007). Value creation and value capture: A multilevel perspective. Academy of Management Review, 32(1), 180-194. Leon, R. D. (2016). Intellectual capital – Source of competitiveness. International
Journal Learning and Intellectual Capital, 13, 149-166.
Lev, B. (2001). Intangibles: Management, measurement and reporting. Washington: Brookings.
Lin, G., & Tang, J. (2009). Appraising intangible assets from the viewpoint of value drivers. Journal of Business Ethics, 88(4), 679-689.
Ocean Tomo. (2015). Ocean Tomo releases 2015 annual study of intangible asset market
value. Retrieved February 2, 2018, from
http://www.oceantomo.com/blog/2015/03-05-ocean-tomo-2015-intangible-asset-market-value/
Prahalad, C. K., & Ramaswamy, V. (2004). Co-creation experiences: The next practice in value creation. Journal of Interactive Marketing, 18(3), 5-14
Saaty, T. (1990). How to make a decision: The analytic hierarchy process. European Journal of Operational Research, 48, 9-26.
Stan, S., Dumitrascu, D., & Pele, A. (2017). Recognizing and valuating intangible resources – Major difficulties in organisational management. Management of Sustainable Development Sibiu, 9(1). 35-38.
Zahedi, F. (1986). The analytic hierarchy process: A survey of the method and its applications. Interfaces, 16(4), 96-108.