Artificial Immune System Inspired Intrusion Detection System Using Genetic
Algorithm
Amira Sayed A. Aziz
French University in Egypt, Scientific Research Group in Egypt (SRGE), Cairo, Egypt E-mail: [email protected] and www.egyptscience.net
Mostafa A. Salama
British University in Egypt, Scientific Research Group in Egypt (SRGE), Cairo, Egypt E-mail: [email protected] and www.egyptscience.net
Aboul ella Hassanien
Faculty of Computers and Information, Cairo University,
Chairman of Scientific Research Group in Egypt (SRGE), Cairo, Egypt www.egyptscience.net
Sanaa El-Ola Hanafi
Faculty of Computers and Information, Cairo University, Cairo, Egypt
Keywords:artificial immune system, intrusion detection, genetic algorithm, Minkowski distance
Received:October 11, 2012
Computer security is an issue that will always be under investigation as intruders never stop to find ways to access data and network resources. Researches try to find functions and approaches that would increase chances to detect attacks and at the same time would be less expensive, regarding time and space. In this paper, an approach is applied to detect anomalous activity in the network, using detectors generated by the genetic algorithm. The Minkowski distance function is tested versus the Euclidean distance for the detection process. It is shown that it Minkowski distance give better results than the Euclidean distance, and can give very good results using less time. It gives an overall average detection rate of 81.74% against 77.44% with the Euclidean distance. In addition, formal concept analysis was applied on the data set containing only the selected features and used to visualize correlation between highly effective features.
Povzetek: Predstavljena je varnostna metoda na osnovi umetnega imunskega sistema.
1
Introduction
Anomaly detection has been a widely researched problem in several application domains such as system health man-agement, intrusion detection, health-care, bio-informatics, fraud detection, and mechanical fault detection. Traditional anomaly detection techniques analyse each data instance (as a uni-variate or multivariate record) independently. And ignore the sequential aspect of the data. Often, anoma-lies in sequences can be detected only by analysing data instances together as a sequence, and hence cannot be de-tected by traditional anomaly techniques [1]. Gonzalez and Dasgupta in [2] used sequential niching technique with the genetic algorithm to generate the rules. Then, in [3] they suggested using deterministic-crowding niching technique to limit the crowd by replacing parents with more fitted children. This time, the algorithm gave same results with less number of rules, which is better because the population size will not change.
This paper applies an approach for detecting network traffic anomalies using genetic algorithm based intrusion detection system, but without the levels of abnormality.
The algorithm is put under investigation to find which val-ues for its parameters can lead to better results, using the relatively new NSL-KDD data set.
The rest of this paper is organized as follows. Section 2 presents a background of anomaly intrusion detection, artificial immune systems, genetic algorithms and formal concept analysis. Section 3 gives a review on work sim-ilar to the one mentioned in this paper. Section 4 gives a description of the applied approach and its phases as well. Section 5 shows the experimental results and discusses ob-servations. Finally, section 6 addresses the conclusions.
2
Background
2.1
Anomaly Detection
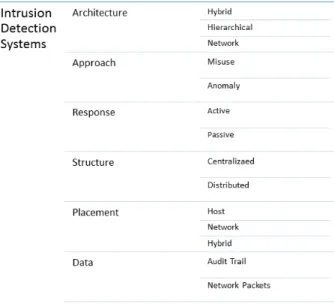
Figure 1: Intrusion Detection Systems classification
then by monitoring audit logs, which was during 70’s and 80’s. The problem was that suspicious or anomalous ac-tions were discovered after that have took place. Another problem was that audit logs were stacked by lots of activ-ities which was a burden to view and would need a lot of time to review and high expertise to notice suspicious be-havioural pattern. So, the need for real-time systems that can detect such activities while they happen emerged. By the 90’s, IDSs were created to review audit data while they build up, and by time, they were developed to take actions as responses to attacks [4].
IDSs can be categorized in many terms [5], all categories are summarized in Figure 1.
Misuse-based and Anomaly-based detection are two ba-sic approaches are followed to implement an IDS. In a misuse-based IDS, attacks are represented as a pattern or a signature to use for detection. It’s very good in de-tecting known attacks and provide detailed information on the detected ones, but is of little use for unknown attacks. Anomaly-based IDS build a model for a system’s normal behaviour to use for detection, assuming all deviated ac-tivities to be anomalous or intrusions. It is very useful for finding unknown attacks but it has a high false negative or positive rates, beside it needs to be updated with system be-haviour and can not provide much information on detected attacks. In some IDSs, a hybrid of both techniques is used [6].
Different approaches exist for Anomaly-based Network IDS (A-NIDS), but in general they all consist of the fol-lowing modules: (1) Parametrization: representing the observed instances in some pre-defined form, (2) Train-ing: a model is built using the normal or abnormal sys-tem behaviour. It can be done manually or automatically, and (3)Detection: the (parametrized) monitored traffic is searched for anomalous behaviour using the system model built through previous stage.
The techniques used to build the system behavioural model can be: statistical, knowledge-based, or machine learning-based. The Genetic Algorithms (GA) is among the machine learning-based techniques. The flexible and robust global search is the main advantage of applying GAs in A-NIDS, where it looks for a solution from multiple di-rections with no prior knowledge required about the system [7, 8].
2.2
Genetic Algorithms
Genetic Algorithms (GAs) is one of the Evolutionary Com-putation (EC) approaches. In general,EC can be involved in many tasks in IDSs, such as optimization, automatic model design, and in classification [9]. GAs are basically used in IDSs to generate rules (build a classifier) used to de-tect anomalies [8]. They were inspired by the biological evolution (development), natural selection, and genetic re-combination. GAs use data as chromosomes that evolve through: selection (usually random selection), cross-over (recombination to produce new chromosomes), and muta-tion operators. Finally, a fitness funcmuta-tion is applied to select the best (highly-fitted) individuals. The process is repeated for a number of generations until reaching the individual (or group of individuals) that closely meet the desired con-dition [8, 2].
GA is very promising in the computer security field, es-pecially in IDSs. It has been applied for intrusion detec-tion since the 1990’s, and still being used up till the current time. GA is usually used to generate rules for intrusion de-tection, and they usually take the formif {condition} then {action}, where the condition part test the fields of incom-ing network connections to detect the anomalous ones [8].
Niching techniques are known to assist EC techniques to find multiple local optimal solutions in a population by creating sub-populations which assemble local optima so there would be diversity in the population [9]. They can be used in conjunction with GAs to find multiple solutions in one round without the need to run the GA multiple times.
2.3
Artificial Immune Systems
The Artificial Immune Systems (AIS) were inspired by the Human Immune System which is robust, decentralized, er-ror tolerant, and adaptive. The HIS has different cells with so many different tasks, so the resultant mimic algorithms give differing levels of complexity and can accomplish a range of tasks. There are a number of AIS models used in pattern recognition, fault detection, computer security, and a variety of other applications in the field of science and engineering. Most of these models emphasize on designing and applying computational algorithms and techniques us-ing simplified models of various immunological processes and functionalities [10, 11].
(NSA) explains how T-cells are being selected and their maturation in the system. T-cells are blood cells that be-long to a group of white blood cells called lymphocytes. In the NSA, whenever the T-Cells are produced, they undergo an immaturely period to learn which antigen recognition results in their death. The T-cells need activation to de-velop the ability to remove pathogens. They are exposed to a comprehensive sample of self antigens, then they are tested against self and self antigens to match the non-self ones. If a T-Cell matched a non-self antigen, it is then removed until they are mature and released to the system [13, 14].
2.4
Formal Concept Analysis
Formal Concept Analysis (FCA) is one of the data mining research methods and it has been applied in many fields as medicine. The basic structure of FCA is the formal context which is a binary-relation between a set of objects and a set of attributes. The formal context is based on the ordinary set, whose elements has one of two values, 0 or 1 [15], [16]. A formal concept is defined as a pair(A, B) withA⊆ G, B ⊆ M, intent(A)=B and extent(B) =A. The setA
is called the extent and the set B called the intent of the concept (A,B). The extent and the intent are derived by two functions, which are defined as:
intent(A) ={m∈M|∀g∈A: (g, m)∈I},
A⊆G, (1)
extent(B) ={g∈G|∀m∈B : (g, m)∈I},
B ⊆M. (2)
Usually the attributes of a real life data set are not in a binary form, attributes could be expressed in a many-valued form that are either discrete or continuous values. In that case the many-valued context will take the form
(G, M, V, I)which is composed of a setGof objects, a set
M of attributes, a setV of attribute values and a ternary-relationI betweenG, M andV. Then the many-valued context of each attribute is transformed to a formal con-cepts, the process of creating single-valued contexts from a many-valued data set is called conceptual scaling. The pro-cess of creating a conceptual scale must be performed by using expert knowledge from the domain from which the data is drawn. Often these conceptual scales are created by hand, along with their concept lattice, since they are rep-resented by formal contexts often laid out by hand. Such that a thresholdtis chosen for each many-valued attribute and replace it by the two one-valued attributes "expression value" [15], [16].
3
Related Work
Many researches combined GAs with IDSs either for op-timization or to build classifiers for the intrusion detection
process. Dasgupta and Gonzalez have done some research concerning AIS-inspired network security systems [2, 3, 8]. In [2] they built a model applying the Positive Characteriza-tion (PC) concept which follows the NSA algorithm, where a model is built representing the self space and character-ize the connections (as normal or anomalous) according to their distance to that self model. They also implemented another algorithm that applies the Negative Characteriza-tion (NC) concept which builds a model for the non-self space and use it to detect attacks. Both algorithms used GA with sequential Niching algorithm to generate the rules used to define the models. Real-valued variables were used instead of binary encoding, so the model is representing self/non-self samples in the hyperspace and the detectors cover that complementary space. They concluded that PC gives more precise results than NC but NC requires less time and space resources. In [3] they implemented and al-gorithm to build a model representing the self space for anomaly detection too. They used a variability parameter to defines levels of abnormality. Again, GA was used to generate the detectors but this time using the deterministic-crowding Niching technique. Their new technique had bet-ter computational power and showed very good results de-tecting the attacks. They used the Darpa intrusion detection evaluation data set.
In [8], they implemented a Rule-based system (RBS) by creating artificial intelligence rules using GAs for intrusion detection. They followed NC where detectors are gener-ated to match anomalous connections. They used the hy-perspace fitness function originally suggested by Gonzalez and Dasgupta. Wei Li and Iss Traore [17] proposed a rule evolution approach based on GA, but they used parse trees to represent population instead of chromosomes. They used the Darpa data set for evaluation. In [18] GA was used to generate a set of rules where each rules identifies a particular attack type. As a result to their experiment, they generated a set of six rules that classify six different attack types that fall into two classes: DoS and probe. They used the following fitness function:
F= a
A− b
B (3)
type contained in each connection feature.
Fan Li in [22] proposed an intelligent IDS which com-bines both anomaly and misuse techniques. GA is used for the fuzzy logic in the learning component of system, to tune the fuzzy membership functions and to select an appropri-ate set of features. Other work involving the use of GAs for intrusion detection can be found in [23], [24], [25], and [26]. Also, [27] gives a detailed survey on such systems.
4
The Proposed Network Anomaly
Detection Approach
Genetic Algorithms produce the best individual as a solu-tion, but in an A-NIDS a set of rules is needed - hence, running GA multiple times. The technique used here was originally proposed in [28], where an algorithm was imple-mented to generate detectors for network anomaly intru-sion detection, using GA with the deterministic-crowding Niching technique. The strengths of the deterministic-crowding Niching technique are that it requires no addi-tional parameters to those that are already used in a GA, beside that it is fast and simple [29].
The self (normal behaviour) individuals are represented in a self spaceS, where each individual is represented as a vector of features of dimension n, with the values nor-malized to the interval [0.0,1.0]. This can be written as
S =x1, . . . , xm, wheremis the number of the self
sam-ples. Algorithm (1) shows the main steps of the detectors generation approach.
The final solution was a set of rules, represented as in-dividuals with low and high limits for each dimension, as the conditions used to define the AIS detectors. So, each ruleRhas a condition part (xn ∈ [lowi, highi]), hence a
feature vectorxisatisfies a ruleRif its hyper-sphere
inter-cepts the hyper-cube represented by the rules defines by its points [3].
To calculate the fitness of an individual (or a rule), two things are to be taken into account: the number of elements in the training sample that can be included in a rule’s hyper-cube, calculated as [2, 3]:
num_elements(R) =xi∈Sandxi∈R (4)
The volume of the hyper-cube that the rule represents is defined by the following form:
volume(R) =
n ∏
(i=0)
(highi−lowi) (5)
Consequently, the fitness is calculated using the follow-ing equation.
f itness(R) =volume(R)−C×num_elements(R)
(6) where C is a coefficient of sensitivity that represents a penalty if a rule covers anomaly samples. The bigger the
Algorithm 1Detectors generation algorithm
Initialize population by selecting random individuals from the spaceS.
forThe specified number of generationsdo forThe size of the populationdo
Select two individuals (with uniform probability) as
parent1andparent2.
Apply crossover to produce a new individual (child).
Apply mutation to child.
Calculate the distance betweenchildandparent1
asd1, and the distance betweenchildandparent2
asd2.
Calculate the fitness of child, parent1, and
parent2asf,f1, andf2respectively.
if(d1< d2) and (f > f1)then
replaceparent1withchild
else
if(d2<=d1) and (f > f2) then
Replaceparent2withchild.
end if end if end for end for
Extract the best (highly-fitted) individuals as your final solution.
Cvalue, the higher the sensitivity - hence the penalty - is. The fitness can take negative values. The same equations are used if you’re calculating the fitness of an individual in general. To calculate the distance between two individu-als (a childcand a parentp), volumes of the hyper-cubes surrounding the individuals (represented by low and high points in each dimension) are used as follows:
distance(c, p) =volume(p)−volume(p
∩ c)
volume(p) (7)
The purpose of using the volume is to check how much the child covers of the area of the parent, so this distance measure is not symmetric. The algorithm had very good results (compared to some others as will be shown later in the paper) with the highest detection rate 81.76%. The Eu-clidean distance was used in the comparison and detection process. In this paper, the use of other distance metrics is proposed — precisely the Minkowski distance. It is a gen-eral metric in which other metrics can be included within as special cases of its form [30] [31].
The Minkowski distance between two vectorsX andY
can be expressed as,
d(X, Y) = (
n ∑
i=0
(|xi−yi|p))1/p (8)
p=2, then it is the Euclidean distance, and as it approaches infinity it becomes the maximum (or Chebyshev) distance.
5
Experimental Results and
Discussion
5.1
Data Sets
The experiment was performed on the NSL-KDD data set which was suggested to solve some problems in the KDD Cup’99 data set that is widely used for IDS evaluation. This data set contains less number of records in both the train and the test, which helps researchers to run their exper-iments on the whole sets instead of only small portions. Hence, the evaluation results will be comparable and con-sistent [32]. Fifteen parameters (features) were selected to use in the experiment, which have real values that can be used in the approach and can be used to detect basic DoS attacks. These features values are already in the interval [0.0,1.0], and they are mentioned in Table (1) in [28].
5.2
Experiment Settings
The self (normal) data only was used in the training phase to generate best rules that represent the Self profile, as the negative selection approach suggests, then the rules were compared against the test sample. The parameters values used for the genetic algorithm are mentioned below in table (1).
Variable Value Population Size 200, 400, 600 Number of Generations 200, 500, 1000, 2000 Mutation Rate 0.1
Sensitivity Coefficient 1.0
Variability Value 0.05, 0.10, 015, 0.20
p(Minkowski Order) 0.5
Table 1: The classification accuracy of known classifiers
Following the NSA, the algorithm is basically trained (to generate rules) on self (normal) samples, then use these rules to find non-self (anomalies) which will be the vectors very far from the self rules. To characterize the samples to self or non-self, the characterization function was:
µnon_self(x)=D(x, Self)
= min{d(x, s) :s∈Self} (9)
which mean the closer a vectorxis to a self points, the less it is a non-self sample. The distance measured(x, s), is the Minkowski distance as mentioned above.
5.3
Experiment Results
The training phase was held using normal samples ex-tracted from the 20% Train Set to generate intrusion
de-Figure 2: Euclidean Distance Average Detection Rates ver-sus Threshold Levels.
Figure 3: Minkowski Distance Average Detection Rates versus Threshold Levels.
tectors. Using different population sizes ran for different numbers of generations, the algorithm was executed for each combination, resulting in a group of detectors. Each detectors is expressed as values for each features, where the variability value defines the upper and lower bounds for that feature. Each set of detectors was tested against the Test Set of the NSL-KDD data set for detection of anoma-lies, once using the Euclidean distance, and another time using the Minkowski distance.
Figures 2 and 3 show the average detection rates (regard-ing variation levels) us(regard-ing euclidean and minkowski dis-tances respectively. It can be realized that — for all com-binations — the minkowski distance give better detection results (most of all above 80%), with detectors generated by smaller populations giving better results.
Figure 4: Euclidean Distance Maximum Detection Rates versus Threshold Levels.
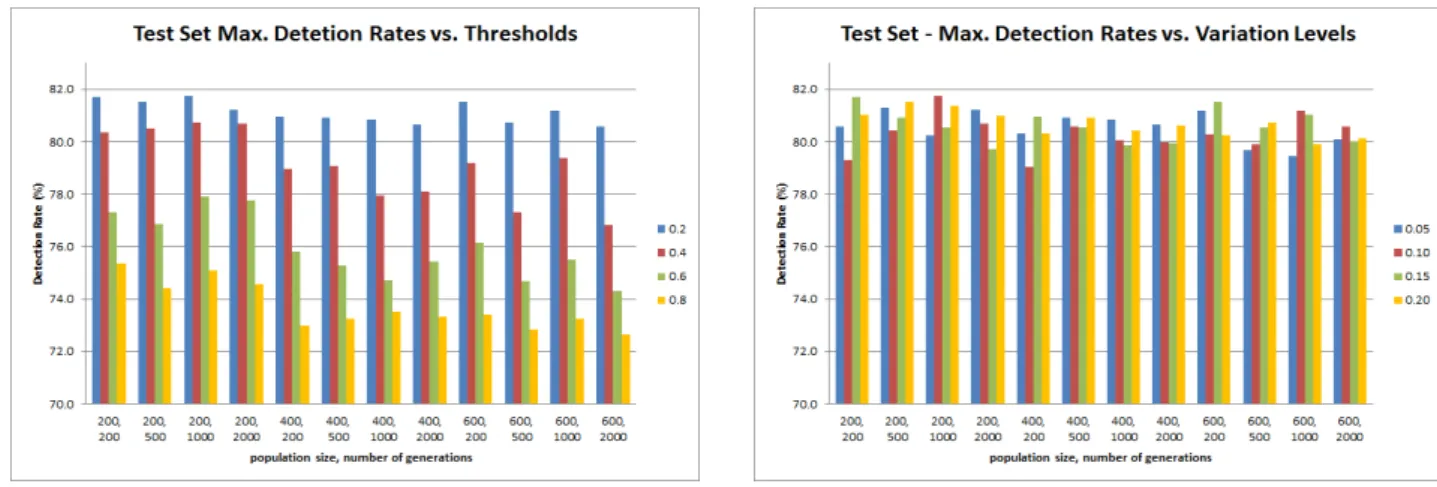
Figure 5: Minkowski Distance Maximum Detection Rates versus Threshold Levels.
higher threshold gives better results with detectors gener-ated by smaller populations. Using lower threshold gave better results when used with detectors generated by big-ger populations.
Comparing the maximum rates regarding variation lev-els, they are shown in Figures 6 and 7 for euclidean and minkowski distances respectively. With the euclidean dis-tance, detectors generated by less number of generations give better results with smaller variation levels. Higher variations levels are better for detectors generated by more number of generations. For the minkowski distance results, variation levels of 0.10 and 0.15 give higher detection rates with detectors generated by bigger population. But using less number of generations give better detection rates with lower variation levels (0.05 and 0.10).
5.4
Comparison analysis
In [33], they ran the machine learning algorithms imple-mented in the project WEKA [34] against the NSL-KDD Test Set. The detection accuracy is listed in table (2) along
Figure 6: Euclidean Distance Maximum Detection Rates versus Variation Levels.
Figure 7: Minkowski Distance Maximum Detection Rates versus Variation Levels.
with the suggested algorithm, and it shows that using the minkowski distance has very good detection accuracy com-pared to those approaches used
Classifier Classification
name accuracy
j47 81.05%
Naive Bayes 76.56%
NBTree 82.03%
Random Forest 80.67% Random Tree 81.59% Multi-layer Perception 77.41%
SVM 68.52%
Suggested Algorithm - Eu-clidean
81.76 %
Suggested Algorithm -Minkowski
82.13 %
Table 2: The classification accuracy of known classifiers
Figure 8: Minkowski Distance True Negatives Rates.
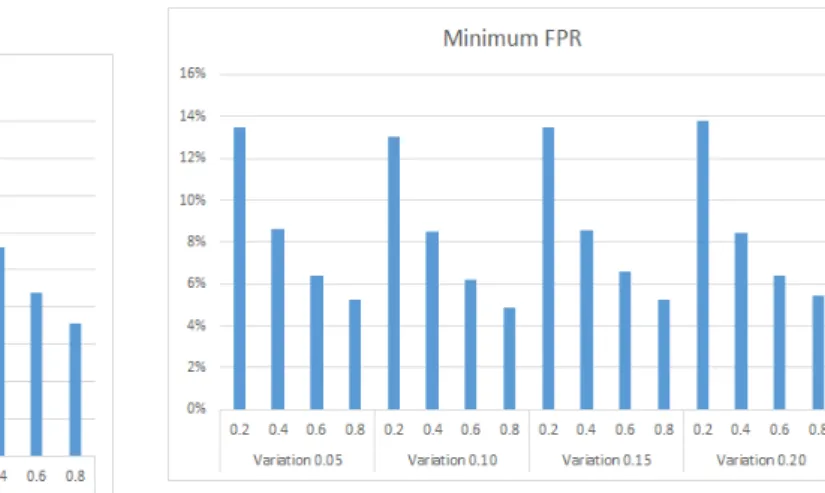
(2) — used in the experiment, low threshold values help detect more anomalous activities, especially with low vari-ation levels. Hence, as higher the threshold becomes, the higher the TNRs and the lower the TPRs, and it’s all shown in Figures 16 to 19.
5.5
Visualization of the correlation between
highly effective features
The first step applied here, is the selection of the most im-portant and effective features. A forward feature selection technique is applied on the input data set based on based on naïve Bayesian tree classification technique. The used input data set contains 2000 records, with a balanced dis-tribution between normal or abnormal system behaviour. For ensuring the effectiveness of the resulted accuracy, a 10 fold classification methodology is applied. The resulted classification accuracy after the selection of the features is 91.3%. The selected features sorted according their impor-tance from higher to lower are:
– dst_host_same_srv_rate,
– dst_host_same_src_port_rate,
Figure 9: Minkowski Distance False Positives Rates.
Figure 10: Minkowski Distance True Positives Rates.
– srv_serror_rate,
– srv_diff_host_rate,
– dst_host_srv_rerror_rate,
– dst_host_srv_diff_host_rate
In the second step, Formal Concept Analysis is applied on the data set containing only the selected features from the previous step. Figure 20 shows that attributes dst_host_same_srv_rate, dst_host_same_src_port_rate, srv_diff_host_rate, and dst_host_srv_diff_host_rate are highly correlated and represent the most effective features in the discrimination between normal and anomalous connections.
6
Conclusions and Future Work
Figure 11: Minkowski Distance False Negatives Rates.
Figure 12: Minkowski Distance Average True Negatives Rates.
algorithm combined with deterministic-crowding niching technique, applied on NSL-KDD IDS test data set under the scope of negative selection theory. The Minkowski or-der can be a small value (between 0 and 1) or a big value (up to infinity). Lower values of the order are aimed if one is interested in finding how much the objects are simi-lar. So, a value of 0.5 was used in the experiment. With all values used within the GA, the Minkowski distance function gave better detection rates. Threshold values give very good results in different cases – use detectors gener-ated by bigger populations with lower threshold values or use detectors generated by smaller populations with higher threshold values. Also, medium levels of variation are bet-ter used for best results (0.10 and 0.15). So, we recommend using smaller populations to generate detectors for: (1) tak-ing less time to run, and (2) give less number of detectors hence, less time detecting anomalies against the detectors set. Finally, it’s a matter of balancing between the IDS sensitivity (TPRs) and specificity (TNRs) that helps in the decision of which threshold and variability values to use for best results.
Figure 13: Minkowski Distance Average False Positives Rates.
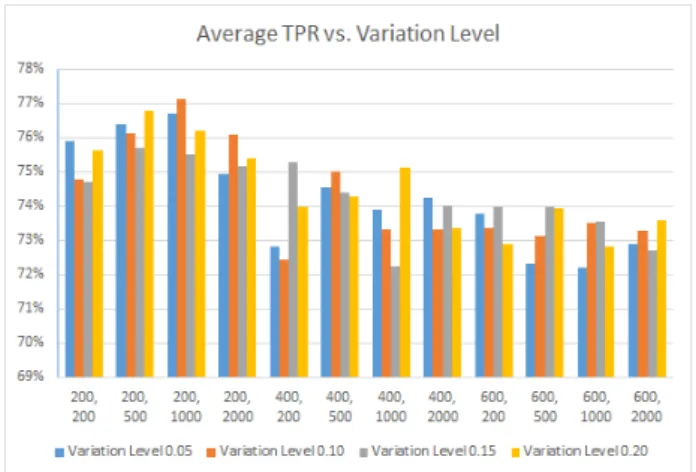
Figure 14: Minkowski Distance Average True Positive Rates.
Figure 16: Minkowski Distance Maximum True Positives Rates.
Figure 17: Minkowski Distance Minimum False Negatives Rates.
Figure 18: Minkowski Distance Maximum True Negatives Rates.
Figure 19: Minkowski Distance Minimum False Positives Rates.
Figure 20: Visualized correlation between highly effective features using FCA
References
[1] Varun Chandola (2009) Anomaly Detection for Sym-bolic Sequences and Time Series Data, PhD. Disser-tation. Computer Science Department, University of Minnesota, http:// purl.umn.edu/56597.
[2] Fabio A. Gonzalez and Dipankar Dasgupta (2002) An Immunity-based Technique to Characterize Intru-sions in Computer Network, IEEE Transactions on Evolutionary Computation, Vol. 6(3), pp. 281-291. [3] Fabio A. Gonzalez and Dipankar Dasgupta, (2002)
An Immunogenetic Technique to Detect Anoma-lies in Network Traffic Proceedings of the Ge-netic and Evolutionary Computation Conference, GECCO, Morgan Kaufman, pp.1081-1088.
[4] R.A. Kemmerer and G. Vigna (2002) Intrusion De-tection: A Brief History and Overview, IEEE Com-puter, Vol. 1(1), pp. 27 - 30.
http://www.windowsecurity.com/articles/ids-part2-classification-methods-techniques.html.
[6] Tarek S. Sobh and Wael M. Mostafa (2011) A co-operative immunological approach for detecting net-work anomaly", Applied Soft Computing, Elsevier, Vol. 11(1), pp. 1275-1283.
[7] P. Garcia Teodorro, J. Diaz-Verdejo, G. Marcia-Fernandez, E. Vazquez (2009) Anomaly-based net-work intrusion detection: Techniques, systems and challenges, Computers and Security, Elsevier, Vol. 28(1-2), pp.18-28.
[8] Wei Li (2004) Using Genetic Algorithm for Net-work Intrusion Detection", Proceedings of the United States Department of Energy Cyber Security Grou, Training Conference, Vol. 8, pp. 24-27.
[9] S.X. Wu and W. Banzhaf (2010) The use of computa-tional intelligence in intrusion detection systems: A review, Applied Soft Computing, Vol. 10, pp. 1-35. [10] L.N. De Castro and J. Timmi (2002) Artificial
Im-mune Systems: a new computational intelligence ap-proach, Springer, Book Chapter, 1st Edition., XVIII, 380 p.
[11] Dipanker Dasgupta (2006) Advances in Artificial Immune Systems, IEEE Computational Intelligence Magazine, Vol. 1(4), pp. 40-49.
[12] U. Aickelin and D. Dasgupta (2003) Artificial Im-mune Systems, Book Chapter, Search Methodolo-gies: Introductory Tutorials in optimization and de-cision support techniques, Springer, pp. 375-399. [13] Julie Greensmith, Amanda Whitbrook, Uwe
Aick-elin (2010) Artificial Immune Systems, Handbook of Metaheuristics, International Series in Opera-tions Research and Management Science, Springer, Springer US, Vol. 146, pp. 421-448.
[14] Dipankar Dasgupta, Senhua Yu, Fernando Nino (2011) Recent Advances in Artificial Immune Sys-tems: Models and Applications, Applied Soft Com-puting, , Vol. 11(2), pp. 1574-1587.
[15] Mehdi Kaytoue, Sébastien Duplessis, Sergei O. Kuznetsov and Amedeo Napoli (2009) Two FCA-Based Methods for Mining Gen Expression Data", Lecture Notes in Computer Science, Vol. 5548, pp. 251-266.
[16] Richard Cole, Peter Eklund, Don Walker (1998) Us-ing Conceptual ScalUs-ing In Formal Concept Analy-sis For Knowledge And Data Discovery In Medi-cal Texts", Proceedings of the Second Pacific Asian Conference on Knowledge Discovery and Data Min-ing, pp. 378-379.
[17] Wei Li and Issa Traore (2004) Detecting New Forms of Network Intrusion Using Genetic Programming", Computational Intelligence, Vol. 20(3), pp. 475-494. [18] Anup Goyal, Chetan Kumar (2008) GA-NIDS: A Genetic Algorithm based Network Intrusion Detec-tion System.
[19] M. M. Pillai, Jan H. P. Eloff, H. S. Venter (2004) An Approach to implement Network Intrusion Detection System Using Genetic Algorithms", SAICSIT ’04 Proceedings of the 2004 annual research conference of the South African institute of computer scientists and information technologists on IT research in de-veloping countries, pp. 221-221.
[20] McFadden (2008) Genetic Algorithms and Network Intrusion Detection", MBI 640 Data Communica-tions & Network Security, Northern Kentucky Uni-versity.
[21] Hossein M. Shirazi and Kalaji Y (2010) An Intelli-gent Intrusion Detection System Using Genetic Al-gorithms and Feature Selection", Majlesi Journal of Electrical Engineering, Vol. 4, No. 1, pp. 33-37. [22] Fan Li (2010) Hybrid Neural Network Intrusion
De-tection System Using Genetic Algorithm, Multime-dia Technology (ICMT), International Conference, pp. 1-4.
[23] Sadiq Ali M Khan. (2011) Rule based Network In-trusion Detection using Genetic Algorithm, Interna-tional Journal of Computer Applications, Vol. 18, Np. 8, pp. 26-29, Published by Foundation of Com-puter Science.
[24] Mohammad Sazzadul Hoque, Md. Abdul Mukit, Md. Abu Naser Bikas (2012) An Implementation of In-trusion Detection System using Genetic Algorithm, International Journal of Network Security & Its Ap-plications, Vol. 4, No. 2, pp. 109-120.
[25] Alabsi,F. and Naoum,R. (2012) Fitness Function for Genetic Algorithm used in Intrusion Detection Sys-tem". International Journal of Applied Science and Technology, Vol. 2, No. 4, pp. 129-134.
[26] Kshirsagar, Vivek K., Sonali M. Tidke, and Swati Vishnu (2012) Intrusion Detection System using Ge-netic Algorithm and Data Mining: An Overview., In-ternational Journal of Computer Science and Infor-matics ISSN (PRINT): pp. 2231-5292.
[27] Owais, Suhail, Vaclav Snasel, Pavel Kromer, and Ajith Abraham (2008) Survey: using genetic algo-rithm approach in intrusion detection systems tech-niques, In IEEE Computer Information Systems and Industrial Management Applications, CISIM’08. 7th, pp. 300-307.
[28] Amira Sayed A. Aziz, Mostafa Salama, Aboul ella Hassanien, Sanaa EL-Ola Hanafi (2012) Detectors Generation using Genetic Algorithm for a Negative Selection Inspired Anomaly Network Intrusion De-tection System", In proceeding of: IEEE FedCSIS, At Wroclaw, Poland, pp. 625-631, ISBN 978-83-60810-51-4.
[29] Ole Mengshoel and David E. Goldberg (2008) The Crowding Approach to Niching in Genetic Algo-rithms, Evolutionary Computation, MIT Press Cam-bridge, Vol. 16(3), pp. 315-354.
[31] John P. Van de Geer (2003) Some Aspects of Minkowski Distances, Department of Data Theory, Leiden University, RR-95-03.
[32] NSL-KDD data set, http://nsl.cs.unb.ca/NSL-KDD/ [33] M. Tavallaee, E. Bagheri, W. Lu, A. A. Ghorbani
(2009) A detailed analysis of the KDD CUP 99 data set, IEEE Symposium on Computational Intelligence for Security and Defense Applications, CISDA, pp. 1-6.