An Integrated Knowledge Base
for Modelling and Predicting Vehicle
Real-world Emissions as a Function
of Driving Behaviour Kinematics
Mario Rapone
†, Livia Della Ragione and Giovanni Meccariello
Istituto Motori CNR, Naples, Italy
A multivariate modelling approach was developed by Istituto Motori to model and predict vehicle real-world emissions. Complex driving kinematics is represented by two blocks of variables, which require the development of a hierarchical multiblock emission model, where the two blocks of variables represent overall and instanta-neous features of each driving cycle associated to a trip. The multiblock model was applied to analyze and model emissions of the large database built in the ARTEMIS project. In this database we collected emission measure-ments performed in European laboratories relative to real driving cycles which are statistically representative of many European traffic/road conditions from congested to rush-hour traffic in urban, rural and highway roads. Data concern a varied fleet of vehicles differing in technology and class. To develop a tool useful for mobility analysts for traffic environmental impact assessment, a knowledge base was envisaged to integrate the data warehouse and the model base to build a user interface for driving cycle kinematics and emission analysis. In this paper the modelling approach is presented together with overall emission and driving kinematics characterization based on experimental results, as well as functional analysis of the knowledge base structure and the information tool.
Keywords: hierarchical PLS multiblock, kinematic pa-rameters, decision support systems (DSS), real-world emissions, data warehouse
1. Introduction
The effect of greenhouse gases on climate has gained global interest and pushed top level pol-icy and decision-makers to promote action for the reduction of emissions.
Kyoto 2008 will define scenarios, policy and strategies for the control of CO2 produced by each country.
Transport activities contribute significantly to air pollutant emissions. Besides CO2,other traf-fic emissions have a major impact on human health, and for historical towns, on architectural heritage. Evalution of emissions has therefore gained institutional importance in the interna-tional community.
The most commonly used macro-scale emission models used in the USA are MOBILE 6(EPA U.S. Environmental Protection Agency)[1]and EMFAC(CARB California Environmental Pro-tection Agency Air Resources Board) [2]. MO-BILE 6 predicts average emission(expressed as g/mile)of regulated pollutants and toxics from LDV, HD, and motorcycles under various con-ditions, related to in-use emission levels speci-fied by different factors, like ambient tempera-ture, average traffic speed etc. EMFAC predicts emissions with only average trip speed as kine-matic input and calculates emission rates both for light duty passenger cars and heavy duty trucks, for highways, freeways and local roads in California. In particular, emission rates are multiplied by vehicle activity data (measured, for example, as miles driven per day)to calcu-late regional emission inventories. These mod-els work well for large regional areas and they cannot be utilized for macro and meso scales. In Europe, different meso scale models have been developed. COPERT III and its more re-cent version COPERT IV, developed in Europe by the LAT (Laboratory of Applied Thermo-dynamics-Aristotle University) [3], is an aver-age speed model for centralized emission esti-mation. This model is the official method of the EEA European Environmental Agency for emission calculations and in the new version it takes account of the technology category and fu-ture emission standards. Also, in the context of ARTEMIS EU project[4], different models have been developed, classified as traffic situation models and kinematic models. Since 1998, IN-FRAS (Switzerland) in cooperation with Ger-many and Austria, has developed the HBEFA Handbook Emission Factors for Road Trans-port(HBEFA). This model considers kinematic aspects through traffic situations, intended as a combination of road and traffic parameters. The model provides emission factors for all current vehicle categories (PC, LDV, HDV and motor cycles), each divided into different categories, for a wide variety of traffic situations. The latest version is 2.1 and dates from February 2004, in which the emission factors of the HDV(heavy duty vehicles) are completely revised and new measurements for all vehicle categories up to EURO3 are included. The kinematic model ap-proach in ARTEMIS was developed by Rapone
[5], and it predicts average emissions on a micro-trip (driving pattern) obtaining a detailed
de-scription of the velocity profile using a multi-dimensional approach. This kinematic model
(Kinematic Emission Model KEM) is defined as a meso-scale emission model, and it is to be pointed out that it may require less detailed in-formation with respect to instantaneous models. Also, it is based on the analysis of an existing huge emissions database(different fleet compo-sition, different driving sub-cycle and laborato-ries involved in the emissions measurements), coming from the ARTEMIS EU project. Within the kinematic approach, the last version of VERSIT+LD[6]is also to be considered. It is a new generation emission factor model based on a multiple regression model, that calculates emission factors for passenger cars as a function of driving cycle characteristics.
In the United States, since 1995 CE-CERT at the University of California-Riverside de-veloped the so-called CMEM Comprehensive Modal Emission Model [7-8-9-10], a modal emission model for light duty vehicles and small trucks. In this model, emissions are calculated as a function of the vehicle operating mode. The CMEM is also able to predict second-by-second emissions and fuel consumption for a wide range of vehicle and technology cate-gories, also for extremely low emitting vehicles
[11].
A set of meso and micro scale models has been constructed by the TRL Transport Re-search Laboratory. The TRL model set evalu-ates and compares instantaneous emission mod-els[12], PHEM(passenger car parts and heavy duty parts), VeTESS(vehicle transient emission simulation model)and the extended version of MODEM. These models calculate emissions for any vehicle operating profile, but they require detailed and precise information on vehicle op-eration and also geographical location.
In this paper, the DSS structure and the mod-elling approach are presented, together with some results of the driving behavior kinemat-ics analysis and predicted emission factors of a case study, Euro III gasoline passenger cars in the 1200-1400 cc displacement range.
2. Information System (IS) Structure
As a basic requirement, the DSS should contain:
(1) an intuitive and flexible interface;
(2) a guide to problem formulation;
(3) a (possibly automatic) way for choosing the(best)solution method;
(4) a set of rules for sensitivity analysis;
(5) an information retrieval system for previ-ously solved cases;
(6) a (possibly/perhaps automatic) procedure for adapting previously rejected items. In discussing these points it should be noted that they refer to a DSS for research purposes. However, items (2), (4), and partly (3), are of no interest to the management activity of the DSS. In addition to the above feature and bearing [13]in mind, it would seem useful for us to formulate a “TOOLBOX” principle of a DSS organization [14]. Implementation of this principle means that the DSS should contain a universal set of tools (as for the DSS with re-search activity, but not to a very great extent)
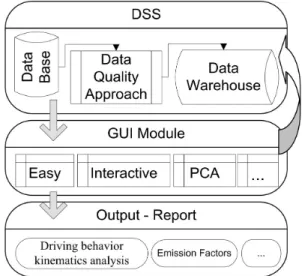
which allows various problems to be solved by a set of users who have different professional requirements. Of course, separate modules for separate problems are required for the principle realization. It is worth noting that the proposed universality of the DSS implies the possibility of different approaches to be used for solving the same problems. Accordingly, the flow dia-gram(Figure 1)of the DSS may contain parallel branches, and the actual set of modules used to solve a problem should be user-defined. This feature of the DSS makes it necessary to de-velop rigorous formats of information (input, output and intermediate). Some tools for DSS file handling(archive, update, delete, etc.) are also required.
Figure 1.IS structure.
3. The Data Warehouse
Starting from the ARTEMIS database, a struc-tured data warehouse is built. In the database, a large number of driving cycles(about 203 cy-cles divided into 671 sub-cycy-cles) are used for measuring emission factors. In all, 2753 tests are carried out by 11 European laboratories as follows:
– 537 tests to look at the influence of driving patterns
– 1334 tests to look at the influence of vehicle parameters
– 672 tests to look at the influence of labora-tory related parameters
– 210 tests are part of the round robin test. The tests are specifically grouped into 17 task conditions to test several vehicle parameters and laboratory conditions. All tests are performed by 183 different vehicles in terms of fuel and emission standards(pre-Euro 1, Euro 1 to Euro 4) [15].
Making reference to ARTEMIS data base ver-sion 20050114, the vehicle fleet is divided into several sets, starting from homologation(Euro 1 to Euro 4) and displacement factors. Three classes of displacement are assumed: 1200– 1400 cc, 1400–2000, over 2000.
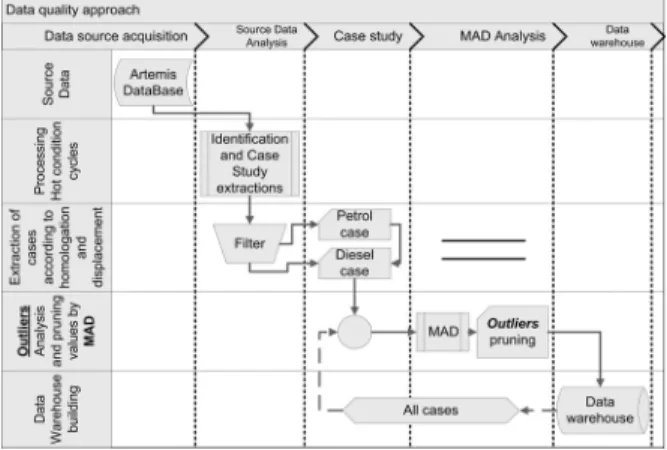
To obtain a useful data warehouse, the data qual-ity approach, shown in the following flow chart
Figure 2.Flow chart of data quality approach.
After the identification of sets, grouping the data starting from homologation and displacement, a median absolute deviation (MAD) approach is used. MAD is a resistant measure of the variability of an univariate sample and, able to identify the presence of one or more outliers. This allows us to identify the presence of out-lier values in the data and avoid inserting them in the data warehouse. The procedure is iterated for each case.
Moreover, for each case to consider the effect of different vehicles, a specific PLS model is calculated to evidence characteristic trends in emissions and any abnormal values, through the use of dummy variables. These variables allow evaluation of the individual weights of the ve-hicle coefficients with respect to the pollutants. By using these coefficients, we can identify the percentage effect of any vehicle on a particular emission factor and establish a cut-off point for vehicles considered normal emittersfromhigh emitters. Finally, vehicles considered as out-liers must be identified and excluded from the training process of emission factors[16].
4. The Core of IS: the Model Base
As regards the approach developed in the ARTEMIS project, some studies were devel-oped to take driving behavior into account and to link emissions with kinematics. The kine-matic approach and traffic situation approach
[5-16-17]were adopted to analyze emission data of different combinations of vehicle types and driving behavior. In this approach it is impor-tant to stress the large number of kinematic pa-rameters used to characterize the kinematics of
driving cycles that lead to a very powerful and flexible emission model, yet which are rather complex in statistical and mathematical terms. Hereinafter, mathematical aspects and equa-tions of KEM are presented. A consistent set of kinematic parameters is used to represent the real-world driving behavior of vehicles in any traffic situation. In KEM, the response consid-ered is the measured unit emission mass of CO, HC, NOx, CO2(expressed in g/km), measured in a driving cycle(DC), that is a portion of a trip. A log-transform ofYij (ηij = lnYij) is applied
because emission quantities are(in most cases) close to zero with a large coefficient of varia-tion and because emission data are distributed according to a lognormal distribution. The ex-plicative variables characterize the kinematics of driving cycles. These variables are identified by considering emission variation as explained by the variation in exhaust mass (function of energy spent by the vehicle in a driving cy-cle), and the frequency of acceleration events at different speeds. Two blocks of variables are then associated to the different aspects: the first is formed by variables related to the dynamic vehicle equation, plus idling time to consider stand-still phase emission production. The sec-ond block of 42 variables summarizes kinematic acceleration events in DC, whose distribution especially affects CO, HC and NOX emissions. Also, speed/acceleration distribution is utilized in ARTEMIS to analyze and determine driving cycle features.
Because of collinearity of variables highly cor-related with each other in different groups rep-resenting different kinematic aspects of differ-ent DCs, Principal Compondiffer-ent Analysis and the Partial Least Squares(PLS)Regression[ 17-18-19]based on PCA variables statistical methods are implemented in IS. The NIPALS algorithm is applied to estimate the regression model. Then the following two regression equations are defined for the two blocks:
lnYij =a0+a1MV+a2MV2+a3MV3
+a4MVA POS+a5Trunning (1)
+a6Tidle+a7Invdist+εij
whereMV is mean speed,MV2 is mean square speed andMV3 is mean cubic speed;MVA POS is the mean product of instantaneous speed(v)
Tidleis the idle time of the driving cycle;Invdist is the reciprocal of the trip length anda1–a7are the regression coefficients;
lnYij=b0+b1FS V20a1+b2FS V20a2
+...+b42FS V101a7+εij (2)
where FS Viaj for i = 1, . . . ,6, j = 1, . . . ,7
is the centered log-transform of cycle time fre-quency in the cell determined by six classes of speed and seven classes of acceleration, andb1– b42 are the regression coefficients.
In both equations random noise ε is assumed to be a normally distributed random variable,
ε ∼N(0,σ2).
According to a multi-block approach(MBPLS)
[5], a base model 1 is defined for block1 and a base model 2 is calculated for block2 of vari-ables. Then the super block regression model, named top model, is built, making the regres-sion of Y-variables on the union of scores of the two base models.
The equation is:
lnYij=C1M1.T1+C2M2.T2+. . .+CkM1.Tk +Ck+1M2.T1+Ck+2M2.T2 (3)
+. . .+CKM2.Tk
where T1. . .Tk and Tk+1, . . .Tk are the two
sets of principal components estimated sepa-rately for each block of variables, fitting the two base models previously defined. Thus these su-per scores are the union of scores of the two base models and this so-called top model estimates the coefficient CK and the predicted values of
regression of lnY on the set ofXvariables. The effect of individual vehicles on the response is assessed by developing a further regression equation made of dummy variables, one for each vehicle. Then avehicle effectbase model is cal-culated.
Emission factors can be calculated from each of the four models according to the level of analy-sis and to each specific case study.
It is then necessary to apply a retransformation of lnY to obtain emission factors in original scale[20]. The formula used to calculate model expectations is:
E[p,veh.class] =Y =
explnY + (RMSEE)2/2 (4)
Since a log transformation was applied to re-sponse variables, quantities predicted by model
[E(lnY)]must be retransformed in original scale to get emission factors in original unit g/km.
5. The User Interface
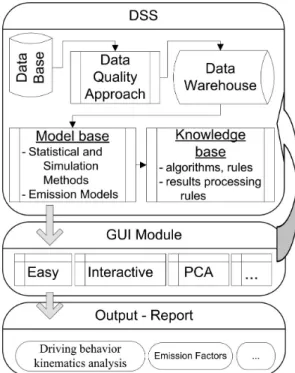
The effectiveness of DSS is assured by a set of tools, and the graphical user interface(GUI) module, that interact with the data warehouse. As the DSS is flexible, it is possible in the future to insert a new level of interaction. As a starting point in the development concept design, we can identify three levels(Figure 3):
Figure 3.DSS development concept design.
Easy module: able to predict emission factors based on the input of several parameters. The input variables are:
– Driving cycle profile;
– Homologation and displacement; – Model parameters;
Interactive module: able to select several pa-rameters or block information in the data ware-house to rebuild the MBPLS and obtain new regression coefficients to update the DSS and use the new information in the easy module.
PCA module: able to analyze a new set of driv-ing cycles and relative pollution not contained in the historical data warehouse. The tool, based on Principal Component Analysis, provides an-alysts with the possibility of exploring their own driving cycles, in terms of exploratory and con-firmatory emission factor analysis, and updating the database.
6. Applications and Results
Application concerns a selected case study, the Euro III gasoline passenger car in the 1200– 1400 cc displacement range. Some results of the driving behavior kinematics analysis and predicted emission factors are shown.
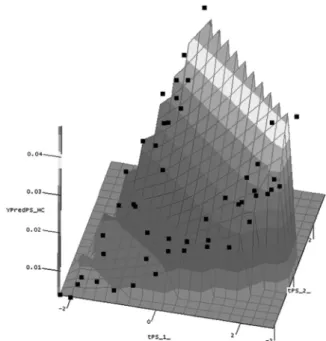
Choosing theEasymodule, it is possible, by se-lecting the right parameter input, to obtain sev-eral representations of predicted emission fac-tors. In Figures 4 and 5, a 3D surface plot of predicted CO2 and HC in g/km on first two scores is shown. In agreement with principal components, predicted CO2 values are higher for urban and motorway DC than for rural. By selecting the PCA module it is possible, in terms of Principal Component Analysis, to study the driving behavior kinematics of all driving cycles. The relation of principal com-ponents(PC) (t1, t2)with observations(driving cycles), is shown in Figure 6. These scores are new variables computed as a linear combination of all the original variables to provide a good summary. This graphical representation shows the kinematics distribution of driving behavior and the possible presence of outliers, groups or other patterns in the data. This kind of analysis is useful to explore new DCs with respect to the database and also to improve and update it. In Figure 6 we can identify three groupings of DCs: urban, rural and motorway. This distribu-tion depends on the original variables that were used to build the model. In fact the first PC is positive related with slow DC with high Invdist and high Tidle. The second PC is positive re-lated with low and constant level of acceleration at high speed.
Figure 4.3D surface plot of predicted CO2(YPredPS)
in g/km on tPS 1 vs tPS 2 score.
Figure 5.3D surface plot of predicted HC YPredPS) in g/km on tPS 1 vs tPS 2 score.
7. Conclusion
A comprehensive modelling approach was de-veloped and validated by statistical methods, as well as by comparison with other models. A DSS was designed to transform a modelling approach into an effective real-world emission analysis and predicting tool, both for research and for policy making.
The DSS components available are a large Emis-sion Data Base and the Model computing mod-ules. The flexibility of the DSS allows new levels of interaction to be inserted in the IS. Automation of computing processes requires the implementation of a Data Warehouse and a Model Base. The most strategic task is the elaboration of a graphical user interface (GUI)
for the production of reports. This is the tool of DSS which interacts with the user, to make a query and receive a response.
A minimum example of DSS potential is shown by the output relative to a case study. The full development of DSS is in progress.
8. Acknowledgments
Experimental data reported in the paper were obtained in the research work carried out within the EU Artemis project and under a convention between Istituto Motori and the Italian Min-istry of the Environment and Land Conservation
(MATT).
References
[1] R. A. GIANNELLI, S. SRIVASTAVA, G. DOLCE, Sensi-tivity Analysis of MOBILE6.0, EPA420-R-02-035, 2002.
[2] EMFAC2007 Calculating emission inventories for vehicles in California http://www.arb.ca.gov /msei/onroad/downloads/docs/user guide emfac2007.pdf
[3] LEONIDAS NTZIACHRISTOS, CHARIS KOURIDIS,
SAVAS GEIVANIDIS, ATHANASIOS SAMARAS ZISSIS
MAMAKOS,COPERT 4 Methodology and Software
Updates, LAT Aristotle University Thessaloniki; 2006.
[4] R. JOUMARD, J. M. ANDRE, M. RAPONE, Emission
factor modelling and database for light vehicles Artemis deliverable 3, 2007.
[5] M. RAPONE, M.V. PRATI, M.A. COSTAGLIOLA, L.
DELLARAGIONE, G. MECCARIELLO, Emission Fac-tors Determination of Euro III 1,200- to 1,400-cc Petrol Passenger Cars with a PLS Multivariate Re-gression Model,Journal Environmental Modelling and Assessment, Springer Netherlands, ISSN 1420– 2026(Print)1573–2967(Online).
[6] R. SMIT, R. SMOKERS, E. SCHOEN, VERSIT+LD
Development of a new emission factor model for passenger cars linking real world emissions to driv-ing cycle characteristics,14th International Confer-ence Transport and Air Pollution, 2005.
[7] D. SCHULZ, T. YOUNGLOVE ANDM. BARTH,
Statis-tical Analysis and Model Validation of Automobile Emissions,Journal of Transportation and Statistics, 2000
[8] M. BARTH, F. AN, T. YOUNGLOVE, G. SCORA, C.
LEVINE, CMEM Comprehensive Modal Emissions
Model User’s Guide version 2.0, NCHRP Project 25–11, January 2000
[9] M. BARTH, C. MALCOLM, N. HILL, T. YOUNGLOVE,
Recent Validation Efforts for a Comprehensive Modal Emissions Model,Transportation Research Board 80th Annual Meeting, 2001
[10] M. BARTH, J. COLLINS, G. SCORA, N. DAVIS, J. NOR -BECK, Measuring and Modelling Emissions from
Extremely Low Emitting Vehicles, Transportation Research Record(Transp. Res. Rec.)ISSN 0361-1981 CODEN TRREDM , Air quality 2006 [11] M. BARTH, T. YOUNGLOVE, C. MALCOLM, G.
SCORA, Mobile Source Emissions New Genera-tion Model: Using A Hybrid Database PredicGenera-tion Technique,U.S. Environmental Protection Agency ASD01-TS-26655-02-DFR, February 2002 [12] T. J. BARLOW, P. G. BOULTER, I. S. MCCRAE,
Scop-ing study on the potential for instantaneous emission modelling: summary report, TRL framework con-tract no. 3/323-R041, 2007.
[13] R. ENGELMORE, T. MORGAN, Blackboard systems, Addison – Wesley, Wokingham, England, 1988 [14] B. SHMULYIAN, A. FEDOTOV, L. HEIFITS, SH. IMEL
-BAYEV, G. KIRSANOVA, Information technology for urban land-use and transport analysis: principle and data-handler.AIRO’90 Conference, Sorrento, Italy, 1990
[15] R. JOUMARD, M. ANDRE´, J. LAURIKKO, T. LEANH, S. GEIVANIDIS, Z. SAMARAS, Z. OLAH´ , P. DEVAUX, J.
M. ANDRE´, E. CORNELIS, P. ROUVEIROLLES, S. LA -COUR, M. V. PRATI, R. VERMEULEN, M. ZALLINGER,
Accuracy of exhaust emissions measurements on ve-hicle bench(Artemis deliverable 2),INRETS report, Bron, France, Report no. LTE 0522 2006.
[16] M. RAPONE, M. V. PRATI, G. MECCARIELLO, L.
DELLA RAGIONE, M. A. COSTAGLIOLA, A Novel
[17] M. TENENHAUS, La regression PLS Theorie et
Pra-tique, Editions Technip Paris, 1998.
[18] S. WOLD, M. SJOSTROM, L. ERIKSSON, PLS-regression: a basic tool of chemometrics, Chemo-metrics and Intelligent Laboratory Systems 58, 2001, pp. 109–130.
[19] J. A. WESTERHUIS, T. KOURTI, J. F. MACGREGOR,
Analysis of Multiblock and Hierarchical PCA and PLS Models, J. of Chemometrics; 1998, 12, pp. 301–321.
[20] N. DUANSmearing Estimate, A nonparametric
re-transformation method,Journal of American Statis-tical Association, September 1983, pp. 78–383.
Received:June, 2008 Accepted:September, 2008
Contact addresses: Mario Rapone† Istituto Motori CNR via Marconi 8 80125 Naples Italy Fax+39 081 2396097 e-mail:[email protected]
Livia Della Ragione Istituto Motori CNR via Marconi 8 80125 Naples Italy Fax+39 081 2396097 e-mail:[email protected]
Giovanni Meccariello Istituto Motori CNR via Marconi 8 80125 Naples Italy Fax+39 081 2396097 e-mail:[email protected]
DR. MARIORAPONE†graduated in mechanical engineering(University of Naples). His experience is in statistical modeling application to en-gineering with particular concern to transportation systems. Major top-ics regard Transportation System reliability and environmental impact. Recent scientific results regard experimental detection and modeling of real use vehicle performance and emissions, with reference to passenger cars and buses.
DR. LIVIADELLARAGIONEgraduated in 1988 in mathematics from the University of Naples “Federico II”(Italy). Currently, she is a researcher of CNR-IM. Her main research activities concern the environmental impact of vehicles. Her principal areas of interest include multivariate statistical analysis and time series analysis. The main research sub-jects are vehicle mission profile in urban areas and the development of methods for the evaluation of exhaust emissions as a function of vehicle operating conditions in the traffic. In this context she has developed some statistical codes applied to determine driving cycles by vehicle speed records in the traffic obtained by instrumented cars performing planned. Also, she is involved in the development of models for vehicu-lar emission factors determination based on measurements of pollutant emissions.
Dr. Della Ragione is responsible of research group working on “Statis-tical methods for driving cycle modelling and emission factors devel-opment”.