APES Unit I Review
Enviro. Issues
Interconnected/rapidly growing
1. Population growth
2. Increasing resource use 3. Global climate change
4. Premature extinction of plants/animals 5. Pollution
Exponential Growth
The Earth can survive without man, man cannot survive without the Earth.
• Sun – ultimate source of energy
• Solar Capital – direct from sun, indirect – wind, biomass, hydropower
• Natural capital - air, water, soil, wildlife, forests, fisheries, minerals, natural biogeochemical
Economic Development
Improvement of living standards by economic growth
Based on per capita GNI and degree of industrialization
2 Groups
• Developed countries – US, Japan, Europe, Canada, New Zealand, Australia
Globalization
• Global social, economic, and environmental change leading to an integrated world
• Signs:
1. Economic – international trade 2. Information and communication
3. Environmental effects – infectious disease (H1N1 virus), spread of long-lived pollutants Grasshopper effect: pollutants found in the
Pollution
any addition to air, water, soil, or food that
Types of Pollution Sources
1. Point Source – identifiable source – smokestack, industrial discharge, wastewater treatment plant
2. Nonpoint Source – difficult to identify – dispersed – runoff from farms, lawns, golf courses (contains fertilizers,
pesticides), runoff from urban areas (contains oils, grease)
Basic Causes
MODELS AND BEHAVIOR OF
SYSTEMS
• Usefulness of models
– Complex systems are predicted by developing a model of its inputs, throughputs (flows), and
outputs of matter, energy and information. – Models are simplifications of “real-life”.
Systems can be affected by
1. Feedback loops 2. Time delays
1. Feedback Loops:
• Outputs of matter, energy, or information fed back into a system can cause the system to do more or less of what it was doing.
– Positive feedback loop causes a system to
change further in the same direction (e.g. money earning interest)
2. Time delays
• Time delays in a system in which the effects are not know for some time • Allows the problem to
build up slowly and then whole system changes
Ex: population growth, toxic waste leaks, forest
destruction from air pollutant
3. Synergy
• 2 or more processes combined have a
greater effect on a system than the sum of each would have.
Law of conservation of problems
“We can never do just one thing”
• Solution for a problem usually leads to other problems
Ex: addition of MTBE to gasoline to reduce air pollution, then polluted groundwater
• Must consider when we search for solutions
• Systems are interconnected
Matter: Forms, structure, quality
Important Compounds
• Chlorinated hydrocarbons: C, H, Cl
DDT, PCB’s (polychlorinated biphenyls) • Chlorofluorocarbons (CFC’s) freon
• N2O nitrous oxide NO nitric oxide
• NO2 nitrogen dioxide CO carbon monoxide • SO2 sulfur dioxide NH3 ammonia
Matter quality
• A measure of how useful a form of matter is as a resource based on availability and concentration
• High quality – concentrated, found near Earth’s surface, great potential for use Coal, Salt, Al can
• Low quality – dilute, found deep
underground or in ocean, in atmosphere with little potential for use.
ENERGY
• Energy is the ability to do work and transfer heat.
– Kinetic energy – energy in motion
• heat, electromagnetic radiation
– Potential energy – stored for possible use
Energy Quality
• High quality – concentrated/useful electricity, chem energy in coal/gasoline • Low quality – dispersed/ little ability to do
Chem/Phys Changes
Law of conservation of matter“There is no away”
Can’t get rid of anything – will show up somewhere else.
Factors determining harmful effects of pollutants:
1. Chemical nature: Hg vs. Cu
2. Concentration: PPM, PPB, PPT
Categories of Persistence
1. Degradable, nonpersistent – broken down to acceptable levels by natural processes
Biodegradable – by living organisms
2. Slowly degradable, persistent – takes decades or longer DDT (
Dichloro-Diphenyl-Trichloroethane)and most plastics
Half life
• Amount of time needed for ½ of the nuclei in a radioisotope to decay to more stable isotope.
• Generally takes 10 - ½ lives for an isotope to decay to a safe state.
ENERGY LAWS
• The first law of thermodynamics: we cannot create or destroy energy.
– We can change energy from one form to another. • The second law of thermodynamics: energy
quality always decreases.
– When energy changes from one form to another, it is always degraded to a more dispersed form. – Usually takes the form of heat given off at lower
Energy Efficiency
• A measure of how much useful work is accomplished by a particular input of energy into a system
• Only about 16% of the energy used in the US ends up performing useful work.
• Wasted through the 2nd law or
How does 2
ndLaw affect life?
• Use high quality energy to maintain
molecules & biochemical processes, and then give off low quality heat to your
surroundings
Best solution is low-throughput economy
• Reuse and recycle most nonrenewableresources
• Use renewable resources sustainably • Efficient use of matter/energy resources • Reduce unnecessary consumption
• Emphasize pollution prevention and waste reduction
Chapter 4
Ecosystems:
Components, Energy
Flow and Matter
I. Levels of organization
• Biosphere
• Ecosystem
• Community
• Population
A. Organism – 1
stlevel
• Cell – basic unit of life
Classify cells as (according to cellular structure)
1. Eukaryotic –Surrounded by membrane, membrane bound nucleus, internal
structures – organelles
2. Prokaryotic – cell membrane, but no organized nucleus or organelles. BacT Eukaryotes cannot exist without
Species
• Groups of organisms that resemble one another in appearance, behavior, chemistry and genetic makeup
• In organisms utilizing sexual reproduction – organisms that can breed with one another to produce fertile offspring
B. Population -2
ndlevel
• Group of interacting individuals of the same species that occupy the same area at the same time
Ex: all white oak trees in a forest
Populations change in response to
environment:
1. Size
2. Age distribution 3. Density
Population Terms
• Habitat – place a population lives address
• Niche – general term for the role of a
C. Community – 3
rdlevel
• Populations of different species living in the same place at the same time – all the plants, animal, and microorganisms
D. Ecosystem – 4th Level
• Community and its nonliving environment of matter and energy
Biosphere – 5
thLevel
• All of the earth’sAtmosphere
1. Troposphere – inner layer , 11 miles high 78% N2 21% O2 others, H2 He
2. Stratosphere – 11-30 miles contains ozone layer (filters harmful UV radiation)
Hydrosphere
1. Liquid water – surface and groundwater 2. Ice – polar ice, icebergs, permafrost
Lithosphere
• Earth’s crust and upper mantle
What Happens to Solar Energy
Reaching the Earth?
• Solar energy
Ecosystems: Concepts and Components
• Biome: terrestrial region of the biosphere that has a distinct climate & specific life forms
adapted to it.
• Climate: long term pattern of weather • Aquatic life zones:
Ex: freshwater – lakes, streams, rivers
Ecosystems Boundaries
Abiotic : Limiting Factors
• Too much or too little of any abiotic factor can
limit or prevent growth of a population, even if all other factors are optimum.
• Limiting factors on land: precipitation, soil nutrients
Range of Tolerance
Biotic: Producers (autotrophs)
• Make own food through chemosynthesis or photosynthesis
6CO2 + 6H2O + solar energy C6H12O6 + 6O2
Chemosynthesis
• Instead of sunlight organisms use chemical energy. • Deep ocean – H2S from hydrothermal vents used by
Consumers (heterotrophs)
• Get energy and nutrients from other organisms or their remains
Herbivores
• Primary consumers
Carnivore
• Eat meat, feed on other consumers
• Those feeding on primary consumers are called secondary consumers
Omnivore
Scavengers
Detritivores
(detritus feeders and decomposers)
• Feed on detritus – parts of dead organisms and waste of living organisms
- detritus feeders: crabs, termites, earthworms extract nutrients from partially decomposed organic matter
Aerobic Respiration
• Both producers and consumers undergo aerobic respiration reverse of photosynthesis
• Uses glucose and oxygen to produce energy,CO2, and H2O
Anaerobic Respiration/Fermentation
• Some organisms use – no oxygen present
• End products are still energy, but instead of CO2 and water, you might get CH4, ethyl alcohol,
Biomass
• Each trophic level contains a certain amount of biomass
• Dry weight of all organic matter in the organisms at that level.
• Chemical energy is stored and transferred through biomass from one trophic level to another.
• Only about 10% of energy entering a trophic level is available to the next trophic level
Ecological efficiency
• Amount of usable energy transferred as biomass from one trophic level to another • Dependent upon the species
• Ranges from 5-20%
• The more trophic levels in a food chain or web, the greater the cumulative loss of
energy
Productivity of Producers:
The Rate Is Crucial
• Gross primary production
(GPP)
Net Primary Production (NPP)
• NPP = GPP – R
– Rate at which producers use
photosynthesis to store energy minus the rate at which they use some of this
NPP – available for use as food by
consumers
• Most productive: estuaries, swamps and marshes, tropical rain forests
MATTER CYCLING IN
ECOSYSTEMS
• Nutrient Cycles: Global Recycling
– Global Cycles recycle nutrients through the earth’s air, land, water, and living organisms.
– Nutrients are the elements and compounds that organisms need to live, grow, and reproduce.
– Biogeochemical cycles move these substances through air, water, soil, rock and living
Effects of Human Activities
on Water Cycle
• We alter the water cycle by:
– Withdrawing large amounts of freshwater. – Clearing vegetation and eroding soils.
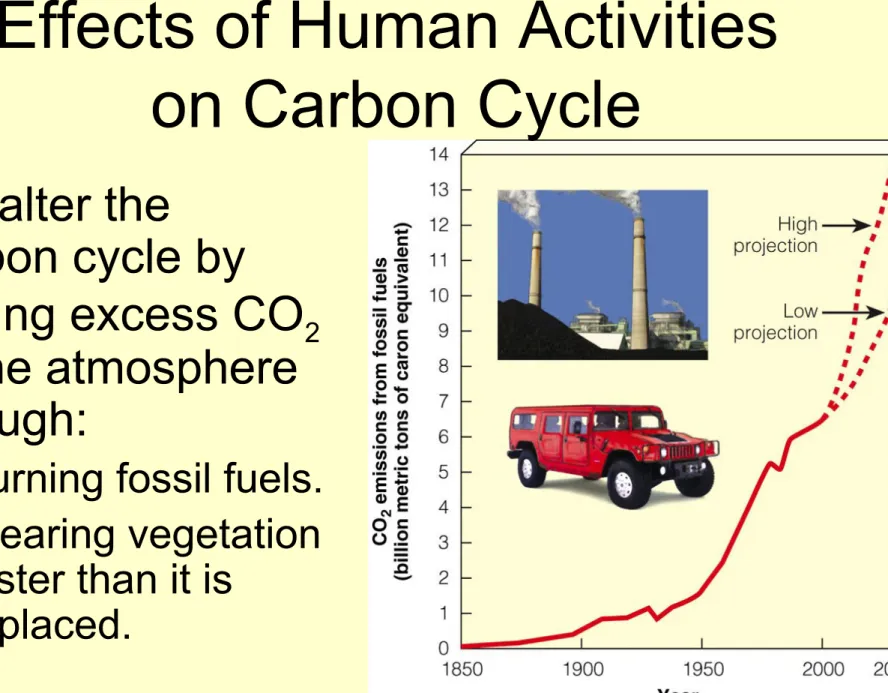
Effects of Human Activities
on Carbon Cycle
• We alter the
carbon cycle by
adding excess CO2 to the atmosphere through:
– Burning fossil fuels. – Clearing vegetation
faster than it is replaced.
Figure 3-28
Nitrogen Cycle
• N2 Composes 78% of earth’s atmosphere • Cannot be used by multicellular plants and
animals
Nitrogen Fixation
• N2 is converted to ammonia (NH3) and then to ammonium (NH4+)
• natural processes
Lightening (ammonium enters soil through precipitation)
Cyanobacteria in soil and water
Anthropogenic Nitrogen Fixation
• Industrial fixation of nitrogen in manufacturing fertilizer
Nitrification
• NH4+ is converted to nitrites (NO
2-) and
then to nitrates (NO3-) by nitrifying bacteria
• Nitrites are harmful to plants
Assimilation
• Plants absorb the ammonia and nitrates and make nitrogen containing organic molecules
Ammonification
• Organic matter is converted back into NH3 and NH4+ by decomposers
• Occurs when plant and animals die or when animals emit wastes
Dinitrification
• Specialized bacteria convert NH3 and NH4+ back into NO2- and NO
3
-• NO2- and NO
3- are then converted by
Effects of Human Activities
on the Nitrogen Cycle
• We alter the nitrogen cycle by:
– Adding gases that contribute to acid rain.
– Adding nitrous oxide to the atmosphere through farming practices which can warm the atmosphere and deplete ozone.
– Contaminating ground water from nitrate ions in inorganic fertilizers.
Phosphorus Cycle
• Phosphorus exists as PO4
3-• Found as phosphate salts in terrestrial rock formations and ocean bottom
sediments
• Only in atmosphere as small particles of dust
• Often the limiting factor for plant growth – very little in soil
• Also limits growth of producer populations in freshwater streams and lakes – only
Effects of Human Activities
on the Phosphorous Cycle
• We remove large amounts of phosphate from the earth to make fertilizer.
• We reduce phosphorous in tropical soils by clearing forests.
• We add excess phosphates to aquatic
Sulfur Cycle
• Most sulfur is stored underground in rocks and minerals
• Sulfur can enter the atmosphere as H2S and SO2 from active volcanoes, and H2S from the
breakdown of organic matter (through anaerobic decomposers).
• Sulfate salts enter the atmosphere from sea spray
Sulfur cycle continued
• SO2 reacts with O2 in the atmosphere to produce SO3
• SO3 reacts with water vapor to produce H2SO4. • Results in acid deposition
• Plants absorb sulfur when dissolved in water • Animals obtain sulfur by consuming plants
Effects of Human Activities
on the Sulfur Cycle
• We add sulfur dioxide to the atmosphere by:
– Burning coal and oil
– Refining sulfur containing petroleum.
The Gaia Hypothesis:
Is the Earth Alive?
• Some have proposed that the earth’s various forms of life control or at least influence its chemical cycles and other earth-sustaining processes.
– The strong Gaia hypothesis: life controls the earth’s life-sustaining processes.