Measurement of methylamines in seawater using solid phase microextraction
and gas chromatography
Cree Charlotte H.L.1,2, Airs Ruth2, Archer Stephen D.3, Fitzsimons Mark F.1*
1Biogeochemistry Research Centre, Marine Institute, University of Plymouth, Plymouth PL4 8AA, UK
2Plymouth Marine Laboratory, Prospect Place, The Hoe, Plymouth PL1 3DH, UK 3Bigelow Laboratory for Ocean Sciences, East Boothbay, Maine 04544, USA
* 1 2 3 4 5 6 7 8 9 10 11 12 13 14 15 16 17 18 19 20 21 22 23 24 25 26 27 28 29 30 31 32 33 34 35 36 37 38 39 40 41 42 43 44 45 46
Abstract
The methylamines form part of the marine organic nitrogen pool. Although they are ubiquitous in marine systems, little is known about their distribution, production and fate in the marine environment. Analytical methods have been developed for their analysis in marine waters, but these have employed custom-made apparatus, limiting data to a few studies. Here, we report a method developed for the determination of methylamines in seawater which combines headspace solid phase micro-extraction (SPME) and gas chromatography with selective nitrogen detection. Gaseous methylamines were pre-concentrated from water samples (approximately 1 L) heated to 60 oC, onto a polydimethylsiloxane/divinylbenzene
SPME fibre located in the headspace of the extraction flask. The analytes were then thermally desorbed from the fibre in a gas chromatograph containing a CP-Volamine column and a nitrogen-phosphorus detector. The method was routinely calibrated down to 1 nM for all three analytes using matrix-matched external standards. Limits of detection were determined operationally and ranged from 0.4-2.9 nM during two sampling campaigns. The analytes were detected in seawater samples from the English Channel and Southern Ocean where concentrations up to 20 and 5.6 nM were measured, respectively, consistent with previously reported levels. We propose this method for the analysis of methylamines, and other low molecular weight amines, as it is sensitive, robust, and the necessary equipment is widely-available.
48 49 50 51 52 53 54 55 56 57 58 59 60 61 62 63 64 65 66 67 68 69 70 71
Introduction
Nitrogen is a dynamic element in marine systems. It is primarily used as a nutrient by micro-organisms, but may also have a role in climate chemistry. Nitrogen-containing osmolytes (N-osmolytes) such as glycine betaine, trimethylamine-N-oxide and choline are produced by phytoplankton to maintain osmotic pressure (Yancey 2005 and Burg 2008); these N-osmolytes can degrade to produce methylamines (Jameson et al. 2016; King
1984; Oremland et al. 1982; Oren 1990). Recently, marine bacteria have been shown to use methylamines as a source of energy and remineralise the nitrogen to ammonium (Lidbury et al. 2015). Further, methylamines are required for a bacterial conversion of the climate relevant sulfur gas dimethyl sulfide to dimethylsulfoxide (Lidbury et al. 2016), firmly establishing them as important components in biogeochemical cycles. The methylamines (MAs) are mono-, di- and trimethylamine (MMA, DMA and TMA, respectively); they are analogues of ammonia with the formula (CH3)nNH3-n. The MAs are ubiquitous in the marine
environment, where their reported concentrations vary from micromolar to nanomolar levels in estuarine and oceanic environments, respectively (Fitzsimons et al. 2006; Gibb et al. 1999a). They comprise a small percentage of marine organic nitrogen (Burdige et al. 1995; Lee and Olsen 1984) but can diffuse across the sea-air interface where they may affect atmospheric chemistry as a source of base to the atmosphere, influencing cloud formation (Dall’Osto et al. 2017). Indeed, a recent study demonstrated that atmospheric concentrations of DMA above 65 nmol m-3 by volume could enhance particle-formation more than
1,000-fold compared with ammonia, sufficient to account for observed atmospheric particle-formation rates (Almeida et al., 2013).
Analysis of the MAs is challenging due to their polarity, aqueous solubility, volatility and low concentrations in marine environments. Derivatization of the methylamines to permit their analysis by gas and liquid chromatography has been reported, but methods involved
72 73 74 75 76 77 78 79 80 81 82 83 84 85 86 87 88 89 90 91 92 93 94 95 96
either conversion of TMA to DMA(daCosta et al. 1990) or could not resolve DMA and TMA (Herráez-Hernández et al. 2006; Parshintsev et al. 2015), rendering them unsuitable for the simultaneous analysis of all three analytes. Methods designed for the analysis of
methylamines from marine waters and sediments have exploited the MAs’ volatility to facilitate their pre-concentration and measurement (Abdul-Rashid et al. 1991; Yang et al. 1993; Gibb et al. 1995). The technique reported by Abdul-Rashid et al. (1991) involved a pre-concentration step carried out in a specially-adapted Quikfit flask (Cavett flask), with
analysis by gas chromatography and nitrogen-phosphorus detection (GC-NPD). Limits of detection achieved using this method were 2-12 nM which, while appropriate for estuarine water and sediment pore-waters (Fitzsimons et al. 2005; Fitzsimons et al. 2006), were likely to be too high for coastal and oceanic waters (Gibb et al. 1995; Gibb et al. 1999a). Gibb et al. (1995; 1999a) employed a coupled flow injection-gas diffusion-ion chromatography system, which was deployed on-board ship to collect the first extensive MA datasets reported for marine waters. However, despite scientific drivers to understand the sources, sinks and distribution of MAs in seawater, this method, and one using a similar approach by Yang et al. (1993), have not been adopted by the oceanographic community as they require custom-made, engineered apparatus.
Solid phase micro-extraction (SPME) is a simple sample preparation technique which eliminates the need for solvents or complicated apparatus for concentrating volatile or non-volatile compounds from gaseous, liquid or headspace samples (Arthur and Pawliszyn 1990). SPME has been used to measure organic compounds in water and air and is compatible with gas chromatography. It provides a linear response over a wide concentration range(Arthur et al. 1992a; Arthur et al. 1992b) and has been used to measure MAs in wastewater(Abalos et al. 1999), though with high limits of detection (186-869 nM). It has also been used for the
97 98 99 100 101 102 103 104 105 106 107 108 109 110 111 112 113 114 115 116 117 118 119 120
measurement of marine trace gases, including dimethylsulfide(Niki et al. 2004; Vogt et al. 2008; Yassaa et al. 2006).
The aim of this study was to develop a sensitive method for the analysis of MAs in coastal and oceanic waters using widely-available consumables and instrumentation. The SPME technique was tested in order to achieve experimental conditions suitable for the trace measurement of MAs in seawater (Gibb and Hatton 2004; Gibb et al. 1995; Gibb et al. 1999a; Gibb et al. 1999b). The method employed headspace SPME and GC-NPD for analyte pre-concentration and measurement, respectively, and was used to measure MAs in water samples collected from the English Channel and during a research cruise in the Southern Ocean.
121 122 123 124 125 126 127 128 129 130 131
Materials and procedures
Chemicals
Trimethylamine hydrochloride (98 %, CAS number 75-50-3), dimethylamine hydrochloride (99 %, CAS number 124-40-3), and monomethylamine hydrochloride (99 %, CAS number 74-89-5) were purchased from Acros Organics. Sodium chloride (99.5 %, CAS number 7647-14-5, analytical reagent grade), sodium hydroxide (analytical reagent grade, CAS number 1310-73-2) and hydrochloric acid (37 %, extra pure; CAS number 7647-01-0) were purchased from Fisher Scientific.
SPME Equipment
The SPME unit comprised a length of fused-silica fibre coated with a polymer, which was bonded to a stainless steel plunger and installed in a holder resembling a modified microliter syringe. The plunger moved the fibre out of a hollow needle and the unit functioned by passing the needle through the septum sealing the flask containing the water sample, then exposing the fibre to the headspace. Following extraction, the needle was introduced into the GC injector using an SPME adaptor, the fibre exposed and the analytes thermally desorbed. The amount of analyte adsorbed by the fibre depended on the thickness of the polymer coating and on the distribution constant for the analyte.
Cleaning procedure
All glassware and plasticware were rinsed with high purity water (HPW) at 18.2 MΩ cm resistivity (Millipore) then soaked in a low nutrient, 1 % detergent solution (Nutracon) for 24 h. Following rinsing with HPW, items were soaked in hydrochloric acid (10 % v/v) for 24 h then rinsed with HPW. Cleaned items were double-bagged in clean polyethylene bags and stored until use.
132 133 134 135 136 137 138 139 140 141 142 143 144 145 146 147 148 149 150 151 152 153 154 155 156
Sample collection
Surface seawater was sampled at station L4 of the Western Channel Observatory (http://www.westernchannelobservatory.org.uk/l4/), 10 km offshore in the Western English Channel, from the non-toxic supply aboard the R/V Plymouth Quest. A 10 L sample was collected from which sub-samples of 1 L were dispensed into high density polyethylene (HDPE) bottles, then immediately gravity filtered using 47 mm GF/F filters (0.7 m pore size) into 1 L HDPE bottles containing 10 mL HCl (37 %) to immediately quench biological activity and shift the MAs’ equilibrium in favour of the non-volatile, protonated form. Water samples from the Southern Ocean were collected on-board BIO Hespérides at a depth of 4 m using a rosette sampler, which was sub-sampled using 1 L HDPE bottles, filtered into HDPE bottles containing 10 mL HCl then stored at 4 °C until analysis.
SPME
A water sample (0.85 L) was transferred to the volumetric flask then amended with NaCl, which increased the volume to 0.98 L. The solution was then adjusted to pH 13 with 10 M NaOH solution (20 mL) and heated (60 oC), with stirring, for the extraction period (time
intervals between 0.5 and 12 hours were tested and a 2.5 hour extraction window chosen, described in detail below). Constant temperature was achieved by immersing the flask in a water-bath comprising an aluminium foil-wrapped Pyrex beaker on a stirrer hotplate (Figure 1). The needle assembly was then clamped in position and inserted into the headspace of the volumetric flask, through the Subaseal. Once in position, the fibre was exposed to the headspace and the exposed neck of the volumetric flask was wrapped in aluminium foil.
The analytical method was calibrated using external, matrix-matched standard solutions containing the three MAs, in accordance with manufacturer guidance (Supelco 2001). Additional seawater was collected to make up matrix-matched standards and prepared
157 158 159 160 161 162 163 164 165 166 167 168 169 170 171 172 173 174 175 176 177 178 179 180 181
by adjusting it to pH 13, followed by purging with nitrogen gas for 6 hours to remove background MAs and other volatiles. Calibration solutions were prepared by adding NaCl (30% w/v) and MAs (range 0.1-10 nM). Matrix blank extractions were carried out regularly using purged seawater. This also served to ensure there was no contamination from the NaCl and NaOH additions.
Gas chromatography
The MAs were measured using an Agilent 6890 GC fitted with a Agilent CP-Volamine column (part number: CP7447, dimensions 60 m × 0.32 mm) and a NPD. Base-deactivated SPME inlet liners and predrilled septa (Sigma Aldrich) were used in the GC injector. The injector temperature was set to 270 °C and, once injected, the fibre was exposed for 5
minutes; GC conditions are shown in Table 1. The SPME needle depth in the injector was set to 40 mm and a SPME inlet guide was used to prevent contact between the fibre and injector liner, which would degrade the former. The cleanliness of the fibre was monitored throughout the analytical day by injecting it as described above at regular intervals without prior sample extraction. Specifically, the unextracted fibre was injected at the beginning and end of the analytical day and between sample extractions. Data were recorded using Agilent
ChemStation software, Version B.03.01.
Limits of detection
Limits of detection were calculated according to Equation 1 (ICH 1996)
LoD=3.3σ/S (1)
Where σ is the standard deviation of the peak area response calculated from the lowest concentration standard solution, and S is the linear slope of the calibration curve.
182 183 184 185 186 187 188 189 190 191 192 193 194 195 196 197 198 199 200 201 202 203 204 205 206
Assessment and discussion
GC-NPD as a separation and detection method for MAs
Aqueous injections of the MAs were used to confirm chromatographic separation using the CP-Volamine column, and linearity of response to the analytes by GC-NPD. The analytes eluted in the order MMA, DMA, TMA, reflecting relative basicity of the gaseous species (Clayden et al. 2001), and increasing compound interaction with the stationary phase.
Initial tests showed that the CP-Volamine column provided adequate retention, with the three MAs eluting between 11 and 13 minutes. However, the chromatography was poor, with significant tailing causing co-elution of TMA and DMA. MMA gave particularly poor chromatography with two peaks observed. There was also evidence of multiple peaks for both DMA and TMA.
With partial resolution achieved using the CP Volamine column, the use of sodium hydroxide to address adsorption problems was investigated. Addition of NaOH to the sample matrix (water) significantly improved both the chromatography and resolution of the three MAs. A mixed standard sample was injected and three resolved peaks were evident with MMA, DMA and TMA eluting between 8-11 minutes (Figure 2). TMA gave a strong
Gaussian peak, while the DMA and MMA peaks tailed slightly without co-eluting. The MAs’ response was linear between 0.5 - 10 mmol dm-3 (R2 = 0.98 - 0.99).
Solid phase micro-extraction: Fibre selection
SPME has historically been applied to small sample volumes (< 20 mL), and initial fibre performance was assessed using a test sample of 15 mL volume containing 3.2 µM of each of the three MAs (approximately equivalent to a 0.2 µL injection of a 100 mM standard solution in splitless mode). Three SPME fibre-coatings (Sigma-Aldrich, UK) were tested:
polyacrylate, carboxen/polydimethylsiloxane (carboxen/PDMS) and
207 208 209 210 211 212 213 214 215 216 217 218 219 220 221 222 223 224 225 226 227 228 229 230 231
polydimethylsiloxane/divinylbenzene (PDMS/DVB). The polyacrylate fibre (df 85 μm, partially cross-linked phase, needle size 24 ga, product number 57304) was designed for polar semi-volatiles with a relative molecular mass (RMM) range of 80-300 Daltons. The Carboxen/PDMS fibre (df 85 μm, needle size 24 ga, StableFlex fiber, product number 57334-U) was designed for gas analysis and had a RMM range of 30-225 Daltons, and the
PDMS/DVB fibre (df 65 μm, needle size 24 ga, StableFlex, product number 57326-U) was designed for volatiles and amines and had a RMM range of 50-300 Daltons. The coating thickness was 65 µm in accordance with manufacturer guidelines advising maximum film thickness for extraction of the most volatile amines. MAs were not detected using the polyacrylate fibre, likely because the analytes were polar, highly volatile and outside the recommended molecular weight range for this fibre (80-300 Daltons). The carboxen/PDMS fibre did produce MA-peaks; however, multiple peaks were observed and chromatography was poor. Though the desorption temperature used (270°C) was below the optimal
temperature for this fibre, it was the maximum operating temperature for the CP Volamine column; this precluded the use of the carboxen/PDMS fibre. Peaks for all three MAs were observed using the PDMS/DVB fibre (65 µm) despite MMA being outside the RMM range specified. The PDMS/DVB fibre was selected for subsequent method development.
Extraction parameters
SPME is influenced by a number of variables, including pH, ionic strength and temperature (Risticevic et al. 2010). Amines have previously been pre-concentrated in aquatic samples by adjusting the water sample to pH ≥ 12 to convert the MAs to their gaseous forms (Abdul-Rashid et al. 1991; Gibb et al. 1995; Yang et al. 1993). In this study, samples were adjusted to pH 13 with NaOH solution prior to extraction. Although precipitation of magnesium hydroxide occurs above pH 12, this does not affect MA recovery (Abdul-Rashid et al. 1991;
232 233 234 235 236 237 238 239 240 241 242 243 244 245 246 247 248 249 250 251 252 253 254 255 256
Gibb et al. 1995; Yang et al. 1993). In addition to volatilization of the analytes, the high pH is known to reduce ionic interactions between basic compounds protonated on the nitrogen atom and charged functional groups, such as within dissolved organic matter, as the former are converted to gaseous form at pH 13 (Jones, 2005).
Elevated temperature increases headspace capacity and/or the analyte diffusion coefficient, leading to an increase in extraction rate and mass transfer onto the fibre coating (Risticevic et al. 2010). A temperature of 60 oC was selected for this method, based on data
reported from static diffusion studies of MAs from water samples to headspace. These techniques achieved recoveries of 83-100 % at 60 oC (Dawit 2006; Fitzsimons et al. 2005;
Fitzsimons et al. 2001; Fitzsimons et al. 2006; Yang et al. 1993).
Extraction of MAs in seawater
A number of parameters were considered to ensure that extraction conditions were
reproducible, including sample and headspace volumes. A 1 L volumetric flask, sealed with a Subaseal, served as the extraction vessel to obtain a minimal but consistent headspace volume (Zhang and Pawliszyn 1993), while ensuring that the fibre and sample did not come into contact. The phase ratio between the headspace and the sample was optimized to ensure the headspace was small enough to concentrate the gaseous MAs but large enough to
accommodate the SPME fibre, while also accounting for the thermal expansion of the
seawater matrix during extraction at this temperature. The headspace volume of the flask was approximately 0.045 dm3; it was consistent between samples and slight variations in the
water volume (which were accounted for) were permitted to achieve this. Heating was achieved using a water bath large enough to heat the flask and water sample while excluding the headspace.
257 258 259 260 261 262 263 264 265 266 267 268 269 270 271 272 273 274 275 276 277 278 279 280
Headspace SPME establishes two equilibria: between the water sample and
headspace, and between the headspace and fibre. To achieve acceptable reproducibility, both processes had to reach steady-state during the extraction; otherwise small changes in the extraction time could reduce the amount of analyte extracted (Arthur and Pawliszyn 1990). Four extraction times were tested to confirm that equilibration between the headspace and fibre could be achieved within a reasonable time period, ranging from a typical SPME extraction time of 0.5 h (Risticevic et al. 2010) to 12 h (Figure 3). Extractions were
performed in the following order: 2.5, 6, 0.5 and 12 hours. Six extractions were performed at each time interval. Duplicate fibres were used (n = 3 per fibre) so that inter-fibre variation could be assessed. The effect of extraction time on MA concentration (Figure 3) was
statistically analysed using one-way ANOVA (Table 2), while performance of separate fibres was assessed using a Student’s t-test. For MMA and DMA, significantly more analyte was extracted after 2.5 h compared with 0.5 h (P = 0.018 and 0.003, respectively), while no significant difference was observed for TMA. There was no significant difference in the amount of analyte extracted between 2.5 and 6 h for any of the MAs. An extraction time of 12 h extracted significantly more MMA and TMA compared with 2.5 (P = 0.002 and < 0.001, respectively) and 6 h (P = 0.009 and < 0.001, respectively), while no significant difference was observed for DMA (Table 2). The inter-fibre comparison for all extraction times did not reveal a significant difference between the amount of analyte extracted by replicate fibres. As SPME is not used to measure absolute recovery, reproducible measurement of analytes, and sample throughput, were used to choose the optimum extraction time. Although significantly more MMA and TMA was extracted after 12 h, compared to 2.5 h or 6 h (Table 2), this extraction time, while potentially valuable, was deemed impractical for ship-based research where rapid sample throughput is needed. No significant difference was observed between 2.5 h and 6 h, however, so the 2.5 h time interval
281 282 283 284 285 286 287 288 289 290 291 292 293 294 295 296 297 298 299 300 301 302 303 304 305
was selected as the most approprraite SPME extraction time giving acceptable precision, a key parameter for SPME (Risticevic et al 2010). The results demonstrate that the extractions were reproducible at 2.5 hours, a key requirement of SPME. Absolute recovery is not a quality indicator for SPME, but rather acceptable precision using a fixed set of conditions. The extraction time chosen was, therefore, not based solely on the amount of analyte extracted but being able to achieve acceptable calibrations, limits of detection and sample throughput. Although the data in Figure 3 show a large degree of variation, the measurements were made early in the method development process and, with time and practice, variability decreased. This is discussed in more detail in the Method Calibration section.
GC-NPD as a separation and detection method for MAs extracted by SPME
The successful separation and quantification of the MAs using GC-NPD was adapted for use with SPME. Due to the headspace nature of analysis, pH modification with sodium hydroxide was not possible.
The analytes eluted in the order MMA, DMA, TMA, reflecting the relative basicity of the gaseous species. Analyte peaks were consistently absent from the matrix blanks using both HPW and treated seawater. A chromatogram of a SPME-extracted 10 nM standard solution made up in seawater (Fig. 4) and a sample measured from station L4 (Western English Channel) shows the MAs eluting between 8 and 12 minutes. Although peaks exhibited tailing, and complete resolution was not achieved, peaks were reproducible, and consistent integration of all peaks was achieved.
During GC-NPD analysis of SPME-extracted MAs, two peaks were identified for MMA, which was unexpected (Figure 4). A possible explanation is the absence of pH modification, as MMA chromatography was improved by adjusting the pH of aqueous samples to 13 immediately before injection. As analysis with headspace SPME precludes pH
306 307 308 309 310 311 312 313 314 315 316 317 318 319 320 321 322 323 324 325 326 327 328 329
modification, this may have affected the MMA peak shape. pH modification reduces the interaction of the MAs with silanol groups and siloxane bridges in the column, and is particularly important for the low molecular weight MMA where the nitrogen lone pair has the greatest impact upon its chromatographic resolution. The double peak may also be due to a slow injection speed of the SPME fibre in combination with the low boiling point of the MMA. The short retention time of the MMA means it is unlikely to reconstitute at the head of the GC column so that the desorption time from the fibre will dictate that shape of the peak on the chromatogram. The double peak may indicate a delay in exposure of the SPME fibre from the sheathing needle once inside the GC inlet as this gives an apparent double
desorption; firstly, when the analyte instantly evaporates from the fibre whilst inside the needle and, secondly, when the plunger assembly is pushed and the fibre is exposed from the sheathing needle. However, the analyte could still be measured quantitatively as the two peaks appeared consistently within the MMA retention time window, and were quantifiable. As a result, both peak areas were included in calculations.
The response of a NPD is proportional to the carbon content of the analyte (Skoog and Leary 1992). For the MAs this increases in the order MMA < DMA < TMA, and these relative responses were confirmed by direct injection of aqueous MA standard solutions. However, SPME extractions of standard MA solutions yielded a DMA peak which was consistently larger than that for TMA, indicating that partitioning onto the fibre was more extensive for the former. As gaseous TMA is more basic than both DMA and MMA, a greater affinity for the fibre-coating by the former was expected. However, there is a structural necessity for the nitrogen atom in amines to be approximately tetrahedral (sp3) in
order to bond effectively through sorption using its lone pair; for TMA, the 3 methyl
substituents of the nitrogen atom may force an increase in the bond angles to a trigonal planar structure. This would leave the lone pair in a pure p-orbital, reducing its effectiveness for
330 331 332 333 334 335 336 337 338 339 340 341 342 343 344 345 346 347 348 349 350 351 352 353 354
basic interactions (Huheey 1983) and presenting as reduced affinity for the fibre. The interconversion of chiral, tertiary amines between the R- and S-enantiomers is further evidence of the ability of TMA to adopt a less-basic structure (Solomons and Fryhle 2000).
One SPME fibre could be used for up to 200 extractions before signs of degradation, such as greying or crumbling, became visible. Regular replacement of the SPME
consumables for injection onto the GC is recommended to optimize fibre performance and lifetime and the SPME-adapted liner and septum were replaced at least every two weeks, corresponding to approximately 50 injections. Fibre lifetime was extended by the use of headspace sampling, which avoids exposure of the fibre to a high pH solution. As the method was calibrated using matrix-matched external standards, full calibrations were performed prior to analyses of all sample sets and frequent check standards analysed to monitor fibre performance, peak areas and extraction reproducibility. Depending on capacity, up to nine samples could be extracted per day, assuming triplicate fibres were used simultaneously.
Method calibration
Calibrations were performed at 1-10 nM in order to assess the method within the expected working range, based on previously reported measurements of MAs in marine waters(Table 3), using standard solutions prepared in pre-purged seawater (Figure 5). A strong correlation to response was achieved, with R2 values of 0.968 (MMA), 0.987 (DMA) and 0.987 (TMA),
and RSDs of 6-14, 8-13 and 2-7 % for MMA, DMA and TMA, respectively (Figure 4). The calibration range was further extended whilst on-board ship during the PEGASO cruise in the Southern Ocean (0.13-13.30 nM), yielding R2 values of 0.99-1 (SI Figure 1).
Calibrations carried out in matrices prepared from HPW, coastal water collected from station L4 and oceanic water collected in the Southern Ocean gave different calibration
355 356 357 358 359 360 361 362 363 364 365 366 367 368 369 370 371 372 373 374 375 376 377 378
slopes and x-axis intercepts. This indicates that the sample matrix will have an impact on the extraction efficiency and underlines the need to carry out matrix matched calibrations.
The impact of user variability was also considered; initial experiments carried out showed high variability with relative standard deviations of 31 - 60 %. With time and practice the range decreased to 2 - 12 %. This highlights the need for consistency of approach when carrying out extractions, to optimize precision.
The extrapolation of regression lines for all of the analytes typically resulted in non-zero intercepts (Fig. 5). This is potentially a result of MA analyte being present in the samples but at lower concentrations than the NPD is capable of detecting. However, the calibration was linear in the defined working range; this highlights the importance of defining operational calibration parameters for each sampling event and for the seawater matrix used, as our data suggest that this impacts on the calibration slope and y-axis intercept. Calibration data and graphs are often missing from published research using SPME, but non-zero
intercepts have been reported by the manufacturer for a range of analytes using the external standard approach (Supelco 2001). Additionally, calibrations for derivatised amines
(Parshintsev et al. 2015) and methylhalides (Yassaa et al. 2009) pre-concentrated by SPME also yielded non-zero intercepts.
Limits of Detection
Limits of detection (LoDs) calculated during field sampling were 0.48-1.88, 1.24-2.91 and 0.38-0.89 nM for MMA, DMA and TMA, respectively. These LoDs were comparable to those previously reported (Table 3) using custom-made equipment (Gibb and Hatton 2004; Gibb et al. 1995; Gibb et al. 1999b), and the data from this study demonstrates the suitability of SPME for measurements of MAs in seawater. The range in LoDs reported demonstrates
379 380 381 382 383 384 385 386 387 388 389 390 391 392 393 394 395 396 397 398 399 400 401 402
that their calculation should be a routine operational measurement, in addition to calibration, particularly if analyte concentrations are expected to be close to the LoD.
Sample preservation
Although the MAs are predominantly cationic at seawater pH, diffusion of the gaseous species may occur; as such, elimination of headspace in sampled water is necessary. Furthermore, as low molecular weight organic nitrogen compounds are rapidly consumed by marine bacteria (Middelburg and Nieuwenhuize 2000; Wang and Lee 1995), options for sample preservation were assessed. Specifically, samples were either: 1) immediately filtered on-board ship using 47 mm GF/F filter papers (0.7 µm pore size) and extracted by SPME and analysed the same day or 2) immediately filtered on-board ship using 47 mm GF/F filter papers (0.7 µm pore size) into bottles containing 10 mL of HCl (37 %) which reduced sample pH to 1, then stored in a fridge at 4 oC for extraction by SPME the next day. Bottles were
filled to capacity and sealed tightly before storage. The acid served to stop diffusion by converting MAs to cations (MAH+), and to inhibit microbial activity.
The samples acidified post-filtration contained MA concentrations of 6, 3 and 20 nM for MMA, DMA and TMA, respectively (Table 3); in the non-acidified samples MA levels were below detection. The higher MA concentrations in samples which had been filtered and acidified indicates that the acidification step was necessary. The water samples were filtered through GF/F filters (nominal pore size of 0.7 µm), which facilitates gravity filtration on a reasonable timescale but could also allow bacteria to pass through. Acidification would kill bacteria in the filtrate, while the low sample pH converts the analytes to their non-diffusing, protonated form (RNH3+).
403 404 405 406 407 408 409 410 411 412 413 414 415 416 417 418 419 420 421 422 423 424 425 426 427
Methylamine concentrations in seawater samples
Concentrations of the MAs in the English Channel (Station L4) ranged from 3-20 nM. The MAs were also measured in water samples collected in the Southern Ocean during the PEGASO research cruise, where concentrations ranged from below detection to 6.9 nM (Table 3). The concentrations measured for both the English Channel and the Southern Ocean (South Orkney Islands) are comparable to previously reported measurements from these regions (Gibb and Hatton 2004; Gibb et al. 1995). The MA concentrations reported by Gibb and Hatton (2004) were measured in Southern Ocean samples from the Rothera Time Series and were collected at the same time of year (Jan-Feb) as those measured for this study.
Conclusions
The MAs were detected in seawater using an analytical method that combined SPME with GC-NPD. The method is applicable to other low molecular weight amines which might be present in seawater (e.g. ethylated amines). As external calibration with matrix-matched standard solutions of MAs was used, it is important to calibrate the method regularly and monitor fibre performance as well as measuring operational limits of detection. A key advantage of the method is that it is both sensitive and deploys commercially available instrumentation and consumables. Parallel extractions can be carried out if several fibres are deployed and consistent extraction conditions are maintained. The method can be deployed at sea in challenging conditions such as those often present in the Southern Ocean.
The determination of MAs at low nM level using these commercially-available equipment and consumables can potentially facilitate methylamine analysis on a wider scale than previous analytical methods, which were sensitive but involved custom-made apparatus and instrumentation. We propose this method as a widely-accessible approach for measuring amine concentrations in marine waters which is both sensitive and robust, and can be easily
428 429 430 431 432 433 434 435 436 437 438 439 440 441 442 443 444 445 446 447 448 449 450 451 452
used by oceanographers and aquatic scientists. The method will facilitate our understanding of the distribution and cycling of MAs in the marine environment.
Acknowledgements
We are grateful to Dr C Anthony Lewis for input to method development. We thank the crew of the RV Plymouth Quest for access to Station L4; Prof Rafel Simo for an invitation to join the PEGASO research cruise, and the crew and scientific team of the BIO Hespérides. This work was supported by the Natural Environment Research Council through a research studentship awarded to Dr Charlotte Cree (NE/1528542/1) and a Higher Education Innovation Fund award to Dr Mark Fitzsimons from the Marine Institute, University of Plymouth.
Electronic Supplementary Information available
453 454 455 456 457 458 459 460 461 462 463 464 465 466 467 468
Figure Legends
Figure 1. A diagram of the equipment used for extraction of MAs from seawater by SPME. The Pyrex beaker and the exposed neck of the volumetric flask were wrapped in aluminium foil to efficiently maintain the water temperature at 60 oC. The water sample was stirred
during the extraction and the SPME fibre was exposed in the headspace above the sample. Figure 2. A10 mM mixed MA standard chromatogram, analysed by GC-NPD using the CP Volamine column (aqueous injection of 1 µL; injector temperature: 270°C, detector
temperature: 300°C, oven programme: 40-160°C at 10°C min-1, 160-260°C at 15°C min-1, 5
minute hold at 260°C, samples were pH modified to 13 with NaOH solution).
Figure 3. Average peak areas and standard deviations for MAs resulting from SPME extraction times of 0.5, 2.5, 6 and 12 h. Extractions were performed in the following order: 2.5, 6, 0.5 and 12 hours and 6 extractions were performed at each time interval. Statistical analyses are shown in Table 2.
Figure 4. Chromatograms of (a) 10 nM standard extraction below a seawater sample from Western Channel Observatory station L4, with baseline offset for comparison – the baseline for both samples was approximately 20 picoamps. (b) An expanded chromatogram of the L4 sample around the retention time of MMA. The MAs were extracted using SPME (PDMS-DVB fibre exposed to the headspace of the sample heated to 60°C for 2.5 hours) and
analysed by GC-NPD. MMA regularly eluted as two peaks and as data were consistent both peaks were attributed to this analyte and quantified when they occurred.
Figure 5. Calibration graphs comprising mean MA peak areas and standard deviations at the working range used for sample analysis (n = 3 at each concentration). Seawater used to prepare calibration solutions was collected from the sampling site and treated as detailed in the text.
469 470 471 472 473 474 475 476 477 478 479 480 481 482 483 484 485 486 487 488 489 490 491 492 493 494
References
Abalos, M., J. M. Bayona, and F. Ventura. 1999. Development of a solid-phase
microextraction GC-NPD procedure for the determination of free volatile amines in wastewater and sewage-polluted waters. Analytical Chemistry 71: 3531-3537.
Abdul-Rashid, M. K., J. P. Riley, M. F. Fitzsimons, and G. A. Wolff. 1991. Determination of Volatile Amines in Sediment and Water Samples. Analytica Chimica Acta 252: 223-226.
Almeida, J. and others 2013. Molecular understanding of sulphuric acid-amine particle nucleation in the atmosphere. Nature 502: 359-363.
Arthur, C. L., L. M. Killam, S. Motlagh, M. Lim, D. W. Potter, and J. Pawliszyn. 1992a. Analysis of substituted benzene compounds in groundwater using solid-phase microextraction. Environmental Science & Technology 26: 979-983.
Arthur, C. L., and J. Pawliszyn. 1990. Solid phase microextraction with thermal desorption using fused silica optical fibers. Analytical Chemistry 62: 2145-2148.
Arthur, C. L., K. Pratt, S. Motlagh, J. Pawliszyn, and R. P. Belardi. 1992b. Environmental-analysis of organic compounds in water using solid-phase micro extraction. HRC-Journal of High Resolution Chromatography 15: 741-744.
Burdige, D. J., C. M. Huang, N. Krishna, and F. E. Scully. 1995. Aliphatic amines in Chesapeake Bay sediments. Marine Chemistry 51: 45-54.
Clayden, J., N. Greeves, S. Warren, and P. Wothers. 2001. Organic Chemistry. Oxford University Press.
daCosta, K.-A., J. J. Vrbanac, and S. H. Zeisel. 1990. The measurement of dimethylamine, trimethylamine, and trimethylamine N-oxide using capillary gas chromatography-mass spectrometry. Analytical Biochemistry 187: 234-239.
Dall’Osto, M. et al. 2017. Antarctic sea ice region as a source of biogenic organic nitrogen in aerosols. Scientific Reports 7: 6047.
Dawit, M. D. 2006. The biogeochemical cycling of ammonium and methylamines in intertidal sediments. PhD. Middlesex.
Fitzsimons, M. F., B. Kahni-Danon, and M. Dawitt. 2001. Distributions and adsorption of the methylamines in the inter-tidal sediments of an East Anglian Estuary. Environmental and Experimental Botany 46: 225-236.
Fitzsimons, M. F., M. Dawit, D. M. Revitt, and C. Rocha. 2005. Effects of early tidal inundation on the cycling of methylamines in inter-tidal sediments. Marine Ecology-Progress Series 294: 51-61.
Fitzsimons, M. F., G. E. Millward, D. M. Revitt, and M. D. Dawit. 2006. Desorption kinetics of ammonium and methylamines from estuarine sediments: Consequences for the cycling of nitrogen. Marine Chemistry 101: 12-26.
Gibb, S. W., and A. D. Hatton. 2004. The occurrence and distribution of trimethylamine-N-oxide in Antarctic coastal waters. Marine Chemistry 91: 65-75.
Gibb, S. W., R. F. C. Mantoura, and P. S. Liss. 1995. Analysis of ammonia and methylamines in natural waters by flow injection gas diffusion coupled to ion chromatography. Analytica Chimica Acta 316: 291-304.
Gibb, S. W., R. F. C. Mantoura, P. S. Liss, and R. G. Barlow. 1999a. Distributions and biogeochemistries of methylamines and ammonium in the Arabian Sea. Deep-Sea Research Part Ii-Topical Studies in Oceanography 46: 593-615.
---. 1999b. Ocean-atmosphere exchange and atmospheric speciation of ammonia and methylamines in the region of the NW Arabian Sea. Global Biogeochemical Cycles
13: 161-177.
495 496 497 498 499 500 501 502 503 504 505 506 507 508 509 510 511 512 513 514 515 516 517 518 519 520 521 522 523 524 525 526 527 528 529 530 531 532 533 534 535 536 537 538 539 540 541 542
Gorecki, T., X. Yu, and J. Pawliszyn. 1999. Theory of analyte extraction by selected porous polymer SPME fibres. Analyst 124: 643-649.
Herráez-Hernández, R., C. Cháfer-Pericás, J. Verdú-Andrés, and P. Campíns-Falcó. 2006. An evaluation of solid phase microextraction for aliphatic amines using derivatization with 9-fluorenylmethyl chloroformate and liquid chromatography. Journal of Chromatography A 1104: 40-46.
Huheey, J. 1983. Inorganic Chemistry: Principles of Strucutre and Reactivity, 3rd ed. Harper International SI Edition.
ICH. 1996. Guidance for Industry; Q2B Validation of Analytical Procedures: Methodology. , p. 13. In International Conference on Harmonisation of Technical Requirements for Registration of Pharmaceuticals for Human Use: [ed.] ICH.
Jameson, E., A. C. Doxey, R. Airs, K. J. Purdy, J. C. Murrell, and Y. Chen. 2016.
Metagenomic data-mining reveals contrasting microbial populations responsible for trimethylamine formation in human gut and marine ecosystems. Microbial Genomics
2: doi: 10.1099/mgen.0.000080.
Jones, M. 2005. Organic Chemistry, 3rd ed. W. W. Norton & Company.
King, G. M. 1984. Metabolism of trimethylamine, choline and glycine betaine by sulfate-reducing and methanogenic bacteria in marine sediments. Applied and Environmental Microbiology 48: 719-725.
Lee, C., and B. L. Olsen. 1984. Dissolved, exchangeable and bound aliphatic amines in marine sediments: initial results Organic Geochemistry 6: 259-263.
Lidbury, I., J. C. Murrell, and Y. Chen. 2015. Trimethylamine and trimethylamine N-oxide are supplementary energy sources for a marine heterotrophic bacterium: implications for marine carbon and nitrogen cycling. Isme Journal 9: 760-769.
Lidbury, I. and others 2016. A mechanism for bacterial transformation
of dimethylsulfide to dimethylsulfoxide: a missing link in the marine organic sulfur cycle. Environmental Microbiology 18: 2754-2766.
Middelburg, J. J., and J. Nieuwenhuize. 2000. Nitrogen uptake by heterotrophic bacteria and phytoplankton in the nitrate-rich Thames estuary. Marine Ecology-Progress Series
203: 13-21.
Niki, T., T. Fujinaga, M. F. Watanabe, and J. Kinoshita. 2004. Simple determination of dimethylsulfide (DMS) and dimethylsulfoniopropionate (DMSP) using solid-phase microextraction and gas chromatography-mass spectrometry. Journal of
Oceanography 60: 913-917.
Oremland, R. S., L. M. Marsh, and S. Polcin. 1982. Methane production and simultaneous sulfate reduction in anoxic, salt marsh sediments. Nature 296: 143-145.
Oren, A. 1990. Formation and breakdown of glycine betaine and trimethylamine in hypersaline environments. Antonie Van Leeuwenhoek 58: 291-298.
Parshintsev, J., T. Rönkkö, A. Helin, K. Hartonen, and M.-L. Riekkola. 2015. Determination of atmospheric amines by on-fiber derivatization solid-phase microextraction with 2,3,4,5,6-pentafluorobenzyl chloroformate and 9-fluorenylmethoxycarbonyl chloride. Journal of Chromatography A 1376: 46-52.
Risticevic, S., H. Lord, T. Gorecki, C. L. Arthur, and J. Pawliszyn. 2010. Protocol for solid-phase microextraction method development. Nature Protocols 5: 122-139.
Skoog, D. A., and J. J. Leary. 1992. Principles of Instrumental Analysis, 4 ed. Saunders College Publishing.
Solomons, G., and C. Fryhle. 2000. Organic Chemistry, Seventh ed. John Wiley and Sons, Inc.
Supelco. 1998. Solid phase microextraction: theory and optimization of conditions. Sigma-Aldrich. 543 544 545 546 547 548 549 550 551 552 553 554 555 556 557 558 559 560 561 562 563 564 565 566 567 568 569 570 571 572 573 574 575 576 577 578 579 580 581 582 583 584 585 586 587 588 589 590 591 592
---. 2001. A practical guide to quantitation with solid phase microextraction, p. 8.
Vaes, W. H. J., P. Mayer, A. G. Oomen, J. L. M. Hermens, and J. Tolls. 1999. Comments on “Adsorption versus Absorption of Polychlorinated Biphenyls onto Solid-Phase Microextraction Coatings”. Analytical Chemistry 72: 639-641.
Vogt, M., S. Turner, N. Yassaa, M. Steinke, J. Williams, and P. Liss. 2008. Laboratory inter-comparison of dissolved dimethyl sulphide (DMS) measurements using purge-and-trap and solid-phase microextraction techniques during a mesocosm experiment. Marine Chemistry 108: 32-39.
Wang, X. C., and C. Lee. 1995. Decomposition of aliphatic amines and amino acids in anoxic salt marsh sediment. Geochimica Et Cosmochimica Acta 59: 1787-1797.
Yang, X. H., C. Lee, and M. I. Scranton. 1993. Determination of nanomolar concentrations of individual dissolved low molecular weight amines and organic acids in seawater. Analytical Chemistry 65: 572-576.
Yang, Y., S. B. Hawthorne, D. J. Miller, Y. Liu, and M. L. Lee. 1998. Adsorption versus Absorption of Polychlorinated Biphenyls onto Solid-Phase Microextraction Coatings. Analytical Chemistry 70: 1866-1869.
Yassaa, N., A. Colomb, K. Lochte, I. Peeken, and J. Williams. 2006. Development and application of a headspace solid-phase microextraction and gas chromatography/mass spectrometry method for the determination of dimethylsulfide emitted by eight marine phytoplankton species. Limnology and Oceanography-Methods 4: 374-381.
Yassaa, N., A. Wishkerman, F. Keppler, and J. Williams. 2009. Fast determination of methyl chloride and methyl bromide emissions from dried plant matter and soil samples using HS-SPME and GC-MS: method and first results. Environmental Chemistry 6: 311-318.
Zhang, Z. Y., and J. Pawliszyn. 1993. Headspace solid-phase microextraction. Analytical Chemistry 65: 1843-1852.
593 594 595 596 597 598 599 600 601 602 603 604 605 606 607 608 609 610 611 612 613 614 615 616 617 618 619 620
Table 1. Gas chromatographic conditions used for analysis of methylamines by SPME.
Injection mode Splitless
Carrier gas Nitrogen (655 millibar)
Make up gas Nitrogen (5 mL min-1)
Detector gases Hydrogen (2 mL min-1), air (60 mL min-1)
Injector temperature 270 oC
Fibre desorption time 5 minutes
Oven temperature 1 50 oC
Hold time 1 2 minutes
Rate 1 10 oC min-1
Oven temperature 2 180 oC
Hold time 2 0 minutes
Rate 2 15 oC min-1
Oven temperature 3 260 oC
Hold time 3 5 minutes
Detector temperature 300 oC 621
622
623 624 625
Table 2. Statistical comparison, by one-way ANOVA, showing the significance of SPME extraction time for concentration of each MA extracted (n = 6) at the 95 % confidence level. Significant differences are indicated with an asterisk. Mean peak areas and standard
deviations are displayed in Figure 2.
Amine
P value for extraction time comparisons
0.5 v 2.5 h 2.5 v 6 h 2.5 v 12 h 6 v 12 h
MMA 0.018* 0.426 0.002* 0.009*
DMA 0.003* 0.525 0.129 0.052
TMA 0.103 0.852 < 0.001* < 0.001*
626 627 628 629 630
631 632
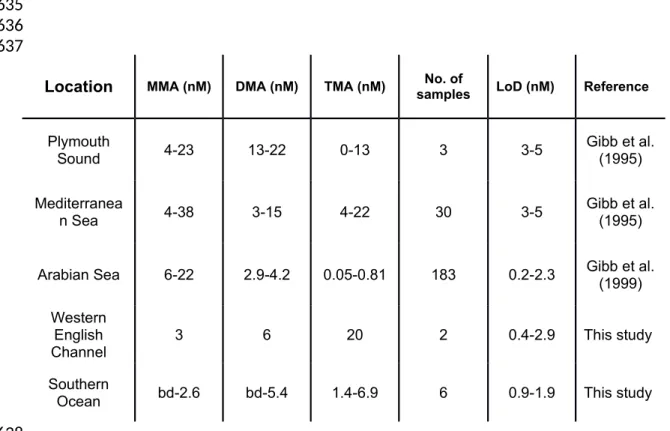
Table 3. Summary of MA concentrations and analytical figures of merit reported for marine waters.
Location MMA (nM) DMA (nM) TMA (nM) samplesNo. of LoD (nM) Reference
Plymouth
Sound 4-23 13-22 0-13 3 3-5 Gibb et al.(1995) Mediterranea
n Sea 4-38 3-15 4-22 30 3-5 Gibb et al.(1995) Arabian Sea 6-22 2.9-4.2 0.05-0.81 183 0.2-2.3 Gibb et al.(1999)
Western English
Channel 3 6 20 2 0.4-2.9 This study
Southern
Ocean bd-2.6 bd-5.4 1.4-6.9 6 0.9-1.9 This study 633
634 635 636 637