Research Article
July
2017
Computer Science and Software Engineering
ISSN: 2277-128X (Volume-7, Issue-7)
Retinal Fundus Detection Using Skew Symmetric Matrix
Kiranjit Kaur1, Priyadarshni2M.Tech. Student, ECE Department, L.C.E.T, Katani Kalan, Punjab, India1 Associate Professor, ECE Department, L.C.E.T, Katani Kalan, Punjab, India2
DOI:10.23956/ijarcsse/V7I7/0105
Abstract— The retina is the light sensitive tissue, lining the back of our eye. Light rays are focused onto the retina through our cornea, pupil and lens. The retina converts the light rays into impulses that travel through optic nerve to our brain, where they are interpreted as the images. The task of manually segmenting fundus from retina images is generally time-consuming and difficult. In most settings, the task is done by marking the fundus regions slice-by-slice, which limits the human rater’s view and generates distorted images. Manual segmentation is also typically done largely based on a single image with intensity enhancement provided by an injected contrast agent. In the current research the fundus is detected and extracted in retinal image. Fundus is distinguished from normal tissues by their image intensity, threshold-based or region growing techniques. The fundus in this approach is detected with the help of geometric features. Skew symmetric matrix is used to avoid any angular orientation. In this approach the accuracy on fundus is quite promising. Accuracy of fundus detection is improved according to the area and the acceptance rate .In this approach ,once the image is loaded, it is filtered and normalized. Then superpixels are generated using linear iterative clustering approach and the features are generated. From the available set of features, some of the features are selected using sequential forward selection approach .Classifier is constructed in order to determine different classes in a test image. Proposed work is two class problem in which algorithm is applied that consists of skew symmetric matrix .Experimental results show substantial improvements in the accuracy and the performance of fundus detection as well as in false acceptance rate and false rejection rate.
Keywords— feature selection, retinal image analysis, retinal artifacts extraction, skew symmetric matrix
I. INTRODUCTION
Early detection and treatment of retinal eye diseases is critical to avoid preventable vision loss. Conventionally, retinal disease identification techniques are based on manual observations. Optometrists and ophthalmologists often rely on image operations such as change of contrast and zooming to interpret these images and diagnose results based on their own experience and domain knowledge.
The 2-D retinal scans obtained from imaging instruments [e.g., fundus camera, scanning laser ophthalmoscope (SLO)] may contain structures other than the retinal area .Extraction of such structures is important as a preprocessing step before automated detection of features of retinal diseases.
Fig. 1. Example of (a) a fundus image and (b) an SLO image annotated with true retinal area and ONH.
The purpose of performing this study is to develop a method that can exclude artefacts from retinal scans so as to improve automatic detection of disease features from the retinal scans.
ISSN(E): 2277-128X, ISSN(P): 2277-6451, DOI: 10.23956/ijarcsse/V7I7/0105, pp. 103-110
1) determination of features that can be used to distinguish between the retinal area and the artefacts; 2) selection of features which are most relevant to the classification;
3) Construction of the classifier which can classify out the retinal area from SLO images.
For differentiating between the retinal area and the artefacts, we have determined different image-based features which reflect grayscale, textural, and structural information at multiple resolutions. Then, we have selected the features among the large feature set, which are relevant to the classification. The feature selection process improves the classifier performance in terms of computational time.
II. LITERATURE SURVEY
There are several image based features which have been represented different retinal structures in fundus image such as colour, illumination, intensity, skewness, texture, sharpness etc. For reducing computational complexity grid analysis containing small patches of the image has been proposed and the mean response of each features aggregated over each patch was taken into account .The features of region of interest of anatomical structures such as optic nerve head and fovea have also been analysed. The strategies for detection and segmentation of eyelids and eyelashes applied on images of the front of the eye, which contains the pupil, eyelids, and eyelashes. On such an image, the eyelashes are usually in the form of lines or bunch of lines grouped together. Therefore, the first step of detecting them was the application of edge detection techniques such as Sobel, Prewitt, Canny, Hough Transform [11], and Wavelet transform [12]. The eyelashes on the iris were then removed by applying nonlinear filtering on the suspected eyelash areas [13]. Since eyelashes can be in either separable form or in the form of multiple eyelashes grouped together, Gaussian filter and Variance filter were applied in order to distinguish among both forms of eyelashes [14]. The experiment showed that separable forms of eyelashes were most likely detected by applying Gaussian filter, whereas Variance filters are more preferable for multiple eyelash segmentation [15]. In an image obtained from SLO, the eyelashes show as either dark or bright region compared to retinal area depending upon how laser beam is focused as it passes the eyelashes. The eyelids show as reflectance region with greater reflectance response compared to retinal area. Therefore, we need to find out features, which can differentiate among true retinal area and the artefacts in SLO retinal scans. The features reflecting the textural and structural difference could have been the suggested choice. These features have been calculated for different regions in fundus images, mostly for quality analysis.
Our methodology is based on analyzing the SLO image-based features, which are calculated for a small region in the retinal image called super pixels. The determination of feature vector for each super pixel is computationally efficient as compared to feature vector determination for each pixel. The super pixels from the images in the training set are assigned the class of either retinal area or artefacts depending upon the majority of pixels in the super pixel belonging to the particular class. The classification is performed after ranking and selection of features in terms of effectiveness in classification. The details of the methods are discussed in the following section.
III. METHODOLOGY
Our methodology is based on the following steps: -- Image Preprocessing
-- Generation of Super pixels --Feature Generation and selection -- Classification
--implementation of technique on tilted image using skew symmetric matrix
1) Image preprocessing: image preprocessing denotes a processing step transforming a source image into a new which is fundamentally similar to the source image but differs in certain aspects e.g. improved contrast, intensity. Images are preprocessed in order to bring the intensity values of each image into a particular range. Images were normalized by applying a Gamma (ɤ) adjustment to bring the mean image intensity to a target value. ɤ was calculated using ɤ =log10(µtarget) − log10(255) / log10(µorig ) − log10(255)
where µorig is the mean intensity of the original image and µtarget is the mean intensity of the target image. Finally, the Gamma adjustment of the image is given as
Inorm =( I / 255)ɤ
2) Generation of Superpixels: The training images after Preprocessing are represented by small regions called superpixels. The generation of the feature vector for each super pixel makes the process computationally efficient as compared to feature vector generation for each pixel. The super pixel generation method used in our retina detector framework is simple linear iterative clustering [18], which was shown to be efficient not only in terms of computational time, but also in terms of region compactness and adherence.
ISSN(E): 2277-128X, ISSN(P): 2277-6451, DOI: 10.23956/ijarcsse/V7I7/0105, pp. 103-110
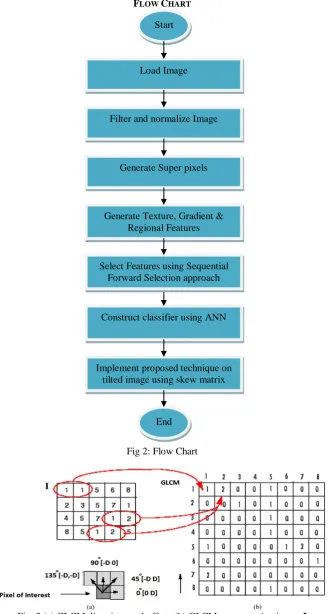
FLOW CHART
Fig 2: Flow Chart
Fig. 3 (a) GLCM directions and offset. (b) GLCM process using image I
The reason for including gradient feature was illumination no uniformity of the artefacts. In order to calculate these features, the response from Gaussian filter bank is calculated. The Gaussian filter bank includes Gaussian, its two first-order derivatives and three second-order derivatives in horizontal (x) and vertical (y) directions. After convolving the image with the filter bank at a particular channel, the mean value is taken over of each filter response over all pixels of each superpixel.
The features used to define regional attributes were included because superpixels belonging artefacts have irregular shape compared to those belonging the retinal area in an SLO image. The image features are calculated for each superpixel of the images present in the training set and they form a matrix.
Start
Load Image
Filter and normalize Image
Generate Super pixels
Generate Texture, Gradient & Regional Features
Select Features using Sequential Forward Selection approach
Construct classifier using ANN
Implement proposed technique on tilted image using skew matrix
ISSN(E): 2277-128X, ISSN(P): 2277-6451, DOI: 10.23956/ijarcsse/V7I7/0105, pp. 103-110
Feature selection is used to reduce execution time, determine features which are most relavant to the classification For feature selection, we have selected sequential forward selection (SFS) approach.
In the “SFS approach,” the interaction among features is taken into account. From the available set of features, the feature with the highest area under the curve (AUC) is selected. The next feature is chosen in such a way that when it is used along with the first selected feature, it will give the highest AUC compared to other non-selected features. The process is repeated until ten features were selected, since a higher number of features resulted in a very small improvement in AUC.
4) Classifier Construction: In conjunction with manual annotations, the selected features are then used to construct the binary classifier. The result of such a classifier is the superpixel representing either the “true retinal area” or the “artefacts.” The classifier is constructed in order to determine the different classes in a test image. In our case, it is a two class problem: true retinal area and artefacts. We have applied Artificial Neural Networks (ANNs). The ANN is the classification algorithm that is inspired by human and animal brain. It is composed of many interconnected units called artificial neurons. ANN takes training samples as input and determines the model that best fits to the training samples using nonlinear regression. Consider three basic blocks of ANN, i.e., input, hidden layer (used for recoding or providing representation for input), and output layer. More than one hidden layer can be used. The output of each layer is in the form of matrix of floating values.
Fig:4 AANs diagram
5) Implementation of technique on tilted image using skew symmetric matrix: Skew symmetric matrix is used to avoid any angular orientation. Skew symmetric matrix is a square matrix whose transpose is its negation; that is, it satisfies the condition –A=AT
Tilt in a image can be obtained from the eigen values of the second derivative matrix. The tilt of the plane is given by : Tan2τ=2Gxy/Gxx-Gyy
Where τ is the tilt and Gxy, Gxx and Gyy are second derivatives.
IV. RESULTS AND DISCUSSION
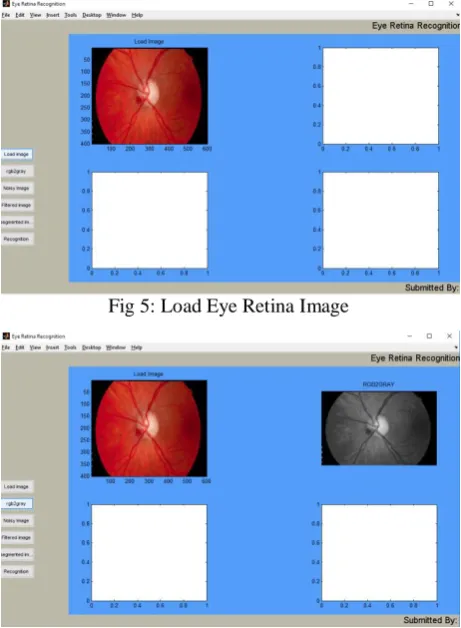
Step 1: Loading of MR Image:-In this step the eye retina fundus image is uploaded.
Step 2: In this phase eye retina scan is loaded and then this will be converted into the gray scale image.
Fig 5: Load Eye Retina Image
ISSN(E): 2277-128X, ISSN(P): 2277-6451, DOI: 10.23956/ijarcsse/V7I7/0105, pp. 103-110
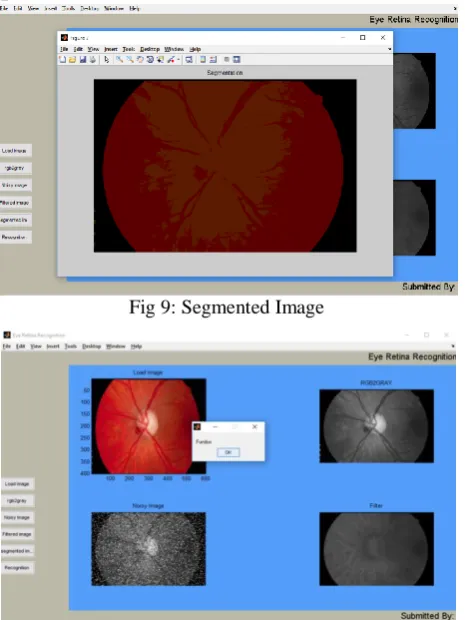
Step 3: This step defined about the introduction of noisy image. This image may confirm that the proposed technique is robust enough that it may be applied to the noisy images also.
Step 4: In this step the image is filtered and features may be extracted from it and all kinds of artifacts are removed as shown in the 4th segment.
Fig 7: Conversion of RGB2GRAYImage Screen
Fig 8: ROI Image
Step 5: This step presented the segmented image after the noise removal. Step 6: This step identified the fundus in the image of eye retina.
Fig 9: Segmented Image
ISSN(E): 2277-128X, ISSN(P): 2277-6451, DOI: 10.23956/ijarcsse/V7I7/0105, pp. 103-110
Related parameters:
1) Accuracy: Accuracy is how close a measurement is to the correct value for that measurement.
Accuracy = 𝑛𝑢𝑚𝑏𝑒𝑟 𝑜𝑓 𝑡𝑟𝑢𝑒 𝑝𝑜𝑠𝑖𝑡𝑖𝑣𝑒𝑠 +𝑛𝑢𝑚𝑏𝑒𝑟 𝑜𝑓 𝑡𝑟𝑢𝑒 𝑛𝑒𝑔𝑎𝑡𝑖𝑣𝑒𝑠
𝑛𝑢𝑚𝑏𝑒𝑟 𝑜𝑓 𝑡𝑟𝑢𝑒 𝑝𝑜𝑠𝑖𝑡𝑖𝑣𝑒𝑠 +𝑡𝑟𝑢𝑒 𝑛𝑒𝑔𝑎𝑡𝑖𝑣𝑒𝑠 +𝑓𝑎𝑙𝑠𝑒 𝑛𝑒𝑔𝑎𝑡𝑖𝑣𝑒𝑠 +𝑓𝑎𝑙𝑠𝑒 𝑝𝑜𝑠𝑖𝑡𝑖𝑣𝑒𝑠
Fig 11: Accuracy for existing and proposed system
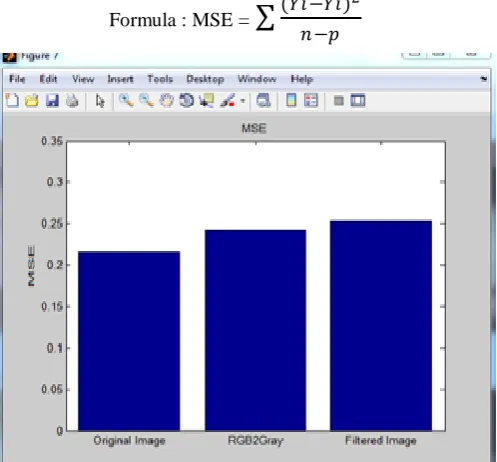
2) Mean Square Error
Mean Squared Error (MSE) or Mean Squared Deviation (MSD) of an estimator measures the average of the squares of the errors or deviations, that is, the difference between the estimator and what is estimated. MSE is a risk function, corresponding to the expected value of the squared error loss or quadratic loss. The difference occurs because of randomness or because the estimator doesn't account for information that could produce a more accurate estimate. The MSE is the second moment (about the origin) of the error, and thus incorporates both the variance of the estimator and its bias. For an unbiased estimator, the MSE is the variance of the estimator.
Formula : MSE = (𝑌𝑖−𝑌𝑖) 2
𝑛−𝑝
Fig 12: Mean Square Error for existing and proposed system
Fig 12 is representation of Mean Square Error. It is the ratio of noise in an image. From the image it is clear that the MSE is increased in the image as the noise is increased and the MSE in original image is least.
3) Peak Signal to Noise Ratio
ISSN(E): 2277-128X, ISSN(P): 2277-6451, DOI: 10.23956/ijarcsse/V7I7/0105, pp. 103-110
Formula: PSNR = 10×lg 2552
𝑀𝑆𝐸
Fig 13: Peak Signal to Noise Ratio for existing and proposed technique
Fig 13 is peak signal to noise ratio in original image, gray scale image and of Filtered image. From the figure it is clear that the PSNR is least in the filtered image as the noise is less in case of filtered image as compare to other cases.
V. CONCLUSION
This paper presents techniques for distinguishing fundus from true retinal area in SLO images. In this work, we have proposed a novel framework for automatic detection of true retinal area in SLO images. We have used super pixels to represent different irregular regions in a compact way. Feature selection enables the most significant features to be selected and, thus, reduces computing cost too. A classifier has been built based on selected features to extract out the retina area. Experimental results show substantial improvements in the accuracy and the performance of fundus detection.
REFERENCES
[1] Choon-Ching Ng, Moi Hoon Yap, Nicholas Costen, Baihua Li, "Wrinkle Detection Using Hessian Line Tracking", IEEE Access, ISSN: 2169-3536, Vol: 3, July 2015, pp: 1079-1088
[2] Ranjan Jana, Debaleena Datta, Rituparna Saha, "Age Estimation from Face Image using Wrinkle Features", International Conference on Information and Communication Technologies, Vol: 46, 2015, pp: 1754-1761 [3] Awale, Archana Chaugule, "Facial Wrinkles Detection Techniques and its Application", International Journal of
Computer Applications, ISSN: 0975-8887, Vol: 134, No: 7, January 2016
[4] G. O. Cula, P. R. Bargo, A. Nkengne, N. Kollias, "Assessing facial wrinkles: automatic detection and quantification", Skin Research and Technology, Vol: 19, 2013, pp: 243-251
[5] Sukhwinder Kaur, Hari Singh, "Human Eye Blink Detection using YCbCr Color Model, Haar-Like Features and Template Matching", ISSN (Print) : 2320 – 3765, ISSN (Online): 2278 – 8875, Vol. 4, Issue 2, February 2015, pp: 825-832
[6] Rupali S. Parte, Gaus Mundkar, Nanasaheb Karande, Shalu Nain, Nalinee Bhosale, "A Survey on Eye Tracking and Detection", International Journal of Innovative Research in Science, Engineering and Technology, ISSN(Online) :2319-8753, ISSN (Print) : 2347-6710, Vol. 4, Issue 10, October 2015, pp: 9863-9867
[7] Manpreet Kaur, Mandeep Kaur, "A Hybrid Approach for Automatic Exudates Detection in Eye Fundus Image", International Journal of Advanced Research in Computer Science and Software Engineering, ISSN: 2277 128X, Vol: 5, Issue 6, June 2015, pp: 411-417
[8] Syed Akhter Hussain, Holambe A. N, "Automated Detection and Classification of Glaucoma from Eye Fundus Images: A Survey", ISSN: 0975-9646, Vol: 6, Issue: 2, 2015, pp: 1217-1224
[9] Apeksha R. Padaria, Bhailal Limbasiya, "A Review Paper on Detection of Optic Disc Damage using Retinal Images", International Journal of Computer Applications, ISSN: 0975 – 8887, Vol: 111, No: 13, February 2015 [10] Optos. (2014). [Online]. Available: www.optos.com
[11] R. C. Gonzalez and R. E. Woods, Eds., Digital Image Processing, 3rd ed.Englewood Cliffs, NJ, USA: Prentice-Hall, 2006.
[12] M. J. Aligholizadeh, S. Javadi, R. S. Nadooshan, and K. Kangarloo, “Eyelid and eyelash segmentation based on wavelet transform for iris recognition,” in Proc. 4th Int. Congr. Image Signal Process. 2011, pp. 1231–1235. [13] D. Zhang, D. Monro, and S. Rakshit, “Eyelash removal method for human iris recognition,” in Proc. IEEE Int.
Conf. Image Process., 2006, pp. 285–288.
ISSN(E): 2277-128X, ISSN(P): 2277-6451, DOI: 10.23956/ijarcsse/V7I7/0105, pp. 103-110
[15] Y.-H. Li,M. Savvides, and T. Chen, “Investigating useful and distinguishing features around the eyelash region,” in Proc. 37th IEEE WorkshopAppl. Imag. Pattern Recog., 2008, pp. 1–6.
[16] B. J. Kang and K. R. Park, “A robust eyelash detection based on iris focus assessment,” Pattern Recog. Lett., vol. 28, pp. 1630–1639, 2007
[17] T. H. Min and R. H. Park, “Eyelid and eyelash detection method in the normalized iris image uses the parabolic Hough model and Otsus thresholding method,” Pattern Recog. Lett., vol. 30, pp. 1138–1143, 2009.
[18] R. Achanta, A. Shaji, K. Smith, A. Lucchi, P. Fua, and S. S¨usstrunk, “Slic superpixels compared to state-of-the-art superpixel methods,” IEEE Trans. Pattern Anal. Mach. Intell., vol. 34, no. 11, pp. 2274–2282, Nov. 2012.