DEFINING THE CONSTRAINTS ON MICROBIAL EVOLUTION VIA HORIZONTAL GENE TRANSFER: UNCOVERING THE ROLES OF PROTEIN
COMPLEXITY, FUNCTION AND DIVERGENCE.
Artur Romanchuk
A dissertation submitted to the faculty of the University of North Carolina at Chapel Hill in partial fulfillment of the requirements for the degree of Doctor of Philosophy in the Department
of Biology.
Chapel Hill 2014
ABSTRACT
Artur Romanchuk: Defining the Constraints on Microbial Evolution via Horizontal Gene Transfer: Uncovering the Roles of Protein Complexity, Function and Divergence
(Under the direction of Corbin D. Jones and Christina L. Burch)
Although much of the observed prokaryotic diversity on Earth is the product of incremental accumulation of beneficial mutations with small phenotypic effects, horizontal transfer of whole genes (HGT) has shaped adaptive prokaryotic evolution as well. Understanding the evolutionary and cellular mechanisms governing horizontal gene transfer (HGT) is critical for predicting how bacterial genomes and phenotypes evolve. Experiments were used to investigate the covariance between changes in Escherichia coli (E.coli) fitness caused by
of those interactions and the biological function of the gene also had a significant role. In a subsequent experiment, the role of sequence divergence was included into the analysis via individual fitness measurements for 178 E.coli cell linages each over expressing genetic
ACKNOWLEDGEMENTS
Thanks to my adviser Corbin for keeping me on my toes and not letting me forget the bigger picture.
Thank you to my adviser Christina Burch for helping me maintain rigor and clarity in experimental design and writing
Thanks to my labmates, department colleagues, & associates and cats.
Thanks to my collaborator David Baltrus for making this work possible and keeping me sane and hopeful.
TABLE OF CONTENTS
LIST OF TABLES . . . viii
LIST OF FIGURES . . . .ix
LIST OF ABBREVIATIONS AND SYMBOLS . . . xi
I. CHAPTER ONE: INTRODUCTION . . . .1
REFERENCES . . . .6
II. CHAPTER TWO: COST OF GENE OVER EXPRESSION IN ESCHERICHIA COLI DEPENDS ON GENE FUNCTION MORE THAN NETWORK CONNECTIVITY. . . . .9
Abstract. . . 9
Introduction . . . . . . 10
Material and Methods . . . .13
Results. . . 17
Discussion . . . .25
REFERENCES . . . .31
III. CHAPTER THREE: VIBRIO CHOLERAE AND STAPHYLOCOCCUS AUREUS HOMOLOG DIVERGENCE BUT NOT PROTEIN CONNECTIVITY PREDICT FITNESS COST OF EXOGENOUS GENE EXPRESSION IN ESCHERICHIA COLI. . . . .42
Abstract . . . 42
Introduction . . . .43
Material and Methods . . . .45
Results . . . .49
REFERENCES. . . . . . .56
IV. CHAPTER FOUR: BIGGER IS NOT ALWAYS BETTER - TRANSMISSION AND FITNESS BURDEN OF ~1MB PSEUDOMONAS SYRINGAE MEGAPLASMID pMPPla107 . . . 59
Abstract. . . 59
Introduction . . . .60
Material and Methods . . . .63
Results . . . .71
Discussion . . . .74
References . . . .79
V. CHAPTER FIVE: CONCLUSIONS . . . 84
LIST OF TABLES
Table
2.1 Analysis of Deviance Table for the Full Survival Model. . . 21
2.2 Full Linear Model: Effects on Relative Fitness. . . . . . 22
3.1 ANCOVA Table: Species Covariance Model Effect on Relative Fitness . . . .51
4.1 Pseudomonas syringae strains and plasmids. . . .65
4.2 Megaplasmid loss without stabilizing selection: proportion of megaplasmid free cells in three different environments . . . .74
4.3 KEGG Pathway analysis of select ORFs from pMPPla107 . . . .77
LIST OF FIGURES
Figure
2.1 Distributions of the protein connectivity in E. coli. . . 14 2.2 Most genes are deleterious and quickly become undetectable. . . 19 2.3 Information genes have the poorest survival. . . . . . 20 2.4 Informational gene survival is independent of protein and
regulatory network connectivity . . . .23 2.5 Among the surviving genes the relationship between relative
fitness and protein connectivity supports the Complexity Hypothesis
for all gene function classes. . . .24 2.6 Ribosomal genes are less costly than less connected and
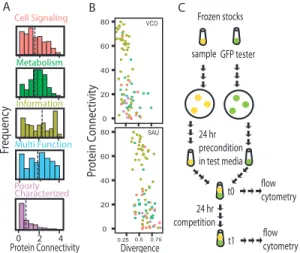
less clustered thioredoxin network genes. . . 28 3.1 Experimental approach to test the effects of divergences and
connectivity on relative fitness of transferred genes.. . . .46 3.2 Consistently a majority of tested genes increased in density over the
competition period, which suggests fitness advantage relative to reference strain. . . .50 3.3 Compared to the more divergent S. aureus, V. cholerai genes are less
costly when expressed in an E. coli background. . . .50 3.4 Increased protein divergence negatively covaries with fitness. . . . . . 52 3.5 Although many genes (especially low connected) show limited
interaction between fitness cost and divergence, there are examples of
severe interaction as well. . . 54 4.1 The pMPPla107 conjugates with high efficiency to pseudomonad
strains but not E. coli. . . .72 4.2 The pMPPla107 lowers host fitness of Pla8003, a close relative to
LIST OF ABBREVIATIONS AND SYMBOLS
Bp Base pairs
Ci Clustering coefficient for gene i (protein clustering) d Pairwise amino acid sequence divergence
GFP Green fluorescent protein HGT Horizontal gene transfer m Malthusian growth parameter ORF Open reading frame
pi Probability of maintaining all protein-protein interactions. PPI Protein-protein interaction (protein connectivity)
r selection coefficient
CHAPTER ONE: INTRODUCTION
The gradualist view of adaptive evolution suggests that the observed complexity of life
on Earth is the product of natural selection driving the incremental accumulation of beneficial
mutations with small phenotypic effects (Ohno 1999, Ohno et al. 1968). Bacteria can be
exceptions to this view as bacteria can also evolve through transfer of genetic material across
species boundaries via horizontal gene transfer (HGT). HGT genes can be different from those
already present in the recipient genome and thus may quickly increase genomic, proteomic, and
phenotypic complexity (Matzke et al. 2014, Brembu rt al. 2013). Although HGT occurs by
several known mechanisms (Skipper et al. 2013, Sun et al. 2013, Navarro et al. 2013, Gardiner
et al. 2013), plasmids likely contribute strongly to the saltational nature of HGT-driven
evolution as plasmids are common in bacterial populations (Clewell et al. 2014, San Millan et
al. 2014, Henry et al. 2013) and plasmids can potentially transfer large amounts (>1Mb) of
genetic information (Sakai et al. 2014, Althabegoiti et al. 2014, Baltrus et al. 2011).
The abrupt genetic change caused by HGT may incur greater pleiotropic costs than the
nucleotide substitutions expected under the gradualist view. Put simply, adding a new gene(s)
to an established network of genes may have profoundly deleterious effects. These deleterious
effects can be caused by perturbing the stoichiometry of a gene network, creation of
heterologous dimers, being insensitive to regulation, etc (Baltrus 2013, Starikova et al. 2012,
Levin and Cornejo 2009). This idea is consistent with the seminal work of H. A. Orr who
predicted a significant reduction in the rate of adaptation as the number of interaction increases
Direct perturbations of protein network interactions in model systems suggest that the
more interactions a protein has, the more likely that a perturbation will have a high cost. For
instinstance, when a subset of ribosomal genes (that typically have many interactions) were
cloned and expressed in E. coli on a plasmid there was visible growth retardation suggesting
that expression of these genes decreased the intrinsic growth rate (Sorek et al. 2007), although
some suggest otherwise (Wagner et al. 2013, Gophna and Ofran 2011). Likewise in the yeast,
S. cerevisiae, the likelihood that removal of a protein will prove lethal correlates with the
number of interactions the protein has (Lu et al. 2010, Telavera et al. 2013, Manke et al. 2005).
Finally, transcript depletion of 26 highly interacting E. coli genes resulted in a lethal phenotype
(Bergmiller et al. 2012).
Much like the direct manipulation experiments in model systems, phylogenetic
investigations of natural HGT events have shown that genes with few protein interactions (low
protein connectivity) undergo HGT more often than genes with many protein interactions (high
protein connectivity) (Wiedenbeck and Cohan 2011, Cohen et al. 2011 Wellner et al. 2007).
For example, in a study of HGT among six bacterial groups, Ravi Jain (1999) showed that
highly connected ribosomal genes are transferred rarely. Similarly, in an extensive phylogenetic
analysis (Cohen et al. 2011) of the whole genomes of 50 bacterial species confirmed that genes
with many protein-protein interactions are underepresented among the HGT. These data suggest
that transferred of highly connected genes have deleterious fitness effects.
The Complexity Hypothesis was proposed by Jain et al. (1999) to explain the
observed relationship between HGT success and low numbers of protein interactions. The
Complexity Hypothesis envisions a simplified HGT model where a transferred gene replaces a
interacted with by the native homolog, then there is no fitness cost to this HGT event. However
it is likely that the transferred protein is somewhat divergent from the native protein in percent
amino acid identity and that this divergence causes some or all protein-protein interactions to
fail. Fitness cost is thus the result of failed interactions. The Complexity hypothesis predicts
that gene transferability should decline with increasing protein connectivity and the rate of that
decline should accelerate with increasing divergence. That is, the most divergent genes with
many protein interactions are the most costly and least divergent genes with few interactions are
the least costly (Rivera et al. 1998, Doolittle et al. 1999, Jain et al. 2002, Lercher and Pal
2008).
The Complexity Hypothesis also suggests that gene with specific types of functions are
less likely to HGT than others. Specifically, the Complexity Hypothesis states that, “the
complexity of translational and transcriptional apparatuses, which are large complex systems
with many gene interactions, is a significant factor that restricts their successful horizontal
transfer rates relative to the high horizontal transfer rates observed for less complex enzymatic
assemblies of a few gene products” (Jain et al. 1999). These translational and transcriptional—
a.k.a. “Informational” genes—are predicted to transfer particularly poorly. As predicted, these
genes (such as the ribosomal genes described above) appear to have high fitness costs when
HGT and are underrepresented among the HGT events surveyed in earlier studies (Cohen et al.
2011, Wellner et al. 2007).
The Complexity Hypothesis has received some criticism. Historical data is always
colored by the exigencies of the examples analyzed and it is often difficult to provide a clear
hypothesis test. For instance, tests of the Complexity Hypothesis using comparative data often
function of the transferred protein with protein interaction complexity within the bacterial cell (Cohen et al. 2011). Additionally these studies of the Complexity Hypothesis offer little insight into how the arrangement and timing of protein interactions influences HGT success. Most notably there is a lack of understanding whether high protein connectivity, the way in which protein interactions are arranged (protein clustering), or whether interactions are permanent or temporal is responsible for the observed evolutionary trends (Gelperin et al. 2005).
I adapted network theory and developed an experimental evolution approach to investigate how HGT success is affected by protein connectivity in addition to testing some aspects of the Complexity Hypothesis. The network approach is useful because it is a clear mathematical abstraction that can provide insight into fundamental organizational principles of organismal genetics and metabolism. The network approach allows systematic quantification for each peptide of it’s number of protein-ptotein interactions, termed connectivity, and of the arrangement of those interactions, termed clustering. Considering HGT the most important question is whether connectivity or clustering reliably influences fitness, and if so, by how much. Answers to these questions determine whether genetic interaction networks constrain or promote evolution towards increasing complexity.
My experimental approach measured the fitness consequences of three aspects of HGT. First, I quantified the relationship between transferability and connectivity among 4122 non-divergent HGTs into E.coli using a novel high-throughput assay (Chapter 2). Second, I quantify the combined connectivity and divergence effect on fitness outcome of 89 HGT events by transferring genes from V. cholera and S. aureous into E. coli genetic background and
REFERENCES
Baltrus, D.A., 2013. Exploring the costs of horizontal gene transfer. Trends Ecol. Evol. (Amst.) 28, 489–495. doi:10.1016/j.tree.2013.04.002
Baltrus, D.A., Nishimura, M.T., Romanchuk, A., Chang, J.H., Mukhtar, M.S., Cherkis, K., Roach, J., Grant, S.R., Jones, C.D., Dangl, J.L., 2011. Dynamic evolution of pathogenicity revealed by sequencing and comparative genomics of 19 Pseudomonas syringae isolates. PLoS Pathog. 7, e1002132. doi:10.1371/journal.ppat.1002132
Bergmiller, T., Ackermann, M., Silander, O.K., 2012. Patterns of evolutionary conservation of essential genes correlate with their compensability. PLoS Genet. 8, e1002803.
doi:10.1371/journal.pgen.1002803
Brembu, T., Winge, P., Tooming-Klunderud, A., Nederbragt, A.J., Jakobsen, K.S., Bones, A.M., 2013. The chloroplast genome of the diatom Seminavis robusta: New features introduced through multiple mechanisms of horizontal gene transfer. Mar Genomics.
doi:10.1016/j.margen.2013.12.002
Clewell, D.B., Weaver, K.E., Dunny, G.M., Coque, T.M., Francia, M.V., Hayes, F., 2014. Extrachromosomal and Mobile Elements in Enterococci: Transmission, Maintenance, and Epidemiology, in: Gilmore, M.S., Clewell, D.B., Ike, Y., Shankar, N. (Eds.), Enterococci: From Commensals to Leading Causes of Drug Resistant Infection. Massachusetts Eye and Ear
Infirmary, Boston.
Cohen, O., Gophna, U., Pupko, T., 2011. The complexity hypothesis revisited: connectivity rather than function constitutes a barrier to horizontal gene transfer. Mol. Biol. Evol. 28, 1481–1489. doi:10.1093/molbev/msq333
Doolittle, W.F., 1999. Lateral genomics. Trends Cell Biol. 9, M5–8.
Gardiner, D.M., Kazan, K., Manners, J.M., 2013. Cross-kingdom gene transfer facilitates the evolution of virulence in fungal pathogens. Plant Sci. 210, 151–158.
doi:10.1016/j.plantsci.2013.06.002
Gelperin, D.M., White, M.A., Wilkinson, M.L., Kon, Y., Kung, L.A., Wise, K.J., Lopez-Hoyo, N., Jiang, L., Piccirillo, S., Yu, H., Gerstein, M., Dumont, M.E., Phizicky, E.M., Snyder, M., Grayhack, E.J., 2005. Biochemical and genetic analysis of the yeast proteome with a movable ORF collection. Genes Dev. 19, 2816–2826. doi:10.1101/gad.1362105
Gophna, U., Ofran, Y., 2011. Lateral acquisition of genes is affected by the friendliness of their products. Proc. Natl. Acad. Sci. U.S.A. 108, 343–348. doi:10.1073/pnas.1009775108
Jain, R., Rivera, M.C., Moore, J.E., Lake, J.A., 2002a. Horizontal gene transfer in microbial genome evolution. Theor Popul Biol 61, 489–495.
Jain, R., Rivera, M.C., Moore, J.E., Lake, J.A., 2002b. Horizontal gene transfer in microbial genome evolution. Theor Popul Biol 61, 489–495.
Lercher, M.J., Pál, C., 2008. Integration of horizontally transferred genes into regulatory interaction networks takes many million years. Mol. Biol. Evol. 25, 559–567. doi:10.1093/molbev/msm283 Lu, C., Hu, X., Wang, G., Leach, L.J., Yang, S., Kearsey, M.J., Luo, Z.W., 2010. Why do essential
proteins tend to be clustered in the yeast interactome network? Mol Biosyst 6, 871–877. doi:10.1039/b921069e
Manke, T., Demetrius, L., Vingron, M., 2005. Lethality and entropy of protein interaction networks. Genome Inform 16, 159–163.
Matzke, N.J., Shih, P.M., Kerfeld, C.A., 2014. Bayesian analysis of congruence of core genes in prochlorococcus and synechococcus and implications on horizontal gene transfer. PLoS ONE 9, e85103. doi:10.1371/journal.pone.0085103
Ohno, S., 1999. Gene duplication and the uniqueness of vertebrate genomes circa 1970-1999. Semin. Cell Dev. Biol. 10, 517–522. doi:10.1006/scdb.1999.0332
Ohno, S., Wolf, U., Atkin, N.B., 1968. Evolution from fish to mammals by gene duplication. Hereditas 59, 169–187.
Orr, H.A., 2000. Adaptation and the cost of complexity. Evolution 54, 13–20.
Sakai, Y., Ogawa, N., Shimomura, Y., Fujii, T., 2014. A 2,4-dichlorophenoxyacetic acid degradation plasmid pM7012 discloses distribution of an unclassified megaplasmid group across bacterial species. Microbiology (Reading, Engl.) 160, 525–536. doi:10.1099/mic.0.074369-0
Skipper, K.A., Andersen, P.R., Sharma, N., Mikkelsen, J.G., 2013. DNA transposon-based gene vehicles - scenes from an evolutionary drive. J. Biomed. Sci. 20, 92. doi:10.1186/1423-0127-20-92
Sorek, R., Zhu, Y., Creevey, C.J., Francino, M.P., Bork, P., Rubin, E.M., 2007. Genome-wide experimental determination of barriers to horizontal gene transfer. Science 318, 1449–1452. doi:10.1126/science.1147112
Starikova, I., Harms, K., Haugen, P., Lunde, T.T.M., Primicerio, R., Samuelsen, Ø., Nielsen, K.M., Johnsen, P.J., 2012b. A trade-off between the fitness cost of functional integrases and long-term stability of integrons. PLoS Pathog. 8, e1003043. doi:10.1371/journal.ppat.1003043
Sun, D., Wang, B., Zhu, L., 2013. [Advances in molecular mechanisms of bacterial resistance caused by stress-induced transfer of resistance genes--a review]. Wei Sheng Wu Xue Bao 53, 641–647. Talavera, D., Robertson, D.L., Lovell, S.C., 2013. The role of protein interactions in mediating
essentiality and synthetic lethality. PLoS ONE 8, e62866. doi:10.1371/journal.pone.0062866 Wagner, A., Zarecki, R., Reshef, L., Gochev, C., Sorek, R., Gophna, U., Ruppin, E., 2013.
Computational evaluation of cellular metabolic costs successfully predicts genes whose expression is deleterious. Proc. Natl. Acad. Sci. U.S.A. 110, 19166–19171.
doi:10.1073/pnas.1312361110
Wellner, A., Lurie, M.N., Gophna, U., 2007. Complexity, connectivity, and duplicability as barriers to lateral gene transfer. Genome Biol. 8, R156. doi:10.1186/gb-2007-8-8-r156
Wiedenbeck, J., Cohan, F.M., 2011. Origins of bacterial diversity through horizontal genetic transfer and adaptation to new ecological niches. FEMS Microbiol. Rev. 35, 957–976.
CHAPTER TWO: COST OF GENE OVER EXPRESSION IN ESCHERICHIA COLI DEPENDS ON GENE FUNCTION MORE THAN NETWORK CONNECTIVITY.
Authors: Artur Romanchuk, Christina L. Burch, Corbin D. Jones
ABSTRACT
Understanding the evolutionary and cellular mechanisms governing horizontal gene
transfer (HGT) is critical for predicting how bacterial genomes and phenotypes evolve.
Phylogenetic studies of microbial genome evolution suggest that the structural organisation of
genetic pathways, such as interactions among proteins, biases horizontal gene transfer toward
genes with few interactions. Here we investigate the contribution to this pattern to the fitness
costs associated with the increased expression of transferred genes. We integrate existing data
from E. coli describing protein-protein interactions (protein connectivity), gene function, and
other gene characteristics with a novel experimental measure of the fitness costs associated with
over-expression of 4102 E.coli genes. Expression of genes important to informational processes
within the cell was more costly than that of genes in other functional categories. In contrast to
the phylogenetic data, this higher cost did not result from the tendency of Informational genes to
have a high number of gene interactions. Among other functional classes of genes, the strongest
effect was that protein connectivity unexpectedly reduced fitness cost. Our data suggest that
gene transferability, at least of low divergence homologues, may be determined more by the
functional (and perhaps ecological) context of the gene than by the genomic or cellular milieu of
the host genome.
INTRODUCTION
Horizontal gene transfer (HGT) is a major contributor to bacterial genome evolution (Skippington and Ragan 2011). Typically HGT contributes ~14% of the protein coding genome of a bacterial species, with some species exceeding 20% (Gorgarten et al. 2005, Nakamura et al. 2004). As a result HGT generates phenotypic diversity (Hanage 2013, Guttman 1997, Baltrus 2011), drives the expansion of protein families (Treangen and Rocha 2011), and facilitates the evolution of new phenotypes (Moran and Jarvik 2010), new metabolic pathways (Soyer and Creevey 2010), and new species (Schaack et al. 2010).
The Complexity Hypothesis, which posits an association between a gene’s transferability and the complexity of its protein connectivity, is the leading explanation for the observed variation in HGT frequency among genes (Jain 1999). This hypothesis explains the observed pattern, the low rate of HGT by high PPI genes, by arguing that members of large interconnected protein complexes can not perform any beneficial function without their respective partner proteins, which are often not transferred during the same HGT event. Moreover, the chance that the transferred gene will engage in at least one deleterious interaction is expected to increase with its total number of interactions (Nakamura et al. 2004, Cohen et al. 2008, Hao and Golding 2008, Jain et al 1999). Informational genes, which are enriched for interactions, should therefore not be transferred often (Figure 2.1A)(Jain et al. 1999, Sorek et al. 2007). Mechanistically, Jain et al. argued that increased divergence of the transferred homologs would result in an increase chance for a deleterious interaction and the chance of these deleterious events increased with the number of interactions, although others have suggested differences in gene expression alone could lead to the observed pattern (Jain 1999, Wellner 2007).
which it interacts, and clustering (Ci), the arrangement of those protein interactions. Clustering ranges from protein-protein interactions that form complete interconnected circles (Ci = 1) to those that are branched (0< Ci <1) or linear (Ci = 0). While clustering and connectivity are commonly used in theoretical models of gene interactions, most data driven analyses focus on connectivity, often as measured by protein-protein interaction (PPI).
Direct experimental tests of the Complexity Hypothesis are scarce and have yielded mixed results. Whereas small scale studies considering a handful of genes have shown that the fitness impact of foreign or overexpressed native genes on native complexes can be minimal (Wellner and Gophna 2008, Omer et al. 2010, Bergmiller T. 2012, see also Dykhuizen et al. 1987 and Breen et al. 2012), two larger scale studies recapitulated the negative relationship between transferability and connectivity seen in the comparative data. In a study of several dozen genes in yeast, Papp et al. (2003) found that native gene overexpression had stronger negative impacts on fitness for genes in protein complexes compared to unconnected genes. In a large survey of ~250,000 bacterial genes that could or could not be transformed into E. coli in laboratory, Sorek et al. (2007) suggested that toxicity to the host increased with gene dosage for genes with high connectivity but not necessarily for genes with few protein-protein interactions. They hypothesized that regardless of the species of origin or divergence the associated increased expression inhibited HGT, a result that was supported by a later computational analysis of factors affecting HGT, which concluded that gene expression level was the primary factor affecting HGT (Park and Zhang 2012).
genome-wide experimental test of the Complexity Hypothesis that investigates the impacts of HGT-induced increases in native gene expression in the absence of sequence or functional divergence in the transferring genes. In essence we are modeling one of the early stages of HGT: the initial introduction of a new copy of a gene into the host genome. We then determine the potential fitness cost of this new copy and see how that cost relates to gene function and protein connectivity. To take a broad measure of the complexity of protein connectivity, we consider both PPI as well as regulatory interactions and quantify both types of interactions using the connectivity and clustering metrics. Consistent with the Complexity Hypothesis we show that Informational genes have a high cost when HGT; contrary to the Complexity Hypothesis we show that this cost is largely independent of the complexity of any measure of protein connectivity. For other types of gene functions, we show that protein connectivity partially predicts the fitness effect of HGT for each transferred gene, but not in the direction predicted by the Complexity Hypothesis.
MATERIAL AND METHODS Bacterial Strains and Plasmids
encodes chloramphenicol resistance. The 4122 cloned genes all have the exact sequence of the gene encoded on the E. coli AG1 W3110 chromosome.
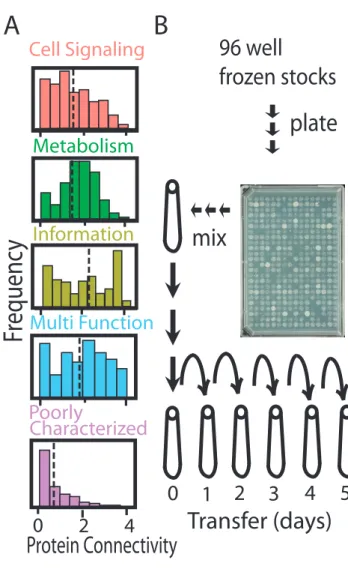
Figure 2.1. Distributions of the protein connectivity of different functional classes of Escherichia coli genes used in this experiment and the experimental design used to assay their relative cost. A) Histograms showing medians and distributions of protein connectivity (x-axis log scale number of protein-protein interactions) for genes from each cellular function category (pink – Cell Signaling, green – Metabolism, light green – Informational, blue – Multi Function, purple – Poorly Characterized). Informational genes have the highest median protein connectivity. B) Experimental design showing sample preparation, mixing, propagation and experimental timeline. All ASKA (4122) HGT variant lines were plated by the vendor on multiple agar plates using colony replicators. All colonies were pooled together into a common mix and each replicate population was started with an inoculum from the common mix. Each replicate population was propagated every 24 hours for five days via serial dilution. Population samples from days one, three and five were sequenced to estimate relative frequencies of each HGT variant strains at each time point.
B
A
96 well
frozen stocks
2
0
4
Transfer (days)
3
0 1 2
4 5
Protein Connectivity
Fr
equenc
y
Cell Signaling
Information
Metabolism
Multi Function
Poorly
Characterized
plate
Generation of the Mutant Pool
The 4122 ASKA strains shipped as 4122 colonies that had been spotted onto 57 LB agar plates using a 96-pin replicator tool. These colonies were kept on ice or at 4°C for less than one week while we created local archives of the individual strains by stabbing the colonies with a 96-pin replicator. Colonies from individual plates were then harvested by suspending in 5 ml of LB + 30 ng/mL Chloramphenicol. The resulting cell suspensions were mixed to yield a total volume of 300 mL, the mixture was centrifuged for 10 minutes at 10K rpm, and the supernatant was decanted. The cell pellet was resuspended in 300 mL of 60% LB + 40% glycerol and divided into 1.5 mL aliquots that were archived at -80°C.
Pooled Competition
were conducted in this manner. Of the 4122 ASKA strains, 20 failed to grow sufficiently and were eliminated from the experiment.
Plasmid DNA Extraction and Sequencing
Total pCA24N plasmid DNA was extracted from 2 mL of individual archived cultures using the Fermentas Plasmid miniprep kit (Thermo Scientific Waltham, MA kit#K0502). Plasmid was extracted from each of the eight (8) replicate competition experiment after the 1st, 3rd, and 5th serial transfers, yielding a total of 24 samples. These samples were barcoded using standard Illumina TrueSeq (www.illumina.com/truseq.ilmn) multiplex barcoding, pooled paired read libraries were generated and 50 bp long paired end reads were sequenced using Illumina HiSeq 2000 sequencing at the UNC High throughput Sequencing Facility. We obtained ~16.6 million reads per sample.
Mapping Sequencing Reads
Pairs in which one read mapped to the region spanning 25bp on either side of a gene-plasmid
junction. Reads that mapped to E. coli genes absent from the ASKA collection were unambiguously identified as chromosomal contamination (this fraction was ~10%).
Statistical analysis
All statistical analyses were conducted in R (version 3.0.0). Survival analyses were
conducted using the survreg package, specifying an accelerating failure time model with an exponential distribution. All genes were given a survival value of observed (1) or not observed
(0), with no censoring. Survival was modeled as a function of the fixed effects described in
Results, including a random effect of replicate. Linear modeling was conducted using the nlme
package. For each gene, only replicates in which that gene was observed after both transfers 1
and 3 were included in the analysis. 1163 genes met these criteria in at least one replicate and,
even among these genes the number of included replicates was variable. In each replicate, we
calculated ln(fitness) of each gene as ln(f3/f1) where fi is the frequency after transfer i.
ln(fitness) was modeled as a function of the fixed effects specified in Results and a random effect of replicate, weighting the contribution of each gene by the number of replicates in which
it was observed after both transfers 1 and 3.
RESULTS
Our experimental design (Figure 2.1B)made use of the ASKA library of 4122 strains of E. coli, each transformed with a plasmid capable of expressing a different E. coli
4122 strains, 20 failed to grow sufficiently and were eliminated from the experiment. We
measured the fitness effects associated with expression of the transferred genes by pooling the
remaining 4102 strains in approximately equal numbers and serially transferring the pool in
media that induced expression of the transferred genes (Methods). Serial transfers of 100 uL
into 10 mL fresh media were conducted every 24 hours for 5 days. We monitored changes in the
frequencies of the transferred genes in eight replicate serial transfer experiments by deep
sequencing total plasmid isolated from each replicate after days 1, 3, and 5.
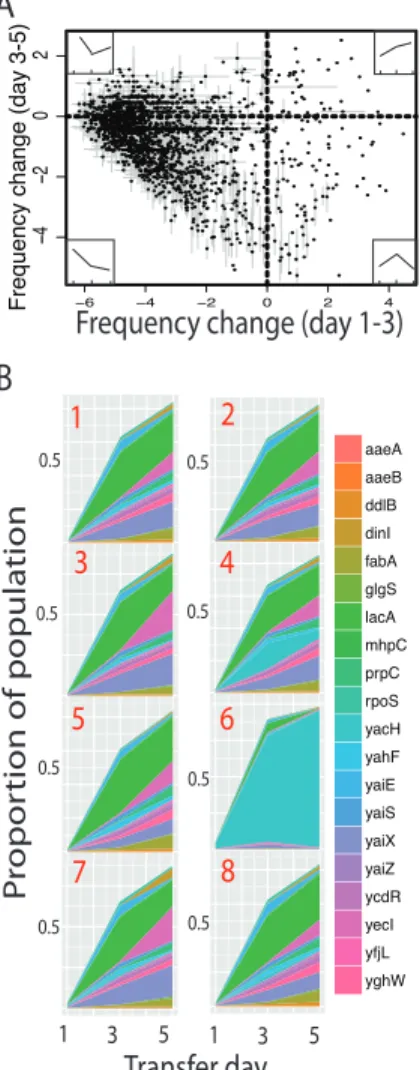
Close visual inspection of the resulting data revealed several general patterns.
Trajectories of individual gene frequencies over time exhibited low variance among replicates,
but high variance among genes (Figures 2A and S1). Most transferred genes rapidly declined in
frequency, becoming undetectable (frequency < 10-6) by day 5, whereas only a few increased in frequency throughout (upper right quadrant of Figure 2.2A). Of the 4122 genes in the ASKA
collection, 4102 were detected in at least one replicate on day 1, 3360 on day 3, and only 1968
on day 5. The change in gene frequency between days 1 and 3 (measured as ln(f3/f1), where fi is
the transferred gene frequency measured at day i) was negatively correlated with the change in
gene frequency between days 3 and 5 (Figure 2.2A; Pearson’s ! = -0.339, p < 0.0001). More specifically, genes that rapidly decrease in frequency initially tend to slow their rate of decrease
later and genes that increase in frequency initially tend to decrease in frequency later. Although
the former pattern was unexpected, the latter pattern is expected to result from the increase in
population mean fitness that occurs as high fitness genes rapidly increase in frequency.
Examination of the highest fitness genes emphasizes the high consistency among the
experimental replicates, but also reveals the major source of variance between replicates.
are plotted in Figure 2.2B and Table S1. Together these genes made up the bulk of each replicate population by day five and the relative contributions of the 20 genes are consistent among 7 of the 8 replicate populations. In a single replicate, the yacH gene rose to an exceptionally high frequency by day 5, possibly because it started at an uncharacteristically high frequency on day 1 (Figure 2.2B, replicate 6). It is apparent that the dynamics of this gene had an impact on the dynamics of many other genes in this replicate (Figure S1).
Figure 2.2. Most genes are deleterious and quickly become undetectable, although a consistent minority of tested genes increase in frequency over the competition period. A) A global view of gene frequency change between day 1/3 and day 3/5 with inset illustrative gene trajectory diagrams. Most HGT variant strains decrease in frequency rapidly between day one and three, but slow the rate of decrease between day three and five (top and bottom left). A small fraction of HGT variant strains increased in frequency over time (top right). Finally, a few genes briefly rise in frequency, but then drop in frequency (bottom right). B) Within replicate change in relative proportions of the top 20 HGT variant strains over the three days is consistent among replicates with the exception
1 3 5
P
ropor
tion of popula
tion 0.5 0.5 0.5 0.5 0.5 0.5 0.5 0.5 B 1 2 3 4 5 6 7 8 !!"# !!"$ %%&$ %'() *!+# ,&,-&!.# /012 1312 314-5!.6 5!07 5!'8 5!'-5!'9 5!': 5.%; 5".) 5*<= 5,0>
Transfer day1 3 5 73"?@"(.5A.0!(,"AB%!5ACDEF ï ï ï G
ï ï G ● ● ● ● ● ● ● ● ● ● ● ● ● ● ● ● ● ● ● ● ● ● ● ● ● ● ● ● ● ● ● ● ● ● ● ● ● ● ● ● ● ● ● ● ● ● ● ● ● ● ● ● ● ● ● ● ● ● ● ● ● ● ● ● ● ● ●● ● ● ● ● ● ● ● ● ● ●● ● ● ● ● ● ● ● ● ● ● ● ● ● ● ● ● ● ● ● ● ● ● ● ● ● ● ● ● ● ● ● ● ● ● ● ● ● ● ● ● ● ● ● ● ● ● ● ● ● ● ● ● ● ● ● ● ● ● ● ● ● ● ● ● ● ● ● ● ● ● ● ● ● ● ● ● ● ● ● ● ● ● ● ● ● ● ● ●● ● ● ● ● ● ● ● ● ● ● ● ● ● ● ● ● ● ● ● ● ● ● ● ● ● ● ● ● ● ● ● ● ● ● ● ● ● ● ● ● ● ● ● ● ● ● ● ● ● ● ● ● ● ● ● ● ● ● ● ● ● ● ● ● ● ● ● ● ● ● ● ● ● ● ● ● ● ● ● ● ● ● ● ● ● ● ● ● ● ● ● ● ● ● ● ● ● ● ● ● ● ● ● ● ● ● ● ● ● ● ● ● ● ● ● ● ● ● ● ● ● ● ● ● ●● ● ● ● ● ● ● ● ● ● ● ● ● ● ● ● ● ● ●●● ● ● ● ● ● ● ● ● ● ● ● ● ● ● ● ● ● ● ● ● ● ● ● ● ●● ● ● ● ● ● ● ● ● ● ● ● ● ● ● ● ● ● ● ● ● ● ● ● ● ● ● ● ● ● ● ●● ● ● ● ● ● ● ● ● ● ● ● ● ● ● ● ● ● ● ● ● ● ● ● ● ● ● ● ● ● ● ● ● ● ● ● ● ● ● ● ● ● ● ● ● ● ● ● ● ● ● ● ● ● ● ● ● ● ● ● ● ● ● ●● ● ● ● ● ● ● ● ● ● ● ● ● ● ● ● ● ● ● ● ● ● ● ● ● ● ● ● ● ● ● ● ● ● ● ● ● ● ● ● ● ● ● ● ● ● ● ● ● ● ● ● ● ● ● ● ● ● ● ● ● ● ● ● ● ● ● ● ● ● ● ● ● ● ● ● ● ● ● ● ● ● ● ● ● ● ● ● ● ●● ● ● ● ● ● ● ● ● ● ● ● ● ● ● ● ● ● ● ● ● ● ● ● ● ● ● ● ● ● ● ● ● ● ● ● ● ● ●● ● ●● ● ● ● ● ● ● ● ● ● ● ● ● ● ● ● ● ● ● ● ● ● ● ● ● ● ● ● ● ● ● ● ● ● ● ● ● ● ● ● ● ● ● ● ● ● ● ● ● ● ● ● ● ● ● ● ● ● ● ● ● ● ● ● ● ● ● ● ● ● ● ● ● ● ● ● ● ● ● ● ● ● ● ● ● ● ● ● ● ● ● ● ● ● ● ● ● ● ● ● ● ● ● ● ● ● ● ● ● ● ● ● ● ● ● ● ● ● ● ● ● ● ● ● ● ● ● ● ● ● ● ● ● ● ● ● ● ● ● ● ● ● ● ● ● ● ● ● ● ● ● ● ● ● ● ● ● ● ● ● ● ● ● ● ● ● ● ● ● ● ● ● ● ● ● ● ● ● ● ● ● ● ● ● ● ● ● ● ● ● ● ● ● ● ● ● ● ● ● ● ● ● ● ● ● ● ● ● ● ● ● ● ● ● ● ● ● ● ● ● ● ● ● ● ● ● ● ● ● ● ●● ● ● ● ● ● ● ● ● ● ● ● ● ● ● ● ● ● ● ● ● ● ● ● ● ● ● ● ● ● ● ● ● ● ● ● ● ● ● ● ● ● ● ● ● ● ● ● ● ● ● ● ● ● ● ● ● ● ● ● ● ● ● ● ● ● ● ● ● ● ● ● ● ● ● ● ● ● ● ● ● ● ● ● ● ● ● ● ● ● ● ● ● ● ● ● ● ● ● ● ● ● ● ● ● ● ● ● ● ● ● ● ● ● ● ● ● ● ● ● ● ● ● ● ● ● ● ● ● ● ● ● ● ● ● ● ● ● ● ● ● ● ● ● ● ● ● ● ● ● ● ● ● ● ● ● ● ● ● ● ● ●● ● ● ● ● ● ● ● ● ● ● ● ● ● ● ● ● ● ● ● ● ● ● ● ● ● ● ● ● ● ● ● ● ● ● ● ● ● ● ● ● ● ● ● ● ● ● ● ● ● ● ● ● ● ●● ● ● ● ● ● ● ● ● ● ● ● ● ● ● ● ● ● ● ● ● ● ● ●● ● ● ● ● ● ● ● ● ● ● ● ● ●● ● ● ● ● ● ● ● ● ● ● ● ● ●● ● ● ●● ● ● ● ● ● ● ● ● ● ● ● ● ● ● ● ● ● ● ● ● ● ● ● ● ● ● ● ● ● ● ● ● ● ● ● ● ● ● ● ● ● ● ● ● ● ● ● ● ● ● ● ● ● ● ● ● ● ● ● ● ● ●● ● ● ● ● ● ● ● ● ● ● ● ● ● ● ● ● ● ● ● ● ● ● ● ● ● ● ● ● ● ● ● ● ● ● ● ● ● ● ● ● ● ● ● ● ● ● ● ● ● ● ● ● ● ● ● ● ● ● ● ● ● ● ● ● ● ● ● ● ● ● ● ● ● ● ● ● ● ● ● ● ● ● ● ● ● ● ● ● ● ● ● ● ● ● ● ● ● ● ● ● ● ● ● ● ● ● ● ● ● ● ● ● ● ● ● ● ● ● ● ● ● ● ● ● ● ● ● ● ● ● ● ● ● ● ● ● ● ● ● ● ● ● ● ● ● ● ● ● ● ● ● ● ● ● ● ● ● ● ● ● ● ● ● ●● ● ● ● ● ● ● ● ● ● ● ● ● ● ● ● ● ● ● ● ● ● ● ● ● ● ● ● ● ● ● ● ● ● ● ● ● ● ● ● ● ● ● ● ● ● ● ● ● ● ● ● ● ● ● ● ● ● ● ● ● ● ● ● ● ● ● ● ● ● ● ● ● ● ● ● ● ● ● ● ● ● ● ● ● ● ● ● ● ● ● ● ● ● ● ● ● ● ● ● ● ● ● ● ● ● ● ● ● ● ● ● ● ● ● ● ● ● ● ● ● ● ● ● ● ● ● ● ● ● ● ● ● ● ● ● ● ● ● ● ● ●● ● ● ● ● ● ● ● ● ● ● ● ● ● ● ● ● ● ● ● ● ● ● ● ● ● ● ● ● ● ● ● ● ● ● ● ● ● ● ● ● ● ● ● ● ● ● ● ● ● ● ● ● ● ● ● ● ● ● ● ● ● ● ● ● ● ● ● ● ● ● ● ● ● ● ● ● ● ● ● ● ● ● ● ● ● ● ● ● ● ● ● ● ● ● ● ● ● ● ● ● ● ● ● ● ● ● ● ● ● ● ● ● ● ● ● ● ●● ● ● ● ● ● ● ● ● ● ● ● ● ● ● ● ● ● ●● ● ● ● ● ● ● ● ● ● ● ● ● ● ● ● ● ● ● ● ● ● ● ● ● ● ● ● ● ● ● ● ● ● ● ● ● ● ● ● ● ● ● ● ● ● ● ● ● ● ● ● ● ● ● ● ● ● ● ● ● ● ● ● ● ● ● ● ● ● ● ● ● ● ● ● ● ● ● ● ● ● ● ● ● ● ● ● ● ● ● ● ● ● ● ● ● ● ● ● ● ● ● ● ● ● ● ● ● ● ● ● ● ● ● ● ● ● ● ● ● ● ● ● ● ● ● ● ● ● ● ● ● ● ● ● ● ● ● ● ● ● ● ● ● ● ● ● ● ● ● ● ● ● ● ● ● ● ● ● ● ● ● ● ● ● ● ● ● ● ● ● ● ● ● ● ● ● ● ● ● ● ● ● ● ● ● ● ● ● ● ● ● ● ● ● ● ● ● ● ● ● ● ● ● ● ● ● ● ● ● ● ● ● ● ● ● ● ● ● ● ● ● ● ● ● ● ● ● ● ● ● ● ● ● ● ● ● ● ● ● ● ● ● ● ● ● ● ● ● ● ● ● ● ● ● ● ● ● ● ● ● ● ● ● ● ● ● ● ● ● ● ● ● ● ● ● ● ● ● ● ● ● ● ● ● ● ● ● ● ● ● ● ● ● ● ● ● ● ● ● ● ● ● ● ● ● ● ● ● ● ● ● ● ● ● ● ● ● ● ● ● ● ● ● ● ● ● ● ● ● ● ● ● ● ● ● ● ● ● ● ● ● ● ● ● ● ● ● ● ● ● ● ● ● ● ● ● ● ● ● ● ● ● ● ● ● ● ● ● ● ● ● ● ● ● ● ● ● ● ● ● ● ● ● ● ● A
We used a survival analysis to investigate the mechanistic basis of fitness differences among genes in our experiment. The survival analysis allowed us to include all of the genes in our analysis even though many were undetectable (i.e., were lost from the population) on days 3 and/or 5. Thus the survival analysis identifies across the whole experiment the parameters that affected the rate and probability of gene loss. The full survival model considered several predictor variables: gene function, gene length, position in operon, expression level, and connectivity and clustering for both protein-protein and regulatory interactions (Table S2 and S3).
Figure 2.3. Information genes have the poorest survival. Survival analysis shows high fitness cost of Information genes compared to Metabolic genes. Colors are as in figure 2.1(pink – Cell Signaling, green – Metabolism, light green – Information, blue – Multi Function, purple – Poorly Characterized).
We divided gene function into five broad categories based on their annotated function: cell signaling, informational, metabolic, multi-functional, and poorly characterized (Table S3). Table 2.1 shows the analysis of deviance table corresponding to this full model. Among the predictor variables we considered, gene function had the largest impact on survival (Deviance =
Sur
viv
al P
robabilit
y
1.00.5 0.75
0.25
Transfer day
1
3
5
Cell Signaling
Information
Metabolism
Multi Function
highest and lowest survival, respectively (Figure 3.2). Protein connectivity had a significantly
positive effect, and regulatory connectivity had a significantly negative effect. In addition, gene
length and position in operon (i.e. relative order within the operon) had statistically significant
negative effects on gene survival.
The significant contributions of gene function and protein and regulatory connectivity
motivated a closer investigation of the predictors most directly involved in the Complexity
Hypothesis, including the interactions between them. Using a survival analysis on a reduced
model, we estimated the effects of gene function, connectivity, clustering and all two and
three-way interactions between them separately for protein (Table S4) and regulatory interactions
(Table S5). Both analyses reveal significant effects of parameter interactions. With respect to
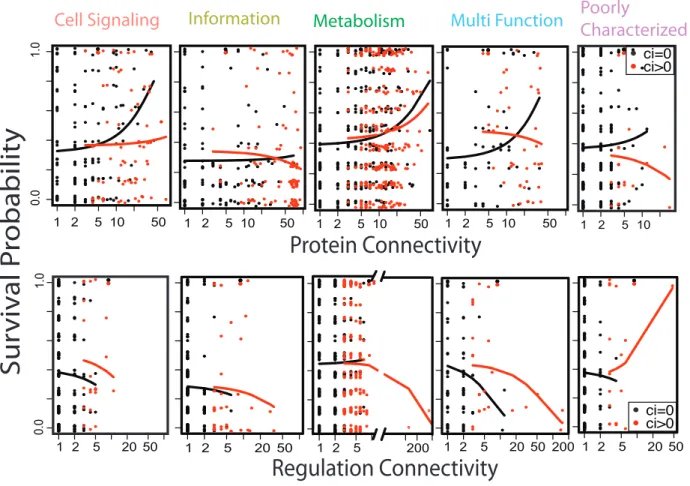
the Complexity Hypothesis, several important patterns are apparent in the data (Figure 2.4).
informational genes to be highly connected. That is, Informational genes had high costs
regardless of their protein or regulatory connectivity or clustering. Among the other functional
categories, the strongest network effect was an unexpected positive effect of protein
connectivity on survival. Only protein clustering and regulatory connectivity had the expected
negative effects on survival.
As suggested in Figure 2.2, the dynamics of individual genes are more complicated than
the decline in frequency to extinction modeled in the survival analysis. We investigated these
dynamics by examining the effects of the transferred gene characteristics on relative fitness
among only the 1164 genes (28% of the total) which are detected at day 3 in at least one
replicate. We measured fitness relative to the population mean as ln(f3/f1), where fi is the
transferred gene frequency measured at day i. We used a linear model to investigate the effects
of gene and network characteristics on relative fitness (Table 2.2). In this analysis, gene
gene function, connectivity, clustering and their two- and three-way interactions (Tables S6)
revealed different patterns than were apparent from the survival analysis. Among the surviving
genes, informational genes had higher average fitness than genes in other functional categories
(Figure 2.5A). Connectivity had the expected negative effect on fitness (Figure 2.5B). Finally,
clustering had a strong but variable effect that depended on gene function and on the type of
gene interaction, protein or regulatory (Figure 2.5B).
! " # !$ #$
$%$
!%$
! " # !$ #$ ! " # !$ #$ ! " # !$ #$ ! " # !$
! " # "$ #$
$%$
!%$
! " # "$ #$ ! " # ! " # "$ #$ "$$ ! " # "$ #$
Cell Signaling Information Metabolism Multi Function Poorly Characterized
Sur
viv
al P
robabilit
y
Protein Connectivity
Regulation Connectivity
"$$!"#$ !"%$
!"#$ !"%$
! " #! #"
$%
$&
$'
!
'
&
! " #! (! &!
*+-! *+,!
! " #! &!! "!! ! " #! #" ! " #! #" "!
Regulation Connectivity
"! (!
! '! &! %!
$%
$&
$'
!
'
&
! '! &! %! )! ! '! &! %! )! ! '! &! %! )! ! '! &! %! )!
Fitness
Protein Connectivity
Cell Signaling Information Metabolism Multi Function Poorly Characterized
$%
$&
$'
!
'
&
Fitness
Gene Function
B
A
*+-! *+,!
DISCUSSION
Jain et al’s (1999) Complexity Hypothesis is commonly invoked to explain why gene
function and complexity of gene interactions, typically measured in terms of protein
connectivity, correlate with gene transferability during HGT (Cohen et al. 2011). While a
number of studies have tested, applied, or extended this idea as genomic data has become more
available (Wellner et al. 2007), the evidence showing that complexity of gene interactions is the
causal mechanism limiting HGT remains mixed. Is complexity of interactions the cause or a
correlate of genes that are hard to HGT?
Here we developed a simplified experimental model of a key early stage of HGT—the
initial introduction of a gene into a new host—to dissect this question. We used a bulk
competition experiment to directly compare the fitness effects of expressing 4102 non-divergent
homologs transferred to an E. coli host. As non-divergent homologs are capable of making all
normal protein-protein interactions, our data explore the effects of altered regulation rather than
altered physical interactions. Qualitatively, our data concur with several earlier observations,
e.g. that Informational genes are more costly, but our results also show that the relationship
between the complexity of gene interactions and HGT gene fitness during this early stage is
more nuanced than initially suggested.
Survival analysis shows that exogenous expression of Informational genes decreases
fitness the most and that exogenous expression of Metabolic genes decreases fitness the least.
This result is consistent with Jain et al. (1999) and several other studies showing that
Informational genes, which typically have complex interactions, seldom HGT. Surprisingly,
defined more broadly now, the Complexity Hypothesis as originally defined by Jain et al.
incorporated both the number of gene interactions and the amount sequence divergence between the HGT gene and its homologs in the host genome. Divergent homologs were thought to
present a greater risk of a deleterious interaction. Our data suggest that the divergence
component is not required to recapitulate the bias against Informational genes. Over-expression may be enough to make an Informational gene relatively unfit compared to other gene classes.
Two other unanticipated patterns emerged from our results: (1) the fitness cost of Informational genes did not covary with protein connectivity and (2) in all other functional classes of genes there was a significant positive correlation between fitness and protein connectivity. Other genomic variables were also associated with differences in fitness in our survival analysis, but their effect was relatively minor. The both patterns are at odds with the
sensu lato definition of Complexity Hypothesis—increased complexity of gene interactions should result in decreased fitness. We observed the opposite. These patterns, however, could be reconciled with the Complexity Hypothesis sensu stricto if divergence between homologs is a strong determinate of deleteriousness (or if there is a strongly deleterious interaction between divergence and complexity). Our present data cannot fully address this question as our HGT genes are identical to the host’s, but our data serves as a strong motivation for further
experiments that do investigate the effects of divergence.
The difference between Informational genes and other functional categories in the relationship between fitness and connectivity may partially explain the low rate of Informational gene HGT. Informational genes do not gain the fitness benefit imparted by having more
than other categories such as Metabolism. This effect increases as the number of interactions
increases resulting in a paucity of Informational genes with a high number of interactions,
which is the pattern noted by Jain et al. Our data therefore suggest that complexity of gene
interactions does play a role in HGT, but that mechanism of this effect is different from that
assumed under the Complexity Hypothesis.
Our survival analysis captures the dynamics of all genes across the whole experiment,
but is strongly determined by those genes that go extinct. Our relative fitness analysis gives a
view of the fitness trajectories of surviving genes between two time points. Here the picture is
less clear than for the survival analysis: surviving Informational genes are slightly less costly
and the relationship between connectivity and fitness is not significant for most functional
categories, except Metabolism. The former likely reflects that the highly deleterious
Informational genes are undetectable by T3. The latter result is largely a lack of power driven
by the small number of high PPI genes for most functional categories at the start of the
experiment and the fact that by T3 only 28% of genes are still detectable. Despite this weak
power, we do see a main effect of clustering and a strong interaction between clustering,
connectivity and gene function. This result, consistent with the overall survival analysis,
suggests for the genes surviving to T3 that the structure of the gene interactions (i.e. clustering) could be as much of a driver of HGT fitness as the number of interactions (i.e. connectivity).
When proposing theComplexity Hypothesis, Jain et al. illustrated their point with the
ribosome and thioredoxin genes. We revisited these examples in our analysis (Figure 2.6). The
ribosome combines 56 protein coding genes and 22 RNAs into a highly connected and clustered
protein interaction network (Figure 2.6A). By contrast thioredoxin genes form a simple network
ribosomal genes should make them more deleterious. Looking at the relative fitness of the surviving genes (Figure 2.6B) shows that ribosomal genes span a wide range of fitness values and neither clustering nor protein connectivity appear to correlate with fitness. In contrast, the
thioredoxin network has lower connectivity and a lower relative fitness. Least connected thioredoxin genes (trxA and trxB) had the lowest fitness; the three most highly connected genes
(nrdA, nrdD, and nrdE) had the highest fitness of genes in the thioredoxin network (Figure 2.6B). While these examples cannot capture the dynamics of the entire experiment, they do qualitatively illustrate the independence of Informational gene fitness and the positive
relationship of non-Informational gene fitness with increased connectivity in our experiment.
Figure 2.6. Highly connected and clustered ribosomal genes are less costly than less connected and less clustered thioredoxin network genes. A) Graph representations of ribosome and thioredoxin networks illustrate the qualitative difference in connectivity between the ribosome and thioredoxin networks. Solid lines represent protein-protein interactions and dashed lines represent metabolic interactions. B) Scatter plot of the mean relative fitness (ln(f3/f1), where ft is the gene frequency at time t) across eight replicas versus protein connectivity (number protein-protein interaction between genes). Genes from the ribosome and thioredoxin network are grouped by cellular function category (symbols) and protein clustering coefficient (color gradient).
!"!! !"#!
Cell Signaling
Information
Metabolism
Poorly
Characterized
Protein Connectivity
!"
!#
!$
%
Fitness
Clustering
(Ci)
$
&
#
nrdD nrdB nrdA nrdE nrdF trxB trxA IpdA cysH $"!! %& %' %(
A
B
trxA trxB nrdF cysH nrdB nrdA nrdD rpsQ rpsA rpmE rpmJ rpmA rpsR rpsIAs noted above, the major difference between the work presented here and that of others
is that we measure the fitness cost of non-divergent homologs. As divergence in protein
sequence was conceived as the cause of broken protein-protein interactions in Jain et al.’s
original formulation of the Complexity Hypothesis, our use of non-divergent homologs may
partially explain our unique finding of a non-negative relationship between transferability and
connectivity. Given this difference, we turn our attention to the related Balance Hypothesis
(Papp et al. 2003, others Zhang et al. 2003, Calvin Bridges 1916) that was originally developed
to explain differences in gene duplicability. The Balance Hypothesis does not require
divergence to give rise to the negative relationship between transferability and connectivity.
Instead the Balance Hypothesis predicts that HGT upsets the stoichiometric balance of protein
complexes, and that the probability of stoichiometric upset increases with the connectivity.
Although our data do not support this prediction in terms of protein-protein connectivity, we do
see a negative relationship between regulatory connectivity and HGT fitness. This means that
the more complex a gene’s protein-protein interactions, the more robust that gene becomes to
over-expression, but the more complex a gene’s regulatory interactions, the more sensitive it is
to over-expression. This observation may suggest that balanced gene expression maybe be
more important for maintaining proper gene regulation than it is for maintaining proper
protein-protein interactions.
Although our analysis captures two of the biological factors important to successful
HGT—protein connectivity and gene function—these factors explain only a part of the total
variance in gene survival in our experiment. The high unexplained variance in survival suggests
that ecology, i.e. fit to the LB broth environment, had a large impact on gene survival in this
for the unexpected frequency trajectories of genes that declined in frequency between days 1 and 3, but increased in frequency between days 3 and 5 (Figure 2.2A, upper left quadrant). These observations emphasize the need for conducting similar experiments in a broad array of
REFERENCES
Agarwal, S., Deane, C.M., Porter, M.A., Jones, N.S., 2010. Revisiting Date and Party Hubs: Novel Approaches to Role Assignment in Protein Interaction Networks. PLoS Comput Biol 6, e1000817. doi:10.1371/journal.pcbi.1000817
Baltrus, D.A., Nishimura, M.T., Romanchuk, A., Chang, J.H., Mukhtar, M.S., Cherkis, K., Roach, J., Grant, S.R., Jones, C.D., Dangl, J.L., 2011. Dynamic evolution of pathogenicity revealed by sequencing and comparative genomics of 19 Pseudomonas syringae isolates. PLoS Pathog. 7, e1002132. doi:10.1371/journal.ppat.1002132
Barabási, A.-L., Oltvai, Z.N., 2004. Network biology: understanding the cell’s functional organization. Nat. Rev. Genet. 5, 101–113. doi:10.1038/nrg1272
Barve, A., Wagner, A., 2013. A latent capacity for evolutionary innovation through exaptation in metabolic systems. Nature 500, 203–206. doi:10.1038/nature12301
Baryshnikova, A., Costanzo, M., Myers, C.L., Andrews, B., Boone, C., 2013. Genetic interaction networks: toward an understanding of heritability. Annu Rev Genomics Hum Genet 14, 111– 133. doi:10.1146/annurev-genom-082509-141730
Barzel, B., Barabási, A.-L., 2013. Universality in network dynamics. Nat Phys 9. doi:10.1038/nphys2741
Bergmiller, T., Ackermann, M., Silander, O.K., 2012. Patterns of evolutionary conservation of essential genes correlate with their compensability. PLoS Genet. 8, e1002803.
doi:10.1371/journal.pgen.1002803
Bragg, J.G., Wagner, A., 2009. Protein material costs: single atoms can make an evolutionary difference. Trends Genet. 25, 5–8. doi:10.1016/j.tig.2008.10.007
Breen, M.S., Kemena, C., Vlasov, P.K., Notredame, C., Kondrashov, F.A., 2012. Epistasis as the primary factor in molecular evolution. Nature 490, 535–538. doi:10.1038/nature11510
Bridges, C.B., 1916. Non-Disjunction as Proof of the Chromosome Theory of Heredity. Genetics 1, 1–52.
Case, R.J., Boucher, Y., 2011. Molecular musings in microbial ecology and evolution. Biol. Direct 6, 58. doi:10.1186/1745-6150-6-58
Cohen, O., Gophna, U., Pupko, T., 2011. The complexity hypothesis revisited: connectivity rather than function constitutes a barrier to horizontal gene transfer. Mol. Biol. Evol. 28, 1481–1489. doi:10.1093/molbev/msq333
Costanzo, M., Baryshnikova, A., Bellay, J., Kim, Y., Spear, E.D., Sevier, C.S., Ding, H., Koh, J.L.Y., Toufighi, K., Mostafavi, S., Prinz, J., St Onge, R.P., VanderSluis, B., Makhnevych, T., Vizeacoumar, F.J., Alizadeh, S., Bahr, S., Brost, R.L., Chen, Y., Cokol, M., Deshpande, R., Li, Z., Lin, Z.-Y., Liang, W., Marback, M., Paw, J., San Luis, B.-J., Shuteriqi, E., Tong, A.H.Y., van Dyk, N., Wallace, I.M., Whitney, J.A., Weirauch, M.T., Zhong, G., Zhu, H., Houry, W.A., Brudno, M., Ragibizadeh, S., Papp, B., Pál, C., Roth, F.P., Giaever, G., Nislow, C.,
Troyanskaya, O.G., Bussey, H., Bader, G.D., Gingras, A.-C., Morris, Q.D., Kim, P.M., Kaiser, C.A., Myers, C.L., Andrews, B.J., Boone, C., 2010. The genetic landscape of a cell. Science 327, 425–431. doi:10.1126/science.1180823
Croucher, N.J., Harris, S.R., Grad, Y.H., Hanage, W.P., 2013a. Bacterial genomes in epidemiology--present and future. Philos. Trans. R. Soc. Lond., B, Biol. Sci. 368, 20120202.
doi:10.1098/rstb.2012.0202
Croucher, N.J., Harris, S.R., Grad, Y.H., Hanage, W.P., 2013b. Bacterial genomes in epidemiology--present and future. Philos. Trans. R. Soc. Lond., B, Biol. Sci. 368, 20120202.
doi:10.1098/rstb.2012.0202
Dahlberg, C., Chao, L., 2003a. Amelioration of the cost of conjugative plasmid carriage in Eschericha coli K12. Genetics 165, 1641–1649.
Dahlberg, C., Chao, L., 2003b. Amelioration of the cost of conjugative plasmid carriage in Eschericha coli K12. Genetics 165, 1641–1649.
Darling, A.E., Miklós, I., Ragan, M.A., 2008. Dynamics of genome rearrangement in bacterial populations. PLoS Genet. 4, e1000128. doi:10.1371/journal.pgen.1000128
Diaz Ricci, J.C., Hernández, M.E., 2000. Plasmid effects on Escherichia coli metabolism. Crit. Rev. Biotechnol. 20, 79–108. doi:10.1080/07388550008984167
Doolittle, W.F., 1999. Lateral genomics. Trends Cell Biol. 9, M5–8.
Drummond, D.A., Wilke, C.O., 2009. The evolutionary consequences of erroneous protein synthesis. Nat. Rev. Genet. 10, 715–724. doi:10.1038/nrg2662
Dykhuizen, D.E., Dean, A.M., Hartl, D.L., 1987. Metabolic flux and fitness. Genetics 115, 25–31.
Ge, F., Wang, L.-S., Kim, J., 2005. The Cobweb of Life Revealed by Genome-Scale Estimates of Horizontal Gene Transfer. PLoS Biol 3, e316. doi:10.1371/journal.pbio.0030316
Geiler-Samerotte, K.A., Dion, M.F., Budnik, B.A., Wang, S.M., Hartl, D.L., Drummond, D.A., 2011. Misfolded proteins impose a dosage-dependent fitness cost and trigger a cytosolic unfolded protein response in yeast. Proc. Natl. Acad. Sci. U.S.A. 108, 680–685.
doi:10.1073/pnas.1017570108
Gelperin, D.M., White, M.A., Wilkinson, M.L., Kon, Y., Kung, L.A., Wise, K.J., Lopez-Hoyo, N., Jiang, L., Piccirillo, S., Yu, H., Gerstein, M., Dumont, M.E., Phizicky, E.M., Snyder, M., Grayhack, E.J., 2005. Biochemical and genetic analysis of the yeast proteome with a movable ORF collection. Genes Dev. 19, 2816–2826. doi:10.1101/gad.1362105
Gilbert, C., Schaack, S., Feschotte, C., 2010. [Mobile elements jump between parasites and vertebrate hosts]. Med Sci (Paris) 26, 1025–1027. doi:10.1051/medsci/201026121025
Gogarten, J.P., Doolittle, W.F., Lawrence, J.G., 2002. Prokaryotic evolution in light of gene transfer. Mol. Biol. Evol. 19, 2226–2238.
Gogarten, J.P., Townsend, J.P., 2005. Horizontal gene transfer, genome innovation and evolution. Nat. Rev. Microbiol. 3, 679–687. doi:10.1038/nrmicro1204
Gout, J.-F., Kahn, D., Duret, L., Paramecium Post-Genomics Consortium, 2010. The relationship among gene expression, the evolution of gene dosage, and the rate of protein evolution. PLoS Genet. 6, e1000944. doi:10.1371/journal.pgen.1000944
Guttman, D.S., 1997. Recombination and clonality in natural populations of Escherichia coli. Trends Ecol. Evol. (Amst.) 12, 16–22.
Guttman, D.S., Dykhuizen, D.E., 1994. Detecting selective sweeps in naturally occurring Escherichia coli. Genetics 138, 993–1003.
Han, J.-D.J., Bertin, N., Hao, T., Goldberg, D.S., Berriz, G.F., Zhang, L.V., Dupuy, D., Walhout, A.J.M., Cusick, M.E., Roth, F.P., Vidal, M., 2004. Evidence for dynamically organized modularity in the yeast protein-protein interaction network. Nature 430, 88–93.
doi:10.1038/nature02555
Hanage, W.P., 2013. Fuzzy species revisited. BMC Biol. 11, 41. doi:10.1186/1741-7007-11-41
Hao, W., Golding, G.B., 2008a. Uncovering rate variation of lateral gene transfer during bacterial genome evolution. BMC Genomics 9, 235. doi:10.1186/1471-2164-9-235
Harrison, E., Brockhurst, M.A., 2012. Plasmid-mediated horizontal gene transfer is a coevolutionary process. Trends Microbiol. 20, 262–267. doi:10.1016/j.tim.2012.04.003
Intrieri, M.C., Buiatti, M., 2001. The horizontal transfer of Agrobacterium rhizogenes genes and the evolution of the genus Nicotiana. Mol. Phylogenet. Evol. 20, 100–110.
doi:10.1006/mpev.2001.0927
Jain, R., Rivera, M.C., Lake, J.A., 1999. Horizontal gene transfer among genomes: the complexity hypothesis. Proc. Natl. Acad. Sci. U.S.A. 96, 3801–3806.
Jain, R., Rivera, M.C., Moore, J.E., Lake, J.A., 2002a. Horizontal gene transfer in microbial genome evolution. Theor Popul Biol 61, 489–495.
Jain, R., Rivera, M.C., Moore, J.E., Lake, J.A., 2002b. Horizontal gene transfer in microbial genome evolution. Theor Popul Biol 61, 489–495.
Karev, G.P., Wolf, Y.I., Rzhetsky, A.Y., Berezovskaya, F.S., Koonin, E.V., 2002. Birth and death of protein domains: a simple model of evolution explains power law behavior. BMC Evol. Biol. 2, 18.
Kitagawa, M., Ara, T., Arifuzzaman, M., Ioka-Nakamichi, T., Inamoto, E., Toyonaga, H., Mori, H., 2005. Complete set of ORF clones of Escherichia coli ASKA library (a complete set of E. coli K-12 ORF archive): unique resources for biological research. DNA Res. 12, 291–299.
doi:10.1093/dnares/dsi012
Lawrence, J.G., 1999. Gene transfer, speciation, and the evolution of bacterial genomes. Curr. Opin. Microbiol. 2, 519–523.
Lercher, M.J., Pál, C., 2008. Integration of horizontally transferred genes into regulatory interaction networks takes many million years. Mol. Biol. Evol. 25, 559–567. doi:10.1093/molbev/msm283
Li, H., Handsaker, B., Wysoker, A., Fennell, T., Ruan, J., Homer, N., Marth, G., Abecasis, G., Durbin, R., 1000 Genome Project Data Processing Subgroup, 2009. The Sequence Alignment/Map format and SAMtools. Bioinformatics 25, 2078–2079.
doi:10.1093/bioinformatics/btp352
Liu, L.-M., Liu, N., Liu, Z., Yu, Z.-J., Xu, S.-Q., Yang, X.-H., Li, T., Li, S.-S., Guo, L.-D., Liu, J.-Z., 2013. Microbial communities and symbionts in the hard tick Haemaphysalis longicornis (Acari: Ixodidae) from north China. Parasit Vectors 6, 310. doi:10.1186/1756-3305-6-310
Moran, N.A., Jarvik, T., 2010. Lateral transfer of genes from fungi underlies carotenoid production in aphids. Science 328, 624–627. doi:10.1126/science.1187113
Nakamura, K., Haruta, S., Ueno, S., Ishii, M., Yokota, A., Igarashi, Y., 2004. Cerasibacillus quisquiliarum gen. nov., sp. nov., isolated from a semi-continuous decomposing system of kitchen refuse. Int. J. Syst. Evol. Microbiol. 54, 1063–1069. doi:10.1099/ijs.0.02883-0
Omer, S., Kovacs, A., Mazor, Y., Gophna, U., 2010. Integration of a foreign gene into a native complex does not impair fitness in an experimental model of lateral gene transfer. Mol. Biol. Evol. 27, 2441–2445. doi:10.1093/molbev/msq145
Pál, C., Papp, B., Lercher, M.J., 2005. Adaptive evolution of bacterial metabolic networks by horizontal gene transfer. Nat. Genet. 37, 1372–1375. doi:10.1038/ng1686
Papp, B., Pál, C., Hurst, L.D., 2003. Dosage sensitivity and the evolution of gene families in yeast. Nature 424, 194–197. doi:10.1038/nature01771
Park, C., Zhang, J., 2012. High expression hampers horizontal gene transfer. Genome Biol Evol 4, 523–532. doi:10.1093/gbe/evs030
Pennisi, E., 2004. Microbiology. Researchers trade insights about gene swapping. Science 305, 334– 335. doi:10.1126/science.305.5682.334
Qian, W., Zhang, J., 2008. Gene dosage and gene duplicability. Genetics 179, 2319–2324. doi:10.1534/genetics.108.090936
Rivera, M.C., Jain, R., Moore, J.E., Lake, J.A., 1998. Genomic evidence for two functionally distinct gene classes. Proc. Natl. Acad. Sci. U.S.A. 95, 6239–6244.
Schaack, S., Gilbert, C., Feschotte, C., 2010. Promiscuous DNA: horizontal transfer of transposable elements and why it matters for eukaryotic evolution. Trends Ecol. Evol. (Amst.) 25, 537–546. doi:10.1016/j.tree.2010.06.001
Sicheritz-Pontén, T., Andersson, S.G., 2001. A phylogenomic approach to microbial evolution. Nucleic Acids Res. 29, 545–552.
Skippington, E., Ragan, M.A., 2011. Lateral genetic transfer and the construction of genetic exchange communities. FEMS Microbiol. Rev. 35, 707–735. doi:10.1111/j.1574-6976.2010.00261.x
Sorek, R., Zhu, Y., Creevey, C.J., Francino, M.P., Bork, P., Rubin, E.M., 2007. Genome-wide experimental determination of barriers to horizontal gene transfer. Science 318, 1449–1452. doi:10.1126/science.1147112
Travisano, M., Mongold, J.A., Bennett, A.F., Lenski, R.E., 1995a. Experimental tests of the roles of adaptation, chance, and history in evolution. Science 267, 87–90.
Travisano, M., Mongold, J.A., Bennett, A.F., Lenski, R.E., 1995b. Experimental tests of the roles of adaptation, chance, and history in evolution. Science 267, 87–90.
Travisano, M., Mongold, J.A., Bennett, A.F., Lenski, R.E., 1995c. Experimental tests of the roles of adaptation, chance, and history in evolution. Science 267, 87–90.
Treangen, T.J., Rocha, E.P.C., 2011. Horizontal Transfer, Not Duplication, Drives the Expansion of Protein Families in Prokaryotes. PLoS Genet 7, e1001284. doi:10.1371/journal.pgen.1001284 Tuller, T., Veksler-Lublinsky, I., Gazit, N., Kupiec, M., Ruppin, E., Ziv-Ukelson, M., 2011.
Composite effects of gene determinants on the translation speed and density of ribosomes. Genome Biol. 12, R110. doi:10.1186/gb-2011-12-11-r110
Wellner, A., Gophna, U., 2008. Neutrality of foreign complex subunits in an experimental model of lateral gene transfer. Mol. Biol. Evol. 25, 1835–1840. doi:10.1093/molbev/msn131
Wellner, A., Lurie, M.N., Gophna, U., 2007. Complexity, connectivity, and duplicability as barriers to lateral gene transfer. Genome Biol. 8, R156. doi:10.1186/gb-2007-8-8-r156