FATE OF CONTAMINANTS OF EMERGING ENVIRONMENTAL CONCERN (CEECS) DURING DRINKING WATER TREATMENT PROCESSES
Yi Liu
A thesis submitted to the faculty of the University of North Carolina at Chapel Hill in partial fulfillment of the requirements for the degree of Master of Science in the
Department of Environmental Sciences and Engineering.
Chapel Hill 2013
Approved by:
ii ©2013 Yi Liu
iii ABSTRACT
Yi Liu: Fate of Contaminants of Emerging Environmental Concern (CEECs) During Drinking Water Treatment Processes
(Under the direction of Howard S. Weinberg)
iv
ACKNOWLEDGEMENTS
I would like to thank Dr. Howard Weinberg for his guidance and teaching during my time at UNC. I am grateful for his willingness to accompany through difficult times. I would like to also thank my committee members Dr. Steve Whalen and Dr. Michael Aitken for their participation and input in the completion of this research project. Thanks to Dr. Detlef Knappe for providing information on experimental protocols.
I would like to thank the members of the Weinberg research group for their support, friendship and input. In particular thanks to Breann Holmes for her help during SPE extraction and LC-MS analysis and Ariel Atkinson for providing her expertise and help in TOX analysis.
I would like to thank the individuals from the OWASA drinking water plant, Rachel Monschein and Dusty Martin for providing information to help with data analysis.
v
TABLE OF CONTENTS
LIST OF TABLES ... viii
LIST OF FIGURES ... x
1. INTRODUCTION ... 1
1.1 Contaminants of Emerging Environmental Concern (CEECs) ... 2
1.2 Pathway of Entry into Drinking Water ... 3
1.3 Fate of CEECs in the Environment ... 6
1.4 Analytical Methods ... 11
1.5 Occurrence in Aquatic Environments ... 13
1.6 Fate of CEECs in Drinking Water Treatment ... 16
1.6.1 Chemical Coagulation ... 17
1.6.2 Powdered Activated Carbon (PAC) ... 19
1.6.3 Disinfection ... 20
1.7 Identification of By-products ... 26
1.8 Policy and Regulation ... 30
1.9 Research Question ... 32
1.10 Research Objectives ... 33
2. MATERIALS AND METHODS ... 35
vi
2.2 Methods ... 41
2.2.1 Solid Phase Extraction ... 41
2.2.2 Analytical Methods ... 44
2.2.3 Bench Scale Coagulation Experiment ... 52
2.2.4 Bench Scale PAC Experiment ... 55
2.2.5 Chlorination and UV Byproduct Identification ... 56
2.2.6 Chlorination of Tetracycline Experiment ... 58
2.2.7 Comparison of Chlorination and Chloramination of Tetracycline ... 59
3. RESULTS AND DISCUSSION ... 61
3.1 Solid Phase Extraction Recovery (SPE) ... 61
3.2 Coagulation for Removal of CEECs from Surface Water ... 65
3.3 CEEC Removal from Surface Water by Powdered Activated Carbon (PAC) ... 70
3.4 Chlorination and UV Treatment Byproducts ... 73
3.4.1 Chlorination Byproducts ... 73
3.4.2 UV Byproducts ... 82
3.5 Tetracycline Case Study ... 89
4. CONCLUSIONS ... 98
vii
viii
LIST OF TABLES
Table 1.1: Occurrence, concentration and toxicity of commonly found
CEECs in 139 US streams (Kolpin et al. 2002). ... 4
Table 1.2: Physical and chemical properties of CEECs. ... 8
Table 1.3: Occurrence of CEECs in environmental matrices. ... 14
Table 1.4: Electrophilic aromatic substitution- effect of substituents (Brown et al. 2005). ... 22
Table 1.5: Transformation products of CEECs from reaction with free chlorine and their identified toxicity activity. ... 28
Table 1.6: Transformation products of CEECs from reaction with UV treatment and their identified toxicity activity. ... 29
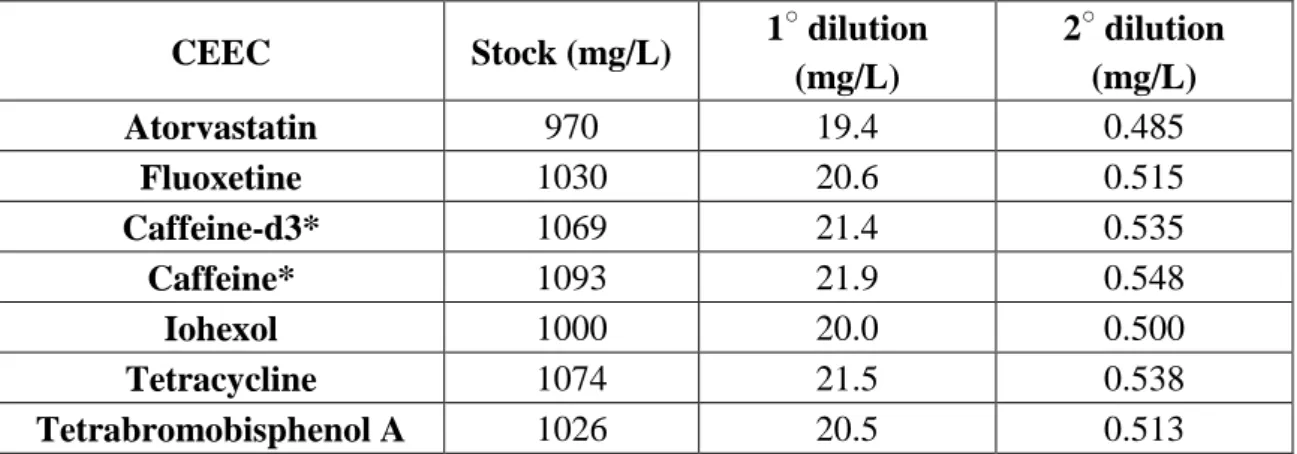
Table 2.1: An example of CEEC solution concentrations used in this study. ... 42
Table 2.2: Typical CEEC concentrations used for standard addition quantification. ... 42
Table 2.3: Mobile phase program used for LC-(+/-)-ESI-MS/MS (flow rate: 0.2mL/min) ... 45
Table 2.4: Source dependent mass spectrometer parameters ... 46
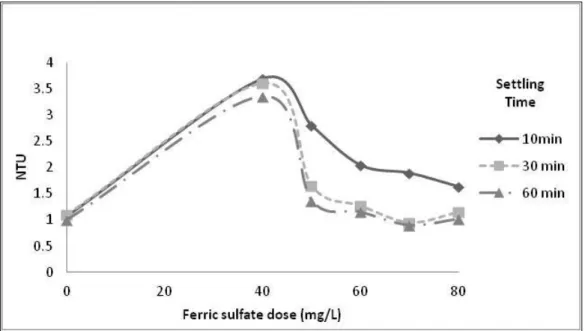
Table 2.5: Parameters for CEEC analysis the study ... 46
Table 2.6: Temperature program for GC-ECD ... 49
Table 2.7: Coagulant concentration and stock added ... 54
Table 2.8: Chlorination dose for each 10mg/L CEEC reaction ... 57
Table 3.1: Effect of raw water extract on signal response calculated by area and ion count (comparing 1mg/L standard and 1mg/L extract spike). ... 63
ix
Table 3.3: First order kinetic rate (M L-1 s-1) of adsorption of CEECs by PAC. ... 72 Table 3.4: Ions found in the chlorine-treated CEEC solution (* indicates ions that are present in the untreated sample, ions in bold may contain
chlorine) ... 75 Table 3.5: Ions found in CEEC solution in LGW ... 78 Table 3.6: Relative intensities (highest ion count set to 100%) of isotopes for up to 3 chlorine atoms in an ion (Glagovich 2007) ... 79 Table 3.7: Ions found in UV-treated sample CEEC solution (* ions that are present in CEEC standard) ... 84 Table 3.8: Molar absorptivity of CEECs (10mg/L) at their λmax . ... 86 Table 3.9: Rate constants (Msec-1) for the formation of chloroform from chlorination of tetracycline at pH 7 and 9. ... 96 Table 3.10: Rate constants (Msec-1) for the formation of TOX from
chlorination of tetracycline at pH 7 and 9. ... 97 Table B-1: LC-MS/MS ion count response for CEECs. RW = raw water, RWB = raw water spiked before filtering, RWA = raw water spiked after
filtering. ... 104 Table B-2: LC-MS/MS area response for CEECs. RW = raw water, RWB = raw water spiked before filtering, RWA = raw water spiked after
x
LIST OF FIGURES
Figure 1.1: Pathways of PPCPs into drinking water and the
environment (Bhandari 2008). ... 5
Figure 1.2: Fate of CEECs in the environment. ... 7
Figure 1.3: Generic electrophilic aromatic substitution with halogen (X) as the electrophile. ... 23
Figure 1.4: Structures of CEECs selected for this study. ... 33
Figure 2.1: Diagram of the MP-UV system. ... 52
Figure 3.1: Comparison of LC-MS/MS area response for each CEEC in the SPE extract (n=1). RW = raw water, RWB = raw water spiked before filtering, RWA = raw water spiked after filtering. ... 62
Figure 3.2: Comparison of LC-MS/MS ion count response for each CEEC in the SPE extract (n=1). RW = raw water, RWB = raw water spiked before filtering, RWA = raw water spiked after filtering. ... 63
Figure 3.3: OWASA surface water turbidity as a function of varying alum dose after different settling times. ... 66
Figure 3.4: OWASA surface water turbidity as a function of varying ferric sulfate dose after different settling times. ... 67
Figure 3.5: Comparison of CEEC concentration of quality control samples (250ng/L spike). ... 68
Figure 3.6: Comparison of concentration of CEEC before and after coagulation with alum and ferric sulfate. Error bars represent the difference in concentration of duplicate samples. ... 68
Figure 3.7: Removal of CEECs at PAC dose of 5mg/L over time. ... 71
Figure 3.8: Removal of CEECs at PAC dose of 10mg/L over time. ... 71
Figure 3.9: Removal of CEECs at PAC dose of 20mg/L over time. ... 72
xi
Figure 3.11: Possible structures of the chlorination byproducts of
caffeine at m/z, a)141.0, b)171.0 and c)86.0. ... 81 Figure 3.12: Possible structures of the chlorination byproducts of
fluoxetine at m/z, a)215.0 and b)148.2. ... 81 Figure 3.13: Possible structures of the chlorination byproducts of iohexol at m/z, a) 407.0, b)255.1, and c)175.0. ... 82 Figure 3.14: Spectrum of lamp output for MP UV. ... 86 Figure 3.15: Hypothesized structures of UV byproducts of atorvastatin at m/z, a) 438.4 and b) 513.2. ... 87 Figure 3.16: Hypothesized structures of UV byproducts of fluoxetine at m/z, a) 164.1 and b) 259.1. ... 88 Figure 3.17: Hypothesized structures of UV byproducts of iohexol at m/z, a) 149.0 and b) 91.9. ... 88 Figure 3.18: Absorbance spectrum of 10mg/L tetracycline in LGW, with λmax at 276nm and 356nm. ... 91 Figure 3.19: Absorbance spectrum of chlorinated tetracycline (10mg/L
tetracycline, 31.9mg/L chlorine), with λmax at 232nm. ... 91 Figure 3.20: Spectrum of product peak (chloroform) from GC-MS
analysis of chlorinated tetracycline. ... 92 Figure 3.21: Distribution of HOCl and OCl- with varying pH. ... 93 Figure 3.22: Comparison of the formation of chloroform over time by
chlorination of tetracycline with respect to pH. ... 93 Figure 3.23: Comparison of the formation of TOX by chlorination of tetracycline over time with respect to pH. ... 94 Figure 3.24: Comparison of TOX and chloroform formation from chlorination of
tetracycline at pH 7. ... 95 Figure 3.25: Comparison of TOX and chloroform formation from
chlorination of tetracycline at pH 9 ... 95 Figure B-1: Comparison of LC-MS/MS relative area response for SPE
xii
LIST OF ABBREVIATIONS
1
H NMR Proton Nuclear Magnetic Resonance
ACS American Chemical Society
AR Analytical Reagent
BPA Bisphenol A
CCL Contaminant Candidate List
CEEC Contaminants of Emerging Environmental Concern
CFC Chlorofluorocarbon
DBPs Disinfection Byproducts
DOC Dissolved Organic Carbon
DOM Dissolved Organic Matter
DPD N,N-Diethyl-p-phenylenediamine
DWS Drinking Water Strategy
DWTP Drinking Water Treatment Plant
ECD Electron Capture Detector
EDC Endocrine Disrupting Compound
ESI Electro Spray Ionization
FDA Food and Drug Administration
FOC Fluorinated Organic Chemical
GAC Granular Activated Carbon
xiii
GC-MS Gas Chromatography Mass Spectrometry
HAA Haloacetic Acid
HAN Haloacetonitrile
HCB Hexachlorobenzene
HPLC High Pressure Liquid Chromatography
I.D. Inner Diameter
ICM Iodinated X-ray Contrast Agent
Kow Octanol-Water Partitioning Coefficient
LC Liquid Chromatography
LC50 Median Lethal Dose
LC-MS/MS Liquid Chromatography Tandem Mass Spectrometry
LGW Laboratory Grade Water
LP-UV Low Pressure Ultra Violet
MALDI Matrix-Assisted Laser Desorption Ionization
MCL Maximum Contaminant Level
MCLG Maximum Contaminant Level Goal
MP-UV Medium Pressure Ultra Violet Light
MS Mass Spectrometry
MS/MS Tandem Mass Spectrometry
MtBE Methyl tert-butylether
xiv
NCI Negative Chemical Ionization
NMR Nuclear Magnetic Resonance
NOM Natural Organic Matter
NPDWR National Primary Drinking Water Regulation
NSDWR National Secondary Drinking Water Regulation
OWASA Orange Water and Sewer Authority
PAC Powdered Activated Carbon
PB Particle Beam
PBDE Polybrominated Diphenyl Ether
PCCL Preliminary Contaminant Candidate List
PFC Perfluorinated Compounds
PFOA Perfluorooctanoic Acid
pKa Acidity Constant
POP Persistent Organic Pollutants
POU Point of Use
PPA Pollution Prevention Act
PPCP Pharmaceutical and Personal Care Product
PPG Poly-propylene Glycol
QTOF Quadrupole Time-of-Flight
SDWA Safe Drinking Water Act
xv
SPE Solid Phase Extraction
TBBPA Tetrabromobisphenol A
THM Trihalomethane
TOC Total Organic Carbon
TOX Total Organic Halogen
TSCA Toxic Substance Control Act
U.S. EPA U.S. Environmental Protection Agency
UHP Ultra High Purity
UNC University of North Carolina Chapel Hill
USGS U.S. Geological Survey
USP United States Pharmacopeial
UV Ultra Violet Light
UV-Vis Ultraviolet-Visible Light Spectroscopy
v/v Volume to Volume
1. INTRODUCTION
2
(Xu et al. 2012; Duirk et al. 2011; Lam et al. 2005; Vanderford et al. 2008; Eriksson et al. 2004; Bedner & MacCrehan 2006a; Bedner & MacCrehan 2006b). If such chemicals, their metabolites or transformation products are present in drinking water, chronic daily consumption might pose human health concerns and draw attention to how best to reduce such exposure. Clearly, the subject of fate and transport of chemicals of anthropogenic origin in natural waters and their effects on human and ecological health is still in its infancy and much remains unknown.
1.1 Contaminants of Emerging Environmental Concern (CEECs)
3 1.2 Pathway of Entry into Drinking Water
4
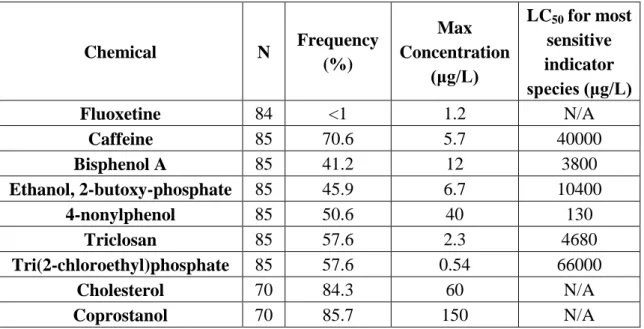
occurrence of some CEECs in this survey raises concerns especially since some of these waters are the drinking water sources of many cities. A median lethal concentration (LC50) is the exposure dose of chemical to a living cell (species) in which half of the cells die and is used to compare the toxicity of chemicals. The lower the LC50, the more toxic a substance is. The indicator species referred to in Table 1.1 differed according to the chemical tested so as to measure the LC50 for the most sensitive cells. Some CEECs have LC50 values in the μg/L or ng/L range which are the occurrence levels in some surface waters and could pose a threat to human health.
Table 1.1: Occurrence, concentration and toxicity of commonly found CEECs in 139 US streams (Kolpin et al. 2002).
Chemical N Frequency
(%)
Max Concentration
(μg/L)
LC50 for most
sensitive indicator species (μg/L)
Fluoxetine 84 <1 1.2 N/A
Caffeine 85 70.6 5.7 40000
Bisphenol A 85 41.2 12 3800
Ethanol, 2-butoxy-phosphate 85 45.9 6.7 10400
4-nonylphenol 85 50.6 40 130
Triclosan 85 57.6 2.3 4680
Tri(2-chloroethyl)phosphate 85 57.6 0.54 66000
Cholesterol 70 84.3 60 N/A
Coprostanol 70 85.7 150 N/A
LC50: median lethal concentration N: number of samples
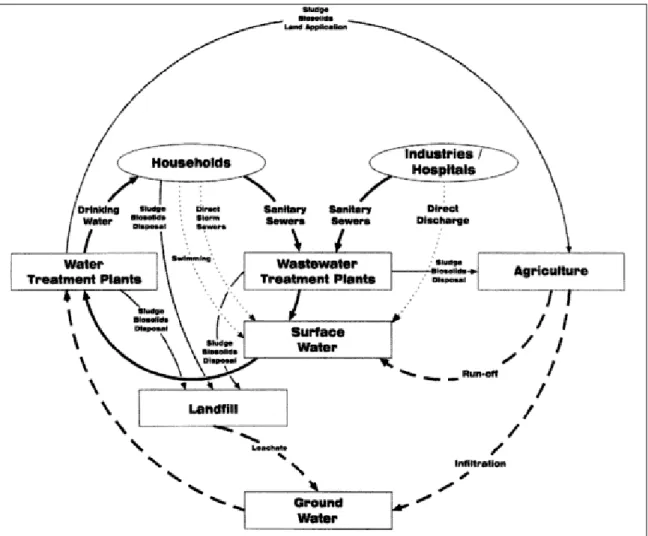
5
Figure 1.1: Pathways of PPCPs into drinking water and the environment (Bhandari 2008).
6
animals, and are persistent in the environment (Ritter et al. 2011). FOCs have been detected in the air at land and sea all over the Atlantic and Southern Oceans, even in the polar regions (Dreyer et al. 2009), and in many animals (Tomy et al. 2009; Holmström & Berger 2008; Tao et al. 2006). FOCs are known carcinogens, endocrine disrupters, and liver toxicants and cause developmental and reproductive problems (Maras et al. 2006; Martin et al. 2007; Abbott et al. 2007; Lau et al. 2003). FOCs include chlorofluorocarbons (CFCs), which have ozone depletion potential (Molina & Rowland 1974). It is important to understand whether FOCs along with other CEECs detected in drinking water sources can be eliminated by natural or conventional treatment processes or require new treatment processes to remove them.
1.3 Fate of CEECs in the Environment
7 Figure 1.2: Fate of CEECs in the environment.
Log Kow describes the affinity of a compound for the organic (octanol) or aqueous (water) phase when both are present and can assist in predicting whether a chemical will migrate out of water or attach to soil or sediments over which natural water flows. The higher the Log Kow, the more likely a compound is to attach or adsorb onto soil and sediment. Brominated flame retardants have high log Kow values and are, therefore, likely to adsorb onto soil and sediment (De Wit 2002), and be available for biodegradation or uptake by plants. For example, tetrabromobisphenol A (TBBPA) and polybrominated diphenyl ethers (PBDEs) are found at levels 5500 fold higher in the sediment phase compared to the water phase (Labadie et al. 2010). The same reasoning can be applied to CEECs with low log Kow values such as bupropion (anti-depressant, log Kow = 1.54) which is found in water but not in sediment (Schultz et al. 2010).
8
prefer the aqueous phase. Natural waters usually have a pH in the 6-8 range and therefore, compounds such as fluoxetine, iohexol, and TBBPA with a pKa higher than this will be in the protonated state and exist as a neutral species while compounds such as atorvastatin with a pKa lower than the aqueous pH will be in the deprotonated state and exist as a charged species. In summary, the two highlighted physiochemical properties suggest that CEECs with high log Kow and pKa values will be more likely to sorb onto soils and sediment and be removed during wastewater treatment while those with low values are more likely to persist in the aquatic environment (Löffler et al. 2005). Table 1.2 shows the values of log Kow and pKa for some CEECs.
Table 1.2: Physical and chemical properties of CEECs. Compound
(Trade Name) Category
Molecular
Weight Log Kow
1
pKa2
Atorvastatin (Lipitor®)
Fluorinated
pharmaceutical 558.6 3.76 4.46
Caffeine Stimulant 194.2 -0.07 6.11
Fluoxetine (Prozac®)
Fluorinated
pharmaceutical 309.3 4.57 10.1
Iohexol X-ray contrast
agent 821.1 -3.08 11.4
TBBPA Flame
retardant 543.9 5.20 9.40
3
Tetracycline Antibiotic 444.4 -1.39 3.304 7.684 9.694 1
http://logkow.cisti.nrc.ca/logkow/search.html 2
(Bhandari 2008) 3
(Lezotte & Nixon 2001) 4
9
Degradation of CEECs in the environment can occur through mechanisms that include photodegradation and hydrolysis in water, biodegradation in soil and sediments, and reaction with other chemicals in both matrices.
Photodegradation
10 Hydrolysis
Hydrolysis is the breakdown of a compound by its reaction with water whose rate depends on the compound structure and conditions, such as pH, temperature, ionic strength and composition (Mabey & Mill 1978). Eight pharmaceuticals including atorvastatin, caffeine, acetaminophen, carbamazepine, levofloxacin, sertraline, sulfamethoxazole, and trimethoprim were determined to not be affected by hydrolysis in a controlled experiment (Lam et al. 2004). However, other CEECs such as oxytetracycline are affected and pH and temperature were found to have an influence on the rate (Xuan et al. 2010).
Biodegradation
11
the antibiotics, indicating potential persistence of non-targeted CEEC degradates in surface and possibly drinking water with a lingering biological activity.
1.4 Analytical Methods
The accurate determination of CEEC concentration is important for evaluating their presence in the environment and whether or not they are of concern to human and environmental health. With a wide range of physical and chemical properties, methods developed for CEECs are aimed at clusters such as those with similar polarities but different masses. The mass of a compound and its daughter ions can be determined through tandem mass spectrometry (MS/MS), which is the most commonly used detection technique for CEECs in the environment. Since each chemical has different daughter ions due to the difference in their structures, MS/MS is very useful in identifying the compound of interest. Usually, separation of chemicals in a mixture based on their different physiochemical characteristics proceeds analysis on MS/MS through the use of liquid or gas chromatography (LC or GC). Due to the high boiling points of most CEECs, LC-MS/MS is more widely used.
12
13 1.5 Occurrence in Aquatic Environments
Occurrences of many CEECs in natural water, wastewater sources, and effluents have been reported in many studies (Barclay et al. 2012; Halden 2010; Kaplan 2011; Kormos et al. 2011; Labadie et al. 2010; Langford & Thomas 2009; Lee et al. 2009; Pérez & Barceló 2007; Schultz et al. 2010) (Table 1.3). These pollutants are present often at close to or below detection limits of the existing analytical methods, yet low level chronic exposure effects on human and ecological health are not very well understood. These gaps in our knowledge raise concerns over the fate of CEECs in drinking water treatment and whether they would be present in finished drinking water.
14
Table 1.3: Occurrence of CEECs in environmental matrices.
Compound Name Sample Media Concentration Reference
Atorvastatin (Lipitor®)
WWTP influent 22-263ng/L
(Lee et al. 2009) WWTP effluent 10-122ng/L
Drinking water
source 0.80-1.4ng/L (Benotti et al. 2009)
Drinking water ND
Fluoxetine (Prozac®)
River water 1.6-43.2ng/L
(Schultz et al. 2010) Sediment 0.39-19.37ng/g
Fish brains 0.293-1.648ng/g
Caffeine
WWTP influent 54-120μg/L (Stackelberg et al. 2007) WWTP effluent 0-50ng/L
Drinking water 0.015μg/L
(Yang et al. 2011)
Streams 0-0.19μg/L
Iohexol
WWTP influent 3.3-20μg/L
(Kormos et al. 2011) WWTP effluent 1.1-1.3μg/L
River water 13-69ng/L Drinking water 0-5ng/L Riverbank wells >3ng/L
Tetracycline
Stream 0-0.11μg/L (Kolpin et al. 2002) WWTP primary
effluent 68-310ng/L (Yang et al. 2011) WWTP effluent <10ng/L
Tetrabromobisphenol A
River water 0-64pg/L (Labadie et al. 2010) Sediment 65-28 pg/g
Wastewater 0.013-0.03 μg/L
(Zhao et al. 2010) Drinking water >0.01-0.02μg/L
ND=Not detected
15
including groundwater, water bodies with or without input from WWTPs and water bodies that allow or do not allow recreational activity. Out of the 51 chemicals, 34 were detected at least once, while 11 were detected more than half of the time. Every DWTP source water sample had at least one compound detected. Source waters that did not have WWTP or recreational use input recorded the lowest number of compounds detected. This survey demonstrated that a well-protected drinking water source had a lower occurrence of CEECs.
Yang et al. (2011) evaluated a wastewater reclamation plant in Gwinnett County, GA. This WWTP train includes a primary clarifier, aeration tanks, secondary clarifier, membrane filtration or granular media filter, granulated activated carbon (GAC) filter, and ozone contactor. Wastewater effluent was collected and analyzed for 19 pharmaceuticals for twelve months. Samples were also collected after unit treatments of primary clarifier (primary effluent), membrane filtration (membrane effluent), and GAC adsorption (GAC effluent). Caffeine was one of the CEECs found at the highest concentrations in the primary effluent (80,000ng/L) and was also found frequently in the final effluent (0-50ng/L). Tetracycline was found in the primary effluent at 160ng/L, but was below the detection limit of 10ng/L after microfiltration. This study showed that wastewater treatment is not always effective in removing all CEECs and some will be discharged into the aquatic environment.
16
(WWTP to surface water to ground water and drinking water) was evaluated for 4 iodinated x-ray contrast media (ICM) and 46 biotransformation products of these ICMs (Kormos et al. 2011). Samples were taken from WWTPs after different unit processes, the discharge river or river wells, and 4 at different points within DWTPs. There was an 80% ICM removal for conventional wastewater treatment but transformation products were detected in wastewater effluent, river water, river wells, and drinking water. The incomplete mass balance analysis of the ICMs and their transformation products suggests that there are many unidentified transformation products unaccounted for by the analytical methods employed.
1.6 Fate of CEECs in Drinking Water Treatment
17
chemicals during treatment difficult and often result in incomplete mass balances. Photolysis, hydrolysis and biodegradation were discussed in Section 1.3. Chemical reaction will be discussed later in this chapter. The transformation products are not well understood in either their structure or biological activity. Although some byproducts of a few CEECs such as acetaminophen and iohexol have been identified (Bedner & MacCrehan 2006b; Duirk et al. 2011), many remain unknown. Some of these byproducts have potential toxicity higher than the parent compounds. Therefore, the processes of drinking water treatment need to be investigated not only for the removal of the parent chemicals but following each chemical treatment process, the byproducts need to be identified together with their toxicity.
1.6.1 Chemical Coagulation
18
precipitation. Therefore, it is essential to use the optimal pH range for each coagulant which is 5.5 – 7.7 (aluminum sulfate) and 5 – 8.5 (ferric sulfate) (Crittenden 2005).
19 1.6.2 Powdered Activated Carbon (PAC)
PAC typically used for the removal of taste and odor producing compounds and low concentrations of organic micropollutants, including CEECs, can be used at different points in drinking water treatment before the filtration process. Although it can be easily added to treatment as a slurry or as dry powder, PAC is costly and, therefore, only used when needed. PAC acts through adsorption of organic pollutants via Van der Waals forces. Addition of PAC during coagulation enhances their removal during sedimentation, demonstrated by the increase in removal of tetracycline from ~75% to 100% during coagulation when PAC was added prior to filtration (Knappe et al. 2012). This increases the quality of the water before filtration, thereby preserving the filter efficacy and lifetime.
20
superfine particles resulting in a much higher and more rapid removal of sulfamethoxazole (> 60%) and trimethoprim (100%) than when used in its commercially available form.
1.6.3 Disinfection
21
haloacetic acids (HAAs), and haloacetonitriles (HANs) among others (Duirk et al. 2011; Xu et al. 2012; Wang et al. 2011), chloramination has been used as a replacement because lower concentrations are produced (Hua & Reckhow 2007) and the water can be in compliance with the current DBP regulations.
Chlorination
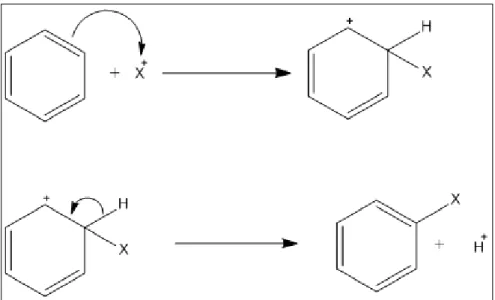
Free chlorine is usually produced from liquid sodium hypochlorite (NaOCl) solution, which reacts with water to produce the oxidants OCl- and HOCl (Equation 1 and 2), with HOCl being the stronger disinfectant species. A certain contact time is needed for effective inactivation or death of pathogens partially due to the chlorine demand of the water, which needs to be met before a residual can occur. Chlorine reacts with ammonia to form combined chlorine, which includes mono-, di-, and trichloramine. This reaction has been studied extensively and includes the breakpoint phenomenon in which for every one mole of ammonia as ammonium-N, 1.5 moles of free chlorine as Cl2 is needed after which any additional chlorine added is available for disinfection (White 1999).
(pKa = 7.5)
22
produce DBPs upon reaction with chlorine (Pinkston & Sedlak 2004; Bedner & MacCrehan 2006a; Wang et al. 2011; Xu et al. 2012). Chlorine acts as an electrophile and attacks areas on the molecules that are rich in electron density, which include aromatic rings with extended π conjugation and found in many CEECs that can act as nucleophiles and react with chlorine through electrophilic aromatic substitution. The substituents on the benzene ring affect its reactivity through activation or deactivation of the ring for electrophilic attack, as well as the position of the electrophile attack on the substituted benzene ring (Table 1.4). Steric hindrance does not usually affect electrophilic attacks unless the electrophile is large, in which case attack at the para position would be favored over the ortho position, but in the case of chlorine this is not an issue. Steric hindrance of the substituents on the benzene ring does, however, affect reactivity. For example caffeine, which has many substituents on the aromatic ring, will not be as reactive as atorvastatin which has few substituents on the aromatic rings. Figure 1.3 shows a typical electrophilic aromatic substitution with halogen.
Table 1.4: Electrophilic aromatic substitution- effect of substituents (Brown et al. 2005). Substituent Reactivity Directing Orientation -NH2, -NHR, -NR2,
-OH, -OR Strongly activating Ortho, Para -NHCOR, -NHCOAr,
-OCOR, -OCOAr Moderately activating Ortho, Para -R, -C6H6 Weakly activating Ortho, Para
-F, -Cl, -Br, -I Weakly deactivating Ortho, Para -COH, -COR, -COOH,
-COOR, -CONH2,
-SOOOH, -CN
Moderately deactivating Meta
-NO2, -NH3, -CF3,
-CCl3
23
Figure 1.3: Generic electrophilic aromatic substitution with halogen (X) as the electrophile.
24
product identified (Bedner & MacCrehan 2006a). The kinetics and reactivity of these reactions are pH dependent due to the speciation of free chlorine as HOCl and OCl -defined by the pKa value and for some CEECs their multiple speciations (e.g. tetracycline has 3 pKa values).
Chloramination
Chloramines, or combined chlorine, are formed from reaction of chlorine with ammonia. Free chlorine reacts with ammonia to form mono-, di-, and trichloroamine (Equations 3, 4, 5). Monochloramine is formed first followed by dichloramine and then trichloramine as shown in Equation 3, 4, and 5. However, because di- and trichloramine have a strong odor, their formation is controlled and only monochloramine is desirable as a disinfectant. From breakpoint chlorination chemistry, to limit the formation of chloramines to only monochloramine the molar ratio of chlorine to ammonia (as N) needs to be 1:1 and the pH of the water needs to be higher than 9. Compared to free chlorine, monochloramine produces lower levels of regulated DBPs, but because it is a relatively new disinfectant much less is understood about its interaction with NOM or other organics in water, and it may produce more harmful DBPs that are as yet unidentified (Hua & Reckhow 2007).
(Equation 3)
(Equation 4)
25 Ultraviolet (UV) Irradiation
26 1.7 Identification of By-products
The identification of DBPs is very important to accurately assess the risk of their potentially harmful environmental and health effects. It has been shown that DOM in the water is a precursor to halogenated DBPs such as THMs, HAAs, HANs and many others formed during disinfection with chlorine (Pressman et al. 2010), some of which have been shown to be cytotoxic and/or genotoxic (Richardson et al. 2008; Plewa et al. 2002). CEECs have similar structural moieties to those found in DOM; therefore, they are likely to react with the disinfectant to form chemical byproducts that may harmful to humans. UV disinfection also has been shown to produce many byproducts, which are further chlorinated to produce halogenated DBPs (Lyon 2012). Laboratory studies have been simulated for drinking water and wastewater treatment to determine if CEECs are transformed or eliminated during chlorination and UV treatment (Vanderford et al. 2008; Gould & Richards 1984; Glassmeyer & Shoemaker 2005; Bedner & MacCrehan 2006a; Duirk et al. 2011; Wang et al. 2011; Kaplan 2011; Cermola et al. 2006; Lam et al. 2005; Pereira et al. 2007; Eriksson et al. 2004; Gomez-Pacheco et al. 2012).
27
28
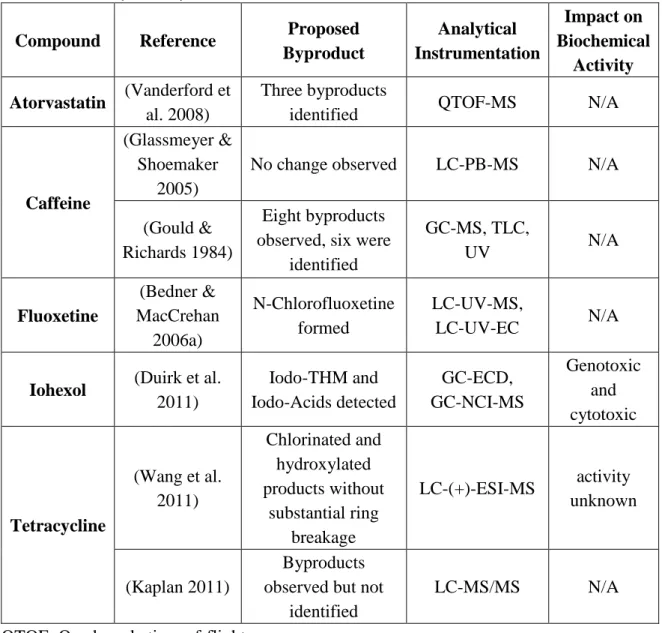
Table 1.5: Transformation products of CEECs from reaction with free chlorine and their identified toxicity activity.
Compound Reference Proposed Byproduct Analytical Instrumentation Impact on Biochemical Activity Atorvastatin (Vanderford et
al. 2008)
Three byproducts
identified QTOF-MS N/A
Caffeine
(Glassmeyer & Shoemaker
2005)
No change observed LC-PB-MS N/A
(Gould & Richards 1984)
Eight byproducts observed, six were
identified
GC-MS, TLC,
UV N/A
Fluoxetine (Bedner & MacCrehan 2006a) N-Chlorofluoxetine formed LC-UV-MS,
LC-UV-EC N/A
Iohexol (Duirk et al. 2011) Iodo-THM and Iodo-Acids detected GC-ECD, GC-NCI-MS Genotoxic and cytotoxic Tetracycline
(Wang et al. 2011) Chlorinated and hydroxylated products without substantial ring breakage
LC-(+)-ESI-MS activity unknown
(Kaplan 2011)
Byproducts observed but not
identified
LC-MS/MS N/A
QTOF=Quadrupole time-of-flight PB=Particle beam
29
Table 1.6: Transformation products of CEECs from reaction with UV treatment and their identified toxicity activity.
Compound Reference Proposed Byproduct Analytical Instrumentation Impact on Biochemical Activity Atorvastatin (Cermola et al.
2006)
Five byproducts
identified
HPLC-UV, 1H NMR, MALDI-MS
N/A
Fluoxetine (Lam et al. 2005)
two byproducts from direct photolysis and two byproducts from indirect photolysis HPLC-UV,
LC-MS/MS N/A
Iohexol (Pereira et al. 2007)
No product identified
HPLC-UV,
LC-MS/MS N/A
TBBPA (Eriksson et al. 2004) Nine byproducts identified 1 H NMR, HPLC-UV, GC-MS N/A
Tetracycline (Gomez-Pacheco et al. 2012)
No product identified Standardized biotest Byproducts generated at the beginning had higher toxicity, then decreased with longer treatment time, and eventually have a lower
toxicity 1
H NMR=Proton NMR
30 1.8 Policy and Regulation
The Safe Drinking Water Act (SDWA) was created in 1974 to protect public health by regulating the public drinking water supply, and was amended in 1986 and 1996 to include protection of drinking water sources. The U.S. Environmental Protection Agency (U.S. EPA) sets the regulatory limits for contaminants in drinking water under the SDWA and the National Primary Drinking Water Regulations (NPDWRs) lists the limits for more than 90 contaminants in public drinking water (U.S. EPA 2012a). The contaminants include microorganisms, DBPs, disinfectants, inorganic chemicals, organic chemicals, and radionuclides. The limits enforced are called Maximum Contaminant Levels (MCLs) and the recommended limits are called Maximum Contaminant Level Goals (MCLGs). MCLG is the level at which no adverse health effects would be observed while the MCL is the highest level of the contaminant that is allowed. The National Secondary Drinking Water Regulations (NSDWRs), also under the SDWA, list contaminants that may cause cosmetic or aesthetic effects and are recommended for regulations by individual states.
31
through a three step process by first identifying the universe of potential drinking water contaminants, and then applying screening criteria to generate a Preliminary CCL (PCCL), which is then further narrowed down to the CCL by detailed evaluation of occurrence and health effects through expert judgment.
32 1.9 Research Question
33
Figure 1.4: Structures of CEECs selected for this study.
1.10 Research Objectives
The objectives of this study were to:
34
2. identify byproducts of disinfection from chlorination and UV treatment of the target CEECs, and
35
2. MATERIALS AND METHODS
2.1 Materials
CEEC Standards
Atorvastatin calcium salt trihydrate (≥98%), fluoxetine hydroxide, tetracycline (≥98%), and 97% 3,3’,5,5’-tetrabromobisphenol A (TBBPA) were purchased from Sigma-Aldrich (St. Louis, MO). Anhydrous caffeine (≥99%) was purchased from Fluka Analyticals (Buchs, Switzerland). Caffeine-d3 (≥99.8 atom % D) was purchased from C/D/N Isotopes (Pointe-Claire, QC, Canada). Iohexol (388.3mg iohexol/mL) was obtained from UNC hospitals, where it was sourced from Amersham Health (Princeton, NJ). Simeton (100μg/mL) in methanol was purchased from AccuStandard (New Haven, CT). High performance liquid chromatography (HPLC) grade methanol was purchased from Fisher Scientific (Pittsburgh, PA).
Water Used
36
(Durham, NC) water purification system. For the POU system, tap water was pre-filtered to 1μm, removed of residual disinfectants, total organic carbon (TOC) was reduced to less than 0.2mg C/L with an activated carbon resin, and ions removed to less than 18MΩ with a mixed bed ion-exchange resin. Surface water samples from Cane Creek Reservoir (Orange County, NC), one of the water sources for Chapel Hill and Carrboro, NC, were collected from Orange Water and Sewage Authority (OWASA) drinking water treatment plant (Carrboro, NC).
Glassware Preparation
All non-volumetric glassware was completely emerged in detergent for 24 hours, washed with LGW, soaked in 10% nitric acid bath for 24 hours, rinsed with LGW, and dried in an oven at 180oC. For volumetric glassware, the same treatment was used but without oven drying. Instead, the glassware was rinsed with certified American Chemical Society (ACS) grade methanol (Fisher, Fair Lawn, NJ) and air dried covered under kimwipes (Kimberly-Clark, Roswell, GA).
Coagulation
37
NJ). ACS plus grade concentrated sulfuric acid purchased from Fisher Scientific (Pittsburgh, PA) was used to prepare 0.2N sulfuric acid.
Powdered Activated Carbon (PAC)
Coal-based Calgon WPH 1000 (Pittsburgh, PA) PAC was obtained from OWASA. The particle diameter of the PAC was <0.150mm (99%) and the pore size was 17.2-17.5Ǻ. The 0.7μm glass microfibre filters (934-AHTM) used for filtering samples were purchased from Whatman International Ltd. (Buckinghamshire, England).
Chlorination and Chloramination
38
reagent (AR) grade anhydrous sodium sulfite (98.9%) purchased from Mallinckrodt (Phillipsburg, NJ) or L-ascorbic acid purchased from Sigma-Aldrich (St. Louis, MO).
Ultraviolet (UV)
Uridine used for actinometry measurements during UV treatment, was purchased from Sigma-Aldrich (St. Louis, MO), while disodium phosphate heptahydrate and sodium phosphate dibasic hepta-hydrate for the phosphate buffer were purchased from Fisher Scientific (Pittsburgh, PA).
Total Organic Halogen (TOX) Analysis
39
Pharmacopeial (USP) approved oxygen and ultra high purity (UHP) helium were purchased as compressed gases from National Welders Supply, Inc. (Morrisville, NC).
Liquid Chromatography Tandem Mass Spectrometry (LC-MS/MS) Analysis
HPLC grade methanol, OmniSolve methyl-t-butyl ether (MtBE), HPLC grade acetonitrile, and glacial acetic acid (99.8% certified ACS grade) were purchased from Fisher Scientific (Pittsburgh, PA). Formic acid (99.9%) was purchased from Acros Organics (Geel, Belgium). Ammonium acetate was purchased from Mallinckrodt (Phillipsburg, NJ). Polypropylene glycol (PPG) tuning solution was purchased from Varian, Inc. (Santa Clara, CA). High pressure liquid nitrogen (99.99%), zero grade air and UHP argon were purchased as compressed gas from National Welders Supply, Inc. (Morrisville, NC). Nylon membrane filters (0.45 μm) used to filter mobile phase solutions were purchased from Whatman International Ltd. (Maidstone, England).
Gas Chromatography Analysis
40
Louis, MO). UHP helium, UHP nitrogen and medical grade carbon dioxide were purchased as compressed gases from National Welders Supply, Inc. (Morrisville, NC).
Dissolved Organic Carbon (DOC) Analysis
The DOC calibration standard, potassium hydrogen phthalate, was purchased from Sigma-Aldrich (St. Louis, MO). Concentrated hydrochloric acid (certified ACS plus) for pH adjustment was purchased from Fisher Scientific (Pittsburgh, PA). Nylon membrane filters (0.45 μm) used for filtering samples were purchased from Whatman International Ltd. (Maidstone, England). Zero grade air was purchased from National Welders Supply, Inc. (Morrisville, NC).
Solid Phase Extraction (SPE)
41 2.2 Methods
2.2.1 Solid Phase Extraction
42
CEECs in samples, which were prepared in 250mL aliquots. The concentration of the six CEECs used in the standard addition calibration curve is shown in Table 2.2, and are added to each sample right before the addition of Na2EDTA.
Table 2.1: An example of CEEC solution concentrations used in this study.
CEEC Stock (mg/L) 1
○
dilution (mg/L)
2○ dilution (mg/L)
Atorvastatin 970 19.4 0.485
Fluoxetine 1030 20.6 0.515
Caffeine-d3* 1069 21.4 0.535
Caffeine* 1093 21.9 0.548
Iohexol 1000 20.0 0.500
Tetracycline 1074 21.5 0.538
Tetrabromobisphenol A 1026 20.5 0.513
*Only one of these was present in each batch of stock solution and subsequent dilutions,
Table 2.2: Typical CEEC concentrations used for standard addition quantification.
CEEC Cal 1
(ng/L) Cal 2 (ng/L) Cal 3 (ng/L) Cal 4 (ng/L)
Atorvastatin 48.5 243 679 1067
Fluoxetine 51.5 258 721 1133
Caffeine-d3* 53.5 267 748 1176
Caffeine* 54.8 274 767 1207
Iohexol 50.0 250 700 1100
Tetracycline 53.8 269 753 1184
Tetrabromobisphenol A 51.3 256 718 1129
*Only one of these was present in each batch of stock solution and subsequent dilutions,
43
nylon filter. The internal standard, simeton, was prepared and stored in the freezer at 1.25mg/L in HPLC grade methanol. The aqueous samples were filtered and adjusted to a pH of ~2 with formic acid. Immediately before extraction, Na2EDTA was added at a concentration of 1mg/L to chelate the metal ions in the samples and prevent them from binding to the active sites on the solid phase cartridge which would otherwise lower analyte retention and recovery.
44
complete mixing of the internal standard. Sample extracts were stored in the freezer at -20oC for no more than 7 days before analysis.
2.2.2 Analytical Methods
Liquid Chromatography Tandem Mass Spectrometry (LC-MS/MS)
45
Table 2.3: Mobile phase program used for LC-(+/-)-ESI-MS/MS (flow rate: 0.2mL/min)
Time % Mobile Phase A % Mobile Phase B
0 min 90 10
30 sec 90 10
35 sec 50 50
8 min 0 100
20 min 0 100
21 min 90 10
26 min 90 10
46
Table 2.4: Source dependent mass spectrometer parameters
Parameter Set Value
Nebulizer Needle Voltage 5000V
Shield Voltage 600V
Detector Voltage (+) ESI:1445V (-)ESI:1500V
Drying Gas Flow Rate 18 psi
Nebulizer Gas Flow Rate 55 psi
Collision (CID) Gas Flow Rate 2.2 mTorr
Chamber Temperature 50○C
Drying Gas Temperature 300○C
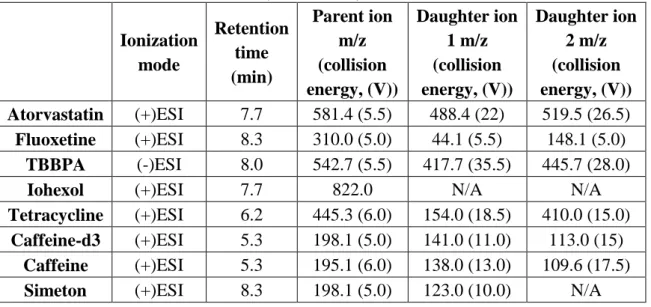
Table 2.5: Parameters for CEEC analysis the study Ionization mode Retention time (min) Parent ion m/z (collision energy, (V)) Daughter ion 1 m/z (collision energy, (V)) Daughter ion 2 m/z (collision energy, (V)) Atorvastatin (+)ESI 7.7 581.4 (5.5) 488.4 (22) 519.5 (26.5) Fluoxetine (+)ESI 8.3 310.0 (5.0) 44.1 (5.5) 148.1 (5.0)
TBBPA (-)ESI 8.0 542.7 (5.5) 417.7 (35.5) 445.7 (28.0)
Iohexol (+)ESI 7.7 822.0 N/A N/A
Tetracycline (+)ESI 6.2 445.3 (6.0) 154.0 (18.5) 410.0 (15.0) Caffeine-d3 (+)ESI 5.3 198.1 (5.0) 141.0 (11.0) 113.0 (15)
Caffeine (+)ESI 5.3 195.1 (6.0) 138.0 (13.0) 109.6 (17.5) Simeton (+)ESI 8.3 198.1 (5.0) 123.0 (10.0) N/A N/A=not available
Dissolved Organic Carbon (DOC)
47
for analysis. Calibration points were at concentrations of 0, 0.05, 0.5, 5, and 10mg/L as C. Before analysis, pH adjustment to 2 was achieved by addition of 8 drops of 2N hydrochloric acid, prepared from concentrated hydrochloric acid, to each 40mL aliquot. The samples were then put on the instrument for analysis. Multiple LGW samples and one performance check standard at 5mg/L C were run before the calibration curve, which were followed by samples. After every 10 samples, a performance check standard was included in the autosampler sequence.
Total Organic Halogen (TOX)
A series of treatments are needed before samples are ready for TOX analysis. Samples were collected in 125mL amber bottles and if they contained free chlorine were quenched with an appropriate amount of sodium sulfite depending on the concentration of chlorine residual. The concentration of quenching agent required was calculated by the following equation;
48
volume of the sample was then absorbed onto a carbon column using a Tekmar-Dohrmann AD-2000 Adsorption Module (Cincinnati, OH) at a flow rate of 2mL/min followed by a 2mL nitrate rinse (1.13g KNO3/L as N) at 1mL/min to remove adsorbed inorganic halogen ions. The carbon columns were wrapped in aluminum foil if not immediately injected onto the Rosemount Dohrmann DX-2000 Organic Halide Analyzer (Cincinnati, OH) but not held for more than 6 hours. The volume of sample absorbed onto the column was determined by estimating the total amount of organic halogen in μg of the sample so that it would fall into linear range of the detection for the instrument. Nitrate rinse blanks, which were samples of LGW of the same volume as the sample and taken through the nitrate rinse on a clean carbon column, were run at the beginning and end of adsorption as a background control for each batch of samples.
49 Gas Chromatography (GC)
The Hewlett Packard 5890 GC with an electron capture detector (ECD), a Hewlett Packard GC/SFC 7673 Injector, and Hewlett Packard 7673 Controller were used to search for and quantify volatile halogenated byproducts. The separation column was a Phenomenex (Torrance, CA) ZB 1MS (30m x 0.25mm I.D. x 1.0μm Film Thickness). The temperature program is shown in Table 2.6. The injector temperature was set at 250oC and sample injection (splitless-split) volume was 1μL. The temperature of the detector was set at 300oC. A hexachlorobenzene (HCB) solution in hexane at 100μg/L was run at the beginning and end of a set of samples as a performance check for the instrument. The carrier gas was UHP helium at a flow rate of 1mL/min.
Table 2.6: Temperature program for GC-ECD
Time Temperature (oC)
0 min 35
10 min 35
36.5 min 300
40 min 300
50
extract volume of 1μL was injected manually. Before the first sample injection, an air/water check was carried out to ensure that there was no leak in the system. HCB in hexane (100μg/L) was used as a performance check before any sample run and to ensure instrument sensitivity by comparing the area and height of the peak to those obtained in previous runs. The detector was set to scan the mass range of 70-150 Daltons in positive ionization mode. The carrier gas was UHP helium at a flow rate of 1mL/min.
Ultraviolet-Visible (UV-Vis) Analysis
UV-Vis characterization of samples was undertaken using a Hitachi U-3300 Spectrophotometer (Danbury, CT). The solutions and standards prepared at 10mg/L in LGW were scanned from 200-700nm to determine the wavelength of maximum absorption (λmax).
Medium Pressure (MP) UV System
51
52 Figure 2.1: Diagram of the MP-UV system.
2.2.3 Bench Scale Coagulation Experiment
53
immediately to the environmental chemistry laboratory in the Michael Hooker Research Center at UNC and immediately placed in a refrigerator at 4○C and used within two weeks of collection.
54 Table 2.7: Coagulant concentration and stock added
Aluminum sulfate concentration
(mg/L)
mL of aluminum sulfate stock added to 1.5L
sample
Ferric sulfate concentration
(mg/L)
mL of ferric sulfate stock added
to 1.5L sample
20 4 40 8
30 4+2 50 8+2
40 4+2+2 60 8+2+2
50 4+2+2+2 70 8+2+2+2
60 4+2+2+2+2 80 8+2+2+2+2
A second preliminary jar test determined the optimum coagulant concentration and settlement time by using various concentrations (aluminum sulfate: 20, 30, 40, 60 mg/L, ferric sulfate: 40, 50, 60, 70, 80 mg/L) of coagulant added to different jars and the corresponding volume of acid or base for pH adjustment needed for each dose was added before the coagulant. The mixing conditions for the jar test were 30 seconds of rapid mix at 100 rpm followed by 36 minutes of flocculation at 25 rpm and settlement for 10, 30, and 60 min. The turbidity of the water was tested before pH adjustment and after coagulation and settlement time to determine conditions for maximum removal of turbidity.
55
were treated with either aluminum sulfate or ferric sulfate according to results from the previous experiments. The treated and untreated samples were then taken through SPE and analyzed by LC-MS/MS. Quality control samples for each coagulant were created by spiking 250ng/L of the CEEC mix into coagulated and settled water samples after filtering through 0.45μm nylon filter. A sample of unspiked raw water, spiked raw water, aluminum sulfate-treated water, and ferric sulfate-treated water were tested for DOC, turbidity, and pH.
2.2.4 Bench Scale PAC Experiment
56
250mL samples were pulled out after mix times of 2, 5, 10, 15, 30, 60 and 120 minutes and were filtered immediately through 1.5μm glass micofibre filters to end the interaction between PAC and the water. For quality control, 250mL aliquots were removed for each PAC dose at reaction times of 15 and 60 minutes and 250 ng/L of CEEC mixture was spiked in. Standard addition calibration samples used the 10mg/L PAC dose sample pulled after 15 minutes. The treated and untreated samples were taken through SPE and then analyzed by LC-MS/MS.
2.2.5 Chlorination and UV Byproduct Identification
Individual CEEC solutions were prepared at 10mg/L in LGW and separated into three samples; one for chlorination, one for MP-UV treatment, and one for a control sample (untreated sample). A single MP-UV treatment dose of 1000mJ/cm2 was used to generate detectable changes. The chlorination treatment used a chlorine to CEEC molar ratio of 20:1 and samples were reacted for 24 hr in the dark under headspace-free conditions at 20○C in 20mL amber bottles covered with foil. An example calculation for chlorine dose using tetracycline (molecular weight of 444.4) is shown here.
57
After 24 hours reaction, the chlorinated samples were quenched with ascorbic acid according to the free chlorine residual concentration. The ascorbic acid was added as a solution in LGW and the amount needed calculated using the equation below;
The value 4.96 is the stoichiometric molar ratio between chlorine and ascorbic acid multiplied by a safety factor of 2 to ensure complete quenching. Table 2.8 shows the chlorine dose used for each CEEC. Treated samples and controls were then directly infused onto the MS/MS at a flow rate of 20μL/min delivered by a Harvard Apparatus (Holliston, MA) Syringe Pump. Product ions were identified by scanning mass to charge (m/z) every 100 Daltons from 50 to 900 Daltons using the same MS conditions listed in Table 2.4. The treated samples were compared to the control sample of 1mg/L of CEEC in LGW scanned in the same m/z range. Ions with significant signal that were absent in the control sample were recorded and daughter ions for each product ion were identified if they were generated. From this information, product structure was hypothesized.
Table 2.8: Chlorination dose for each 10mg/L CEEC reaction
Compound Chlorine dose (mg/L)
Atorvastatin 23.5
Caffeine-d3 72.7
Fluoxetine 41.0
Iohexol 17.3
Tetracycline 31.9
58 2.2.6 Chlorination of Tetracycline Experiment
In a specific case study, the UV-Vis absorbance of the ascorbic acid-quenched, chlorine-treated tetracycline (10mg/L) was compared to the untreated sample using a Hitachi (Danbury, CT) U-3300 Spectrophotometer. Another sample of tetracycline was prepared at a higher concentration (100mg/L) and reacted with chlorine again at a 20:1 molar ratio under the same reaction conditions and quenching as described in Section 2.2.5. 20mL samples aliquots were removed and extracted with 4mL of MtBE. The extracts were analyzed on the GC-ECD and GC-MS for volatile halogenated byproducts.
59
chlorine residuals measured with the HACH (Loveland, CO) test kit pocket colorimeter and HACH permachem DPD free chlorine reagents. The amount of quenching agent added was 24.8mg/L for ascorbic acid and 17.7mg/L for sodium sulfite for all samples. The concentration of quenching agent required was calculated by the equations described previously for ascorbic acid and sodium sulfite. 20mL of the 40mL samples were removed from their vials and extracted with 4mL of MtBE spiked with internal standard 1,2-dibromopropane (100μg/L). The extracts were analyzed using the GC-ECD method described in section 2.2.2. The 125mL samples were analyzed for TOX using 50mL of the sample for absorption onto the carbon columns as described in section 2.2.2.
2.2.7 Comparison of Chlorination and Chloramination of Tetracycline
60
61
3. RESULTS AND DISCUSSION
3.1 Solid Phase Extraction Recovery (SPE)
62
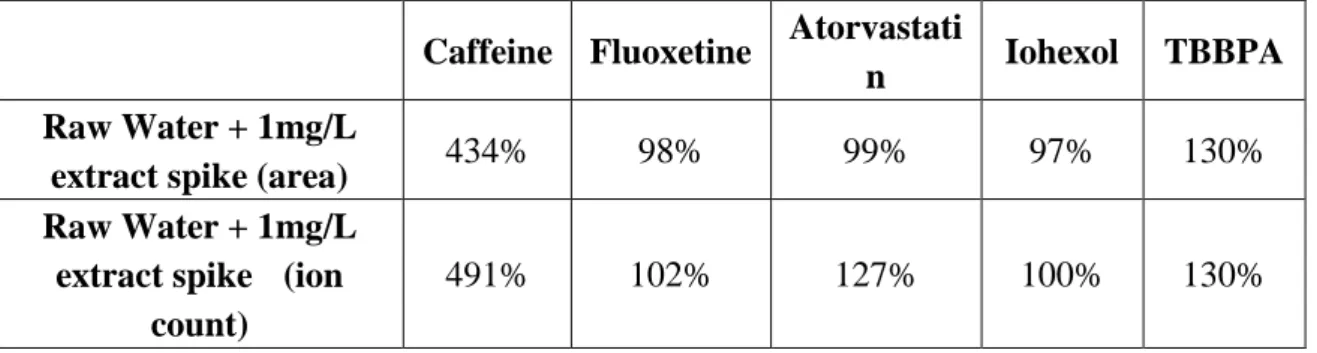
signal of caffeine is most impacted by the raw water extract matrix in both ion count and area. Relative area could not be used for assessment due to the suppressed signal of the internal standard, simeton, by the extract matrix.
63
Figure 3.2: Comparison of LC-MS/MS ion count response for each CEEC in the SPE extract (n=1). RW = raw water, RWB = raw water spiked before filtering, RWA = raw water spiked after filtering.
Table 3.1: Effect of raw water extract on signal response calculated by area and ion count (comparing 1mg/L standard and 1mg/L extract spike).
Caffeine Fluoxetine Atorvastati
n Iohexol TBBPA Raw Water + 1mg/L
extract spike (area) 434% 98% 99% 97% 130%
Raw Water + 1mg/L extract spike (ion
count)
64
All CEECs in the RWA sample had a higher signal than in the RWB sample when comparing both ion count (Figure 3.2) and area (Figure 3.1), which suggests that the CEECs may have been filtered out with the suspended solids in the raw water or have adsorbed onto the nylon filter during the pretreatment for SPE. This is particularly the case with TBBPA, which was not detected when spiked into raw water before filtering but is fully recovered when spiked into raw water after filtration (Table 3.2). This could be due to the high log Kow of TBBPA, which is 4.50.
65
Table 3.2: SPE recovery of CEECs calculated by area and ion count (comparing RWA or RWB and 1mg/L raw water extract spike). RWB = raw water spiked before filtering, RWA = raw water spiked after filtering.
Caffeine Fluoxetine Atorvastatin Iohexol TBBPA
RWB (area) 80% 65% 56% 48% 0%
RWB (ion
count) 87% 70% 53% 52% 0%
RWA (area) 129% 97% 59% 64% 103%
RWA (ion
count) 154% 96% 46% 60% 108%
A test was then carried out to determine if TBBPA was filtered out by the 0.45μm nylon filter or have attached onto the sediment which was filtered out. A sample of TBBPA in LGW was filtered with the nylon filter and analyzed for TBBPA after mixing 1:1 with HPLC grade methanol through direct infusion mass spectrometry (MS) but TBBPA was not detected. Other types of filters were then evaluated in the same manner. The 0.7μm glass-fibre filter was found to be the only one that did not filter out TBBPA, and so was used in later experiments in place of the nylon filters but, unfortunately, not prior to those described in the next section.
3.2 Coagulation for Removal of CEECs from Surface Water
66
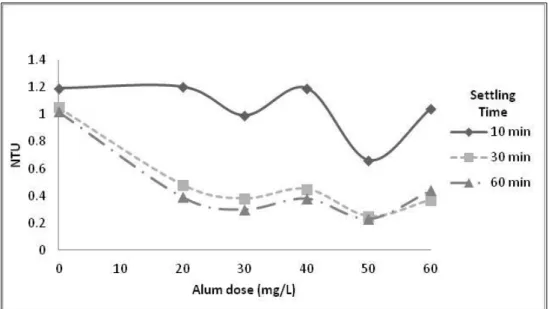
measurements before performing the bench scale study involving the CEECs according to Section 2.2.3. The pH was tested and adjusted to 5.6 and 5.8, respectively, for each dose as described in Section 2.2.3. From Figures 3.3 and 3.4 the optimum doses are 50mg/L and 70mg/L, respectively, with a settlement time of 60 minutes. Although doses of 30mg/L (alum) and 50mg/L (ferric sulfate) could also have been selected, they most likely represent the charge neutralization phase (all negatively charged colloids neutralized by positively charged coagulants and precipitates). The selected doses, however, are those for sweep flocculation, commonly used in drinking water treatment, where contaminants are swept down by the settling flocs.
67
Figure 3.4: OWASA surface water turbidity as a function of varying ferric sulfate dose after different settling times.
68
Figure 3.5: Comparison of CEEC concentration of quality control samples (250ng/L spike).
Figure 3.6: Comparison of concentration of CEEC before and after coagulation with alum and ferric sulfate. Error bars represent the difference in concentration of duplicate samples.
69
70
5.2mg/L while in this study the DOC concentration was 2.9mg/L. The higher DOC may have facilitated the removal in the Knappe et al. (2012) study. Both studies showed ineffective removal of caffeine.
3.3 CEEC Removal from Surface Water by Powdered Activated Carbon (PAC)
71
8.02) is lower than that of caffeine (log Kow = -0.07) which is the opposite of the prediction. Clearly, other properties impact removal such as molecular size, structure, ionic versus neutral form, pH of the water, DOC concentration of water, and type of PAC.
Figure 3.7: Removal of CEECs at PAC dose of 5mg/L over time.
72
Figure 3.9: Removal of CEECs at PAC dose of 20mg/L over time.
Table 3.3: First order kinetic rate (M L-1 s-1) of adsorption of CEECs by PAC.
PAC dose Caffeine Fluoxetine TBBPA
5mg/L 0.0077 0.0176 0.0057
10mg/L 0.0297 0.0206 0.0125
20mg/L 0.0303 0.0187 0.0178
73
Knappe et al. (2012) also evaluated the effect of PAC addition during coagulation on pharmaceutical, DOC and turbidity removal. Their results indicated that while no significant increase in DOC and turbidity removal occurred compared to coagulation without PAC, there was a significant increase in removal of the pharmaceuticals. Taking into account the high removal of CEECs with PAC shown in this current study, its use during drinking water treatment would significantly reduce CEEC concentration before disinfection and reduce the formation of byproducts resulting from interaction with the disinfectant.
3.4 Chlorination and UV Treatment Byproducts
3.4.1 Chlorination Byproducts
74
75
Table 3.4: Ions found in the chlorine-treated CEEC solution (* indicates ions that are present in the untreated sample, ions in bold may contain chlorine)
CEEC (m/z, ion count, ESI mode
of parent ion before treatment) Ionization Parent ion (approximate ion count) Daughter ion 1 m/z (ion
count)
Daughter ion 2 m/z (ion count)
Atorvastatin (581.4, 1E07,
(+)ESI)
+ESI
80.9 (9E06) ND ND
82.9 (3E06) ND ND
215.0 (4E07) ND ND
247.1 (1E07) 229.0 (5.4E05) 167.0 (6.4E04) 407.0 (7E06) 214.0 (1.0E06) ND
476.4 (2E06) ND ND
597.3 (3E07) 462.3 (1.3E6) 554.3 (3.3E05) 598.3 (1E07) 554.6 (1.7E05) 462.7 (9.0E04) 599.3 (3E06) 556.3 (3.1E04) ND
613.2 (4E06) ND ND
631.2 (1E07) 308.4 (8.3E04) 458.3 (1.5E04) 632.2 (3E06) 237.3 (1.7E04) 124.3 (2.5E03)
633.2 (3E06) ND ND
634.2 (3E06) ND ND
-ESI 60.8 (4E07) ND ND
76.8 (7E07) ND ND
76
Table 3.4 (continued): Ions found in the chlorine-treated CEEC solution (* indicates ions that are present in the untreated sample, ions in bold may contain chlorine)
CEEC (m/z, ion count, ESI mode
of parent ion before treatment) Ionization Parent ion (approximate ion count) Daughter ion 1 m/z (ion
count)
Daughter ion 2 m/z (ion count)
Fluoxetine (310.0, 4E07,
(+)ESI)
+ESI
62.7 (8E06) ND ND
80.8 (1E07) 79.7 (2.8E05) ND
82.8 (3E06) ND ND
90.0 (1E07) 88.9 (7.1E05) 72.6 (1.1E04) 148.2 (2E07) 102.9 (3.7E05) 69.0 (1.1E05)
215.0 (1E08) ND ND
*310.0 (1E08) ND ND
*360.2 (2E07) 147.9 (8.8E05) 163.9 (7.4E05)
-ESI
173.0 (1E07) 120.4 (1.7E03) 75.4 (1.6E03)
175.2 (3E06) ND ND
177.0 (1.5E06) ND ND
193.2 (1E07) ND ND
206.0 (4E07) ND ND
208.4 (4E07) ND ND
209.4 (4E07) 64.2 (2.2E03) 177.7 (1.2E03)
210.1 (2E07) ND ND
211.1 (1E07) ND ND
219.4 (5E07) ND ND
220.0 (2.5E07) ND ND
341.1 (5E06) 88.6 (6.4E03) ND
Caffeine-d3 (198.1, 6E07,
(+)ESI)
+ESI
80.9 (1E07) ND ND
86.0 (1E07) 68.7 (1.2E04) ND 112.9 (2E07) 71.9 (2.0E04) 56.5 (1.1E05) 141.0 (2E07) 94.7 (9.4E05) 83.1 (5.5E05) 157.0 (1E07) 110.8 (3.7E05) ND 171.0 (1E07) 152.3 (7.6E04) 85.8 (2.9E04) 175.0 (2E07) 62.9 (8.8E05)) 130.8 (1.4E06)
*198.1 (6E07) ND ND
215.0 (1E08) ND ND
-ESI
*60.8 (7E07) ND ND
*61.9 (7E07) ND ND
*76.8 (7E07) ND ND
173.0 (5E06) ND ND
77
Table 3.4 (continued): Ions found in the chlorine-treated CEEC solution (* indicates ions that are present in the untreated sample, ions in bold may contain chlorine)
CEEC (m/z, ion count, ESI mode
of parent ion before treatment) Ionization Parent ion (approximate ion count) Daughter ion 1 m/z (ion
count)
Daughter ion 2 m/z (ion count)
Iohexol (843.9, 3E06,
(+)ESI)
+ESI
*65.0 (1E07) ND ND
157.0 (5E06) ND ND
175.0 (5E06) 130.8 (4.5E05) 62.8 (3.3E05) 197.0 (4E06) 62.8 (4.3E05) 153.0 (2.6E05)
*198.1 (3E06) ND ND
199.0 (1E07) 62.7 (9.7E04) 56.8(3.6E03)
215.0 (7E07) ND ND
247.0 (2E07) ND ND
255.1 (6E06) 156.9 (8.8E05) 144.8 (4.8E05) 407.0 (1E07) 214.9 (1.7E07) ND
*843.9 (8E06) ND ND
-ESI *60.9 (4E07) ND ND
*76.8 (4E07) ND ND
Tetracycline (445.3, 1E07,
(+)ESI)
+ESI 80.8 (2E07) ND ND
82.9 (6E06) ND ND
-ESI
*60.8 (5E07) ND ND
61.8 (5E07) ND ND
*76.7 (5E07) ND ND