Portland State University
PDXScholar
Institute for Sustainable Solutions Publications and
Presentations
Institute for Sustainable Solutions
8-2017
County-Level Cumulative Environmental Quality Associated
With Cancer Incidence
Jyotsna S. Jagai
University of Illinois at Chicago
Lynne C. Messer
Portland State University, [email protected]
Kristen M. Rappazzo
University of North Carolina at Chapel Hill
Christine L. Gray
University of North Carolina at Chapel Hill
Shannon C. Grabich
University of North Carolina at Chapel Hill
See next page for additional authors
Let us know how access to this document benefits you.
Follow this and additional works at:
http://pdxscholar.library.pdx.edu/iss_pub
Part of the
Environmental Health Commons, and the
Environmental Public Health Commons
This Article is brought to you for free and open access. It has been accepted for inclusion in Institute for Sustainable Solutions Publications and Presentations by an authorized administrator of PDXScholar. For more information, please [email protected].
Recommended Citation
Authors
Jyotsna S. Jagai, Lynne C. Messer, Kristen M. Rappazzo, Christine L. Gray, Shannon C. Grabich, and Danelle T. Lobdell
County-Level Cumulative Environmental Quality
Associated With Cancer Incidence
Jyotsna S. Jagai, MS, MPH, PhD1; Lynne C. Messer, MPH, PhD2; Kristen M. Rappazzo, PhD3; Christine L. Gray, MPH4,5; Shannon C. Grabich, PhD4,5; and Danelle T. Lobdell, PhD3
BACKGROUND: Individual environmental exposures are associated with cancer development; however, environmental exposures occur simultaneously. The Environmental Quality Index (EQI) is a county-level measure of cumulative environmental exposures that occur in 5 domains.METHODS:The EQI was linked to county-level annual age-adjusted cancer incidence rates from the Surveillance, Epidemiology, and End Results (SEER) Program state cancer profiles. All-site cancer and the top 3 site-specific cancers for male and female subjects were considered. Incident rate differences (IRDs; annual rate difference per 100,000 persons) and 95% confidence intervals (CIs) were estimated using fixed-slope, random intercept multilevel linear regression models. Associations were assessed with domain-specific indices and analyses were stratified by rural/urban status.RESULTS:Comparing the highest quintile/poorest environmental quality with the lowest quintile/best environmental quality for overall EQI, all-site county-level cancer incidence rate was positively associated with poor environmental quality overall (IRD, 38.55; 95% CI, 29.57-47.53) and for male (IRD, 32.60; 95% CI, 16.28-48.91) and female (IRD, 30.34; 95% CI, 20.47-40.21) subjects, indicating a potential increase in cancer incidence with decreasing environmental quality. Rural/urban stratified models demonstrated positive associations comparing the highest with the lowest quin-tiles for all strata, except the thinly populated/rural stratum and in the metropolitan/urbanized stratum. Prostate and breast cancer demonstrated the strongest positive associations with poor environmental quality.CONCLUSION:We observed strong positive asso-ciations between the EQI and all-site cancer incidence rates, and assoasso-ciations differed by rural/urban status and environmental domain. Research focusing on single environmental exposures in cancer development may not address the broader environmental context in which cancers develop, and future research should address cumulative environmental exposures.Cancer2017;123:2901-8.
VC 2017 American Cancer Society.
KEYWORDS:all-site cancer, cumulative environmental exposures, air, water, land, built, sociodemographic.
INTRODUCTION
Cancer is a major public health problem in the United States, causing 1 in 4 deaths overall.1 In 2014, an estimated 585,720 deaths—approximately 1600 per day—were due to cancer.1The estimated cancer-related costs in 2009 were $243.4 billion.2The most common causes of cancer death in men are lung, prostate, and colorectal cancer, and the most common causes in women are lung, breast, and colorectal cancer.1Cancer risk is affected by a combination of genetic fac-tors and environmental exposures. Recent research suggests that genetic variations interact with harmful environmental exposures to exacerbate exposure effects and increase cancer risk.3-5
Analysis of data on twins suggests that the genetic contribution to cancer is approximately 50%, suggesting that exogenous factors play a significant role in cancer development.6-8Environmental exposures can alter or interfere with a variety of biological processes, including hormone production and function, inflammation, DNA damage, and gene sup-pression or overexsup-pression.4,9For example, lung cancer is associated with several environmental exposures, including radon,10,11pesticides,12,13 and diesel exhaust.14,15 Breast and prostate cancers are also associated with environmental exposures, such as ionizing radiation, solvents, and environmental mutagens.16-18Social exposures, such as poverty, and the built environment have also been associated with cancer outcomes.19-21 However, the interaction of multiple
Corresponding author:Jyotsna S. Jagai, 2121 W. Taylor Street, MC 922, Chicago, IL 60612; Fax: (312) 413-9898; [email protected]
1
School of Public Health, Division of Environmental and Occupational Health Sciences, University of Illinois at Chicago, Chicago, Illinois;2
School of Community Health, College of Urban and Public Affairs, Portland State University, Portland, Oregon;3
US Environmental Protection Agency, National Health and Environmental Effects Research Laboratory, Chapel Hill, North Carolina;4
Gillings School of Global Public Health, University of North Carolina, Chapel Hill, North Carolina;5 Oak Ridge Institute for Science and Education, US Environmental Protection Agency, National Health and Environmental Effects Research Laboratory, Chapel Hill, North Carolina.
We thank Therese Dolecek and Radhika Dhingra for insightful review and suggestions to improve the manuscript.
The views expressed in this manuscript are those of the authors and do not necessarily reflect the views or policies of the US Environmental Protection Agency. Mention of trade names or commercial products does not constitute endorsement or recommendation for use.
See referenced editorial on pages 2796-7, this issue.
Additional supporting information may be found in the online version of this article.
DOI:10.1002/cncr.30709,Received: October 7, 2016;Revised: January 5, 2017;Accepted: January 7, 2017,Published online May 8, 2017 in Wiley Online Library (wileyonlinelibrary.com)
Cancer August 1, 2017 2901
environmental exposures remains largely unstudied22,23; therefore, the burden of environmentally induced cancer may be underestimated.
Epidemiologic research has traditionally focused on single environmental exposures because the empirical quantification of cumulative exposures, from various environmental sources, is difficult.24,25However, measur-ing a smeasur-ingle environmental exposure does not fully capture environmental effects on health. Rather, several environ-mental exposures (including social exposures) occur simultaneously, working through multiple mechanisms to induce poor health outcomes, including cancer.
To capture multidimensional ambient environmen-tal exposures, the Environmenenvironmen-tal Quality Index (EQI) was developed. The publically available EQI26 is a county-level measure of cumulative ambient environmen-tal exposures for the United States for the period 2000-2005.24,27The index was constructed to provide 1 unified EQI as well as domain-specific indices for all counties.
We used the EQI to assess the burden of cumulative environmental exposures on all-site and site-specific can-cer incidence. We examined county-level cancan-cer incidence rates for the period 2006-2010 in association with the EQI, which represents the period 2000-2005. To assess which environmental domains drive the associations with cancer incidence, we also considered domain-specific indices. Factors influencing environmental quality vary in urban and rural areas28; therefore, we also investigated associations between cancer incidence and the EQI and domain-specific indices stratified by rural/urban status.
METHODS AND MATERIALS
Study Population and Outcome Data
Population-based cancer incidence rates were abstracted from National Cancer Institute state cancer profiles29for all available counties in the United States for which data were available. This is a national county-level database of cancer data that are collected by state public health sur-veillance systems. All-site cancer is defined as any type of cancer that is captured in the state registry data, though nonmelanoma skin cancer is not included. All-site age-adjusted cancer incidence rates were abstracted separately for male and female subjects. County-level annual age-adjusted all-site cancer incidence rates for the years 2006-2010 were available for 2687 of 3142 (85.5%) counties in the United States. Counties for which there are fewer than 16 reported cases in a specific area/sex/race category are suppressed to ensure confidentiality and stability of rate estimates; this accounted for 14 counties in our study.
Two states, Kansas and Virginia, do not provide data because of state legislation and regulations which prohibit the release of county-level data to outside entities. Data from Michigan do not include cases diagnosed in other states because data exchange agreements prohibit the release of data to third parties. Finally, state data are not available for 3 states, Minnesota, Ohio, and Washing-ton.29The age-adjusted average annual incidence rate for all counties was 453.7 per 100,000 persons.
We selected 2006-2010 as it is subsequent in time to the EQI exposure data which was constructed to represent the years 2000-2005. We also gathered data for the 3 lead-ing causes of cancer for male (lung, prostate, and colorec-tal) and female (lung, breast, and coloreccolorec-tal) subjects. These cancers account for a total of less than 50% of all cancer incidence (breast, 14.0%; prostate, 13.3%; lung, 13.3%; colorectal, 8.0%).30Incidence rate data were lim-ited for site-specific cancers due to the smaller number of cases. Site-specific cancer incidence rates for male subjects were available for 2322 (73.9%) counties for lung cancer, 2508 (79.8%) counties for prostate cancer, and 2133 (67.9%) counties for colorectal cancer. For female sub-jects, site-specific cancer incidence rates were available for 2168 (69.0%) counties for lung cancer, 2460 (75.3%) counties for breast cancer, and 2020 (64.3%) counties for colorectal cancer.
Exposure Data: The EQI
The EQI was used as an exposure metric as an indicator of cumulative environmental exposures at the county level during the period 2000-2005. A complete description of the datasets used in the EQI are provided in Lobdell et al,27 and methods used for index construction have been described by Messer et al.24The EQI was developed for the period 2000-2005 because it was the time period for which the most recent data were available when index construction was initiated. The EQI includes variables representing each of the environmental domains. The air domain includes 87 variables representing criteria and hazardous air pollutants. The water domain includes 80 variables representing overall water quality, general water contamination, recreational water quality, drinking water quality, atmospheric deposition, drought, and chemical contamination. The land domain includes 26 variables representing agriculture, pesticides, contaminants, facili-ties, and radon. The built domain includes 14 variables representing roads, highway/road safety, public transit behavior, business environment, and subsidized housing environment. The sociodemographic environment includes 12 variables representing socioeconomics and
crime. Supporting Table 1 provides all variables in each domain by construct.
Domain-specific indices (air index, water index, etc) were created by retaining the first component of a princi-ple components analysis (PCA) that included all of the domain-specific variables. The EQI was created by retaining the first component of a principle components analysis that combined the domain-specific indices. Rec-ognizing that environments differ across the rural–urban continuum, the EQI and domain-specific index construc-tion was also stratified by rural–urban continuum codes
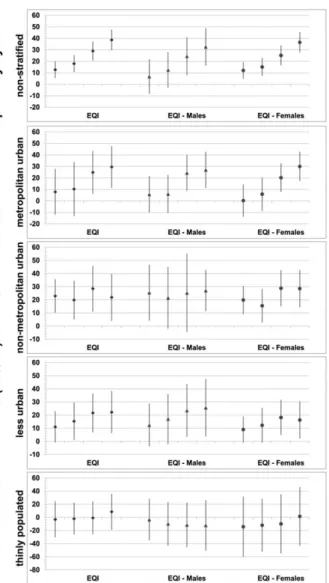
(RUCC).31We used 4 RUCC categories: RUCC1, which represents metropolitan urbanized; RUCC2, which sents non-metropolitan urbanized; RUCC3, which repre-sents less urbanized; and RUCC4, which reprerepre-sents thinly populated, all of which have been used in previous health analyses.32-35 Finally, we have 6 nonstratified indices (1 overall EQI and 5 domain-specific indices) and 6 corre-sponding indices for each of the 4 RUCC strata. This allows for assessment of cumulative environmental expo-sure, domain-specific drivers, and rural/urban variations. The rural/urban stratified overall EQI is shown in Figure 1; for each index, higher values correspond to poorer envi-ronmental quality.
DATA ANALYSIS
We assessed relationships between county-level exposures representing the period 2000-2005 and cancer incidence rates representing the period 2006-2010 to account for the lag in cancer development. Exposure variables used in the analysis were: nonstratified and RUCC-stratified EQI, and nonstratified and RUCC-stratified domain-spe-cific indices. For cancer outcomes, we considered county-level, adjusted, all-site cancer incidence rates and age-adjusted, site-specific cancer incidence rates for the lead-ing cancer types by sex. Indices were developed as contin-uous variables and standardized to have a mean of 0 and standard deviation of 1. Therefore, analyses used quintiles of the indices to allow for more meaningful interpretation (between areas of good [1], moderate [3], and poor [5] environmental quality). The index quintiles were associat-ed with county-level cancer incidence rates using fixassociat-ed slope, random intercept multilevel linear regression mod-els, with state as the random effect and county as the fixed effect, to estimate the fixed effects of index quintiles on cancer incidence rates. Correlations among the EQI domains ranged from 0.08 (air and water domains) to 0.40 (air and built domains).24Domain-specific analyses were adjusted for all other environmental domains. Given that the EQI includes variables from all domains of the broader environment, there are few potential confounders to adjust for in the analysis. However, analyses were adjusted for county percentage of the population that ever smoked, which is available from the Surveillance, Epide-miology, and End Results (SEER) Program database. Analyses of breast cancer incidence rates in female subjects were additionally adjusted for county-level mammogra-phy screening rates. Results are reported as incidence rate differences (IRDs; annual rate difference per 100,000 per-sons) and 95% confidence intervals (CIs) comparing each quintile with the lowest quintile/best environmental
Figure 1. Incidence rate differences (95% confidence inter-vals) for all-site cancer, 2006-2010, and overall Environmental Quality Index (EQI), combined and separately for male and female subjects by urban/rural continuum (RUCC1, metropoli-tan urbanized; RUCC2, non-metropolimetropoli-tan urbanized; RUCC3, less urbanized; and RUCC4, thinly populated) using quintile 1 (best environmental quality) as a reference and adjusting for county percentage of the population that ever smoked.
Environment and Cancer Incidence/Jagai et al
quality for each index. We used difference measures because given the severity of the outcomes of interest, they are informative for assessing public health impact and to inform decision making.36
RESULTS
Population Description
Of the 2687 counties in the analysis, 34% (921) were metropolitan urbanized (RUCC1), 10% (274) were non-metropolitan urbanized (RUCC2), 34% (927) were less urbanized (RUCC3), and 21% (564) were thinly popu-lated (RUCC4). This mirrors the RUCC distribution of all US counties, which is also 34% RUCC1, 10% RUCC2, 34% RUCC3, and 21% RUCC4. The average annual county-level age-adjusted all-site cancer incidence rate was 451.03 cases per 100,000 population (standard deviation, 59.43). The mean and standard deviations of annual county-level age-adjusted incidence rates for all cancer outcomes varied across rural/urban strata (Table 1).
All-Site Cancer Incidence Results
County-level models were used to assess environmental drivers of all-site cancer incidence rates, stratified by sex and RUCC. Comparing the highest quintile/poorest environmental quality with the lowest quintile/best envi-ronmental quality for the overall EQI, all-site county-level cancer incidence was positively associated with poor envi-ronmental quality overall (IRD, 38.55; 95% CI, 29.57-47.53) and for male (IRD, 32.60; 95% CI, 16.28-48.91) and female (IRD, 30.34; 95% CI, 20.47-40.21) subjects. Considering all quintiles, the analysis demonstrated
increasing trends in association of cancer as environmental quality declined (Fig. 2). RUCC-stratified models dem-onstrated positive associations comparing the highest quintiles with the lowest quintiles for all strata except the thinly populated stratum and increasingly stronger associ-ations by quintile for all-site cancer in the metropolitan urbanized strata.
Associations with the air index and all-site cancer inci-dence rates were positive and demonstrated an increasing trend by quintiles, indicating a potential increase in cancer incidence with decreasing air quality (Fig. 2). Comparing the highest quintile with the lowest quintile, the analysis demonstrated all-site county-level cancer incidence was positively associated with poor air quality (IRD, 44.19; 95% CI, 34.84-53.54). Patterns of associations were simi-lar across rural/urban strata, demonstrating an increase in all-site cancer incidence with worsening air quality.
Effect estimates for the water index were negative or near null for site cancer incidence. For example, for all-site cancer comparing the highest quintile with the lowest quintile, the IRD was20.75 (95% CI,214.21 to 12.70) and there was no trend by quintile. Results for RUCC-stratified analyses were similar, demonstrating negative or near null effect estimates without a trend by quintile. The metropolitan urbanized strata, however, demonstrated negative results across all quintiles with the highest effect estimates seen with the 4th and 5th quintiles (IRD, 219.68; 95% CI,235.45 to23.91; and IRD,220.45; 95% CI, 235.24 to 25.85, respectively), indicating a decrease in all-site cancer with worsening water quality.
Effect estimates for the land index varied by quintile and by RUCC. All-site cancer demonstrated an increasing
TABLE 1. Means and Standard Deviations (Per 100,000 Population) for Annual County-Level Age-Adjusted Incidence Rates of Cancer Outcomes by Rural/Urban Strata for the Period 2006-2010 and Number of Counties for Which Data Were Available
Outcome All Counties
RUCC1 (Metropolitan
Urbanized)
RUCC2 (Non-metropolitan
Urbanized)
RUCC3 (Less Urbanized)
RUCC4 (Thinly Populated)
All-site cancer 451.03659.43 (2687) 462.80648.01 (921) 462.62644.98 (274) 448.48659.49 (927) 430.44674.51 (564) Male subjects
All-site cancer 525.26678.69 (2663) 537.23663.03 (920) 537.90662.10 (274) 521.80682.68 (927) 504.47696.47 (541) Lung cancer 93.86626.39 (2323) 89.54622.49 (901) 89.75622.00 (274) 96.35629.20 (851) 103.68629.08 (296) Prostate cancer 139.90632.31 (2508) 143.37629.39 (913) 141.35628.45 (274) 135.56632.26 (907) 140.85639.29 (413) Colorectal cancer 56.07613.02 (2133) 52.7769.84 (874) 55.01610.83 (274) 58.41613.97 (784) 62.83618.61 (200) Female subjects
All-site cancer 399.78655.15 (2650) 409.97644.14 (919) 408.41641.59 (274) 395.57651.08 (927) 385.07677.02 (529) Lung cancer 59.42614.33 (2167) 58.54612.81 (887) 58.43613.15 (273) 59.66615.23 (785) 63.40617.26 (221) Breast cancer 114.22619.10 (2454) 119.16616.04 (909) 116.26614.99 (274) 109.60618.82 (903) 111.88625.40 (367) Colorectal cancer 41.7069.35 (2020) 39.6767.38 (858) 40.6367.56 (272) 43.48610.18 (738) 46.40613.73 (151)
Abbreviation: RUCC, rural urban continuum code. All data are presented as the mean6standard deviation (n).
association with quintile of land domain index; the high-est effect high-estimate seen in the highhigh-est quintile (poor envi-ronmental quality) (IRD, 6.27; 95% CI, 23.93 to 16.47). RUCC-stratified analyses demonstrated generally positive effect estimates in the metropolitan urbanized and non-metropolitan urbanized strata and negative effect estimates in the less urbanized and thinly populated strata.
Associations with the built index were positive for all quintiles and demonstrated an increasing trend by quin-tiles in nonstratified analyses. The highest effect estimate for the built index was in the 4th quintile (IRD, 29.82;
95% CI, 21.27-38.38). Patterns of association were posi-tive across all rural/urban strata, with the highest associa-tions seen in the thinly populated strata.
Effect estimates for the sociodemographic index were also positive for all quintiles of the EQI, though a trend by quintiles was not seen in the nonstratified analy-sis. The highest effect estimate for the sociodemographic index was in the 3rd quintile (IRD, 20.59; 95% CI, 11.30-29.88). Similar to the built domain, patterns of association were positive across all rural/urban strata; the highest associations were seen in the thinly populated strata.
Site-Specific Cancer Incidence Results
County-level models were used to assess environmental drivers of incidence rates of the top 3 site-specific cancers for male and female subjects. In general, effect estimates for site-specific cancers for both male and female subjects were negative or near null (Supporting Fig. 1). However, both prostate cancer and breast cancer demonstrated posi-tive associations when comparing the highest quintile/ poorest environmental quality to the lowest quintile/best environmental quality for the overall EQI (IRD, 10.17; 95% CI, 0.84-19.50; and IRD, 7.29; 95% CI, 3.05-11.54, respectively). Lung cancer in male subjects was negatively associated with environmental quality (IRD, 28.66; 95% CI, 212.95 to 24.83). RUCC stratified analyses demonstrated similar trends.
When considering domain-specific associations with site-specific cancers, again comparing the highest quintile to the lowest quintile, prostate cancer demonstrated posi-tive associations in the air domain (IRD, 10.09; 95% CI, 1.84-18.34), built domain (IRD, 8.98; 95% CI, 2.54-15.41), and sociodemographic domain (IRD, 10.39; 95% CI, 3.38-17.41). Prostate cancer also demonstrated positive associations with the air and built domains in all RUCC strata except the thinly populated stratum (Sup-porting Fig. 2). Prostate cancer was negatively associated with the sociodemographic domain in the metropolitan urban stratum but positively associated in all other RUCC strata.
Breast cancer in female subjects demonstrated trends similar to those for prostate cancer in male subjects. Breast cancer was positively associated with poor air quality (IRD, 3.69; 95% CI,20.35 to 7.73), poor built environ-ment (IRD, 5.59; 95% CI, 2.04-9.14), and poor sociode-mographic environment (IRD, 5.01; 95% CI, 0.82-9.20). Again, considering RUCC stratification, breast cancer demonstrated positive associations with the air and built domains in all RUCC strata except the thinly
Figure 2. Incidence rate differences (95% confidence inter-vals) for all site cancer, 2006-2010, for domain-specific indi-ces (air, water, land, built, and sociodemographic [SD] domains) by urban/rural continuum (RUCC1, metropolitan urbanized; RUCC2, non-metropolitan urbanized; RUCC3, less urbanized; and RUCC4, thinly populated) using quintile 1 (best environmental domain quality) as a reference and adjusting for county percentage of population that ever smoked and all other environmental domain indices.
Environment and Cancer Incidence/Jagai et al
populated stratum and was negatively associated with the sociodemographic domain in the metropolitan urban stratum but positively associated in all other RUCC strata (Supporting Fig. 3).
The analysis demonstrated that lung cancer was pos-itively associated with the air domain for both male and female subjects. These associations were highest in the non-metropolitan urbanized and less urbanized strata (IRD, 12.78; 95% CI, 3.95-21.61; and IRD, 8.50; 95% CI, 2.12-14.88, respectively) for male subjects and the metropolitan urbanized stratum (IRD, 5.01; 95% CI, 1.31-8.71) for female subjects. Otherwise, effect estimates for lung cancer for both male and female subjects were negative or near null for all other domains and varied greatly for all domains when analyses were stratified by RUCC (Supporting Figs. 2 and 3).
The analysis demonstrated that colorectal cancer was negatively associated with the air, built, and sociode-mographic domains for both male and female subjects. However, effect estimates varied greatly for all domains when analyses were stratified by RUCC (Supporting Figs. 2 and 3). Colorectal cancer was negatively associated with poor water quality for both male and female subjects (IRD, 24.45; 95% CI, 27.73 to 21.16; and IRD, 23.38; 95% CI,26.00 to20.76, respectively). Associa-tions were also negative for all RUCC strata except the thinly populated stratum for both male and female subjects.
DISCUSSION
We observed positive associations between the EQI, a metric of cumulative environmental exposure, and all-site cancer incidence rates, overall and in both male and female subjects. Associations differed by rural/urban sta-tus and by the 5 environmental domains considered. The highest associations were seen in the air, built, and socio-demographic domains, suggesting these domains are driv-ing the associations with cancer outcomes. Associations in the most urbanized areas were highest for both male and female subjects and across the domain-specific indices. When site-specific cancers were considered, the highest positive associations were seen for prostate cancer in male subjects and breast cancer in female subjects.
Genetic variation alone does not account for all can-cer outcomes, but instead interacts with harmful environ-mental exposures, modifying the effects of these exposures and risk of cancer.3-5Environmental exposures can alter or interfere with a variety of biological processes, includ-ing hormone production and function, inflammation, DNA damage, and gene suppression or overexpression.4,9
Analysis of data on twins suggests that the genetic contri-bution to cancer is approximately 50%, allowing for a sig-nificant role of environmental exposures.6,8Both breast and prostate cancers are associated with environmental exposures such as ionizing radiation and solvents.16-18 Our findings also show positive relationships between incidence of breast and prostate cancer and environmental quality. Lung cancer is associated with air pollution expo-sures such as diesel exhaust14,15and polycyclic aromatic hydrocarbons.37Our findings demonstrate positive asso-ciations between lung cancer incidence in male subjects and poor air quality. Lung cancer has also been shown to be associated with land pollutants such as radon10,11and pesticides12,13; however, we did not observe associations with lung cancer and the land domain index.
Environmental health research has used indices to represent multiple variables with a single quantitative measure. This methodology has most commonly been used to represent the built and social environments to describe neighborhood differences.38,39 Air pollution studies have also used an index to examine complex mix-tures of air pollutants.40 These cumulative metrics have been associated with various health outcomes, including preterm birth.38-40 Measuring a single environmental exposure does not fully capture the health effects resulting from the overall burden of environmental exposures. Rather, environmental exposures occur simultaneously and work through multiple mechanisms to result in can-cer. This is the first study, of which we are aware, to use an index of environmental quality to assess the burden of cumulative environmental exposures on cancer incidence.
Index development methods have typically been used within a single environmental domain but not to assess simultaneous burden across environmental domains. The EQI is a novel metric of cumulative envi-ronmental exposures which was developed using publical-ly available data. However, combining data across domains is challenging for several reasons. Environmental data are often collected for administrative and regulatory purposes and therefore may not provide the spatial and/or temporal coverage to properly assess health outcomes.41 For both the development of the EQI and this analysis, data were better represented in urban areas compared with suburban and rural areas.
The use of an ecological exposure metric is both a limitation and strength of this analysis. The EQI repre-sents the period 2000-2005 and reflects exposures occur-ring before cancer incidence assessed in this analysis, but there are varying and long lag periods associated with the development of cancer. The EQI is a rank index and can
be representative of environmental quality over time. Sen-sitivity analyses have shown little change in county rank-ings over time; however, we did not assess changes over more than 10 years, which may be possible lag periods for cancer development. In addition, the ecological nature of this analysis does not allow us to account for individual level confounders such as alcohol use, physical activity, and nutrition, which may bias results. However, the use of a broad ecological exposure metric is also a strength of this analysis because of the ability to assess the cumulative environment. The EQI considers hundreds of mental exposures simultaneously across multiple environ-mental domains, including the sociodemographic environment, which is often neglected when considering environmental exposures. In addition, we were able to leverage publically available exposure and outcome data to assess relationships between environmental quality and cancer incidence on a national level.
In conclusion, our county-level analyses demonstrat-ed positive associations between cumulative environmen-tal quality and cancer incidence for all rural/urban strata. The results were mixed for domain-specific indices; for breast and prostate cancer incidence, results were strongest in the air domain. Our analyses suggest that cumulative environmental quality can influence cancer risk and that associations vary by urbanicity. Our study addresses the current appeal for research that expands beyond single exposures by using the EQI, a novel index representing 5 environmental domains.42,43 This study demonstrates that focusing on single environmental exposures in cancer development, though necessary to understand specific mechanisms, may not address the broader environmental context in which cancers develop and that future research should address the impact of cumulative environmental exposures.
FUNDING SUPPORT
This study was funded in part by the Office of Research and Devel-opment, US Environmental Protection Agency (Contracts EP09D000003 and EP12D000264 to L.C.M.) and by an appoint-ment to the Internship/Research Participation Program at Office of Research and Development (National Health and Environmental Effects Research Laboratory), US Environmental Protection Agen-cy, administered by the Oak Ridge Institute for Science and Educa-tion through an interagency agreement between the US Department of Energy and US Environmental Protection Agency.
CONFLICT OF INTEREST DISCLOSURES
The authors made no disclosures.
AUTHOR CONTRIBUTIONS
Jyotsna S. Jagaiconceived the study, led the analysis, and led the writing of the manuscript.Lynne C. Messer, Kristen M. Rap-pazzo,Christine L. Gray,Shannon C. Grabich, andDanelle T. Lobdellparticipated in the development of the exposure metric, study design, interpretation of results, and contributed to the writ-ing of the manuscript.
REFERENCES
1. Siegel R, Naishadham D, Jemal A. Cancer statistics, 2013. CA Cancer J Clin.2014;63:11-30.
2. National Heart, Lung, and Blood Institute. Fact Book: Fiscal Year 2008. Bethesda, MD: National Institutes of Health; 2009.
3. Tomasetti C, Vogelstein B. Cancer etiology. Variation in cancer risk among tissues can be explained by the number of stem cell divisions.
Science.2015;347:78-81.
4. Wallace TA, Martin DN, Ambs S. Interactions among genes, tumor biology and the environment in cancer health disparities: examining the evidence on a national and global scale.Carcinogenesis.2011;32: 1107-1121.
5. Wu S, Powers S, Zhu W, Hannun YA. Substantial contribution of extrinsic risk factors to cancer development. Nature. 2016;529: 43-47.
6. Amundadottir LT, Thorvaldsson S, Gudbjartsson DF, et al. Cancer as a complex phenotype: pattern of cancer distribution within and beyond the nuclear family.PLoS Med.2004;1:e65.
7. Lichtenstein P, Holm NV, Verkasalo PK, et al. Environmental and heritable factors in the causation of cancer—analyses of cohorts of twins from Sweden, Denmark, and Finland.N Engl J Med. 2000; 343:78-85.
8. Risch N. The genetic epidemiology of cancer: interpreting family and twin studies and their implications for molecular genetic approaches.Cancer Epidemiol Biomarkers Prev.2001;10:733-741. 9. Irigaray P, Newby JA, Clapp R, et al. Lifestyle-related factors and
environmental agents causing cancer: an overview.Biomed Pharmac-other.2007;61:640-658.
10. de Groot P, Munden RF. Lung cancer epidemiology, risk factors, and prevention.Radiol Clin North Am.2012;50:863-876.
11. Torres-Duran M, Barros-Dios JM, Fernandez-Villar A, Ruano-Ravina A. Residential radon and lung cancer in never smokers. A systematic review.Cancer Lett.2014;345:21-26.
12. Bassil KL, Vakil C, Sanborn M, Cole DC, Kaur JS, Kerr KJ. Cancer health effects of pesticides: systematic review. Can Fam Physician.
2007;53:1704-1711.
13. Blair A, Freeman LB. Epidemiologic studies in agricultural popula-tions: observations and future directions. J Agromedicine. 2009;14: 125-131.
14. Sun Y, Bochmann F, Nold A, Mattenklott M. Diesel exhaust expo-sure and the risk of lung cancer—a review of the epidemiological evidence.Int J Environ Res Public Health.2014;11:1312-1340. 15. Tsoi CT, Tse LA. Professional drivers and lung cancer: a systematic
review and meta-analysis.Occup Environ Med.2012;69:831-836. 16. Clapp RW, Jacobs MM, Loechler EL. Environmental and
occupa-tional causes of cancer: new evidence 2005-2007. Rev Environ Health.2008;23:1-37.
17. Golubicic I, Borojevic N, Pavlovic T. Risk factors for breast cancer: is ionizing radiation among them?J Buon.2008;13:487-494. 18. Gray J, Evans N, Taylor B, Rizzo J, Walker M. State of the
evi-dence: the connection between breast cancer and the environment.
Int J Occup Environ Health.2009;15:43-78.
19. Boscoe FP, Johnson CJ, Sherman RL, Stinchcomb DG, Lin G, Henry KA. The relationship between area poverty rate and site-specific cancer incidence in the United States. Cancer. 2014;120: 2191-2198.
20. Henry KA, Sherman R, Farber S, Cockburn M, Goldberg DW, Stroup AM. The joint effects of census tract poverty and geographic access on late-stage breast cancer diagnosis in 10 US States.Health Place.2013;21:110-121.
Environment and Cancer Incidence/Jagai et al
21. Erhunmwunsee L, Joshi MB, Conlon DH, Harpole DH Jr. Neigh-borhood-level socioeconomic determinants impact outcomes in non-small cell lung cancer patients in the Southeastern United States.
Cancer.2012;118:5117-5123.
22. Belpomme D, Irigaray P, Hardell L, et al. The multitude and diver-sity of environmental carcinogens.Environ Res.2007;105:414-429. 23. Felter SP, Conolly RB, Bercu JP, et al. A proposed framework for
assessing risk from less-than-lifetime exposures to carcinogens. Crit Rev Toxicol.2011;41:507-544.
24. Messer LC, Jagai JS, Rappazzo KM, Lobdell DT. Construction of an environmental quality index for public health research. Environ Health.2013;13:39.
25. Peters A, Hoek G, Katsouyanni K. Understanding the link between environmental exposures and health: does the exposome promise too much?J Epidemiol Community Health.2012;66:103-105.
26. US Environmental Protection Agency. Environmental Quality Index. Washington, DC: US Environmental Protection Agency; 2015. 27. Lobdell DT, Jagai JS, Rappazzo K, Messer LC. Data sources for an
environmental quality index: availability, quality, and utility. Am J Public Health.2011;101(suppl 1):S277-S285.
28. Hall SA, Kaufman JS, Ricketts TC. Defining urban and rural areas in U.S. epidemiologic studies.J Urban Health.2006;83:162-175. 29. National Cancer Institute. State cancer profiles.
https://statecancer-profiles.cancer.gov. Accessed June 10, 2015.
30. National Cancer Institute. Cancer Stat Fact Sheets. http://seer.can-cer.gov/statfacts/. Accessed November 11, 2015.
31. US Department of Agriculture. Rural-urban continuum codes: eco-nomic research service. Washington, DC: US Department of Agri-culture; 2015.
32. Langlois PH, Jandle L, Scheuerle A, Horel SA, Carozza SE. Occur-rence of conotruncal heart birth defects in Texas: a comparison of urban/rural classifications.J Rural Health.2010;26:164-174.
33. Langlois PH, Scheuerle A, Horel SA, Carozza SE. Urban versus rural residence and occurrence of septal heart defects in Texas. Birth Defects Res A Clin Mol Teratol.2009;85:764-772.
34. Luben TJ, Messer LC, Mendola P, Carozza SE, Horel SA, Langlois PH. Urban-rural residence and the occurrence of neural tube defects in Texas, 1999-2003.Health Place.2009;15:848-854.
35. Messer LC, Luben TJ, Mendola P, Carozza SE, Horel SA, Langlois PH. Urban-rural residence and the occurrence of cleft lip and cleft palate in Texas, 1999-2003.Ann Epidemiol.2010;20:32-39. 36. Poole C. On the origin of risk relativism.Epidemiology.2009;21:3-9. 37. Wagner M, Bolm-Audorff U, Hegewald J, et al. Occupational polycyclic aromatic hydrocarbon exposure and risk of larynx cancer: a systematic review and meta-analysis.Occup Environ Med.2015;72:226-233. 38. Messer LC, Laraia BA, Kaufman JS, et al. The development of a
standardized neighborhood deprivation index.J Urban Health.2006; 83:1041-1062.
39. Miranda ML, Messer LC, Kroeger GL. Associations between the quality of the residential built environment and pregnancy outcomes among women in North Carolina. Environ Health Perspect. 2012; 120:471-477.
40. Wilhelm M, Ghosh JK, Su J, Cockburn M, Jerrett M, Ritz B. Traf-fic-related air toxics and term low birth weight in Los Angeles Coun-ty, California.Environ Health Perspect.2011;120:132-138.
41. Jagai JS, Rosenbaum BJ, Pierson SM, et al. Putting regulatory data to work at the service of public health: utilizing data collected under the clean water act.Water Qual Expo Health.2013;5:117-125. 42. Morello-Frosch R, Zuk M, Jerrett M, Shamasunder B, Kyle AD.
Understanding the cumulative impacts of inequalities in environ-mental health: implications for policy.Health Aff (Millwood).2011; 30:879-887.
43. Olden K, White SL. Health-related disparities: influence of environ-mental factors.Med Clin North Am.2005;89:721-738.
![Figure 2. Incidence rate differences (95% confidence inter- inter-vals) for all site cancer, 2006-2010, for domain-specific indi-ces (air, water, land, built, and sociodemographic [SD]](https://thumb-us.123doks.com/thumbv2/123dok_us/8317138.2203774/7.904.88.433.128.672/figure-incidence-differences-confidence-cancer-domain-specific-sociodemographic.webp)
