Study of Crystallization Process in Se
80
In
10
Pb
10
by
Iso-Conversional Methods
Indra Sen Ram, Kedar Singh*
Department of Physics, Faculty of Science, Banaras Hindu University, Varanasi, India. Email: *[email protected]
Received September 5th, 2012; revised October 9th, 2012; accepted October 19th, 2012
Copyright © 2013 Indra Sen Ram, Kedar Singh. This is an open access article distributed under the Creative Commons Attribution License, which permits unrestricted use, distribution, and reproduction in any medium, provided the original work is properly cited.
ABSTRACT
The crystallization kinetics of Se80In10Pb10 chalcogenide glass is studied using differential scanning calorimeter (DSC)
at different heating rates (5, 10, 15 and 20 K/min) under non-isothermal conditions. Four iso-conversional methods (Kissinger-Akahira-Sunose, Flynn-Wall-Ozawa, Tang and Straink) were used to determine various kinetic parameters: crystallization temperature (Tα), activation energy of crystallization (Eα), Avrami exponent (nα) in non-isothermal mode.
The transformation from amorphous to crystalline phase in Se80In10Pb10 is considered as a single step reaction
mecha-nism.
Keywords: Iso-Conversional; Crystallization Kinetics; Activation Energy; Avrami Exponent
1. Introduction
The chalcogenide glasses have drawn a great attention since last 5 - 6 decades due to their wide range of appli- cations in various fields [1]. These glasses are amorphous semiconductor in nature and transparent to infrared re- gion of electromagnetic wave (radiation) and reveal uni- que electrical and optical properties. Due to these pro- perties, the chalcogenide glasses are useful for several applications such as threshold switching, memory swi- tching, inorganic photoreceptors and optical wave guide [2,3]. The reversible transformation property of Selenium (Se) based chalcogenide alloys makes these alloys very useful in optical memory devices, X-ray imaging and photonics [4]. But glassy Se has some shortcoming such as low photosensitivity and low thermal stability. The various additives with glassy Se produce binary chalco- genide glassy system e.g., Se-In, Se-Te, Se-Ge, Se-S, Se-Sb and others [5-8]. These are of great interest due to better hardness, better stability, higher sensitivity and change (higher or lower) in crystallization ability. The addition of third element expands the glass forming area and also causes configurationally disorder in the system. The thermal behavior of the chalcogenide glasses plays an important role in determining the transport mechanism, thermal stability and useful applications. The differential
scanning calorimeter (DSC) technique has so for been employed to study the crystallization process in amor-phous alloys and proved to be the most effective method for such studies [9]. The DSC can be used eighter in iso-thermal mode or in non isoiso-thermal mode. The drawback of later is that the analysis of non isothermal experiments is generally more complicated than isothermal one [9,10]. However, in isothermal experiments it is impossible to reach a test temperature instantaneously [11]. Iso-Con-versional methods are used for non isothermal analysis, in which the transformation rate at a constant crystallized fraction is only a function of temperature as suggested by Vyazovkin et al. [12-15] and other workers [16,17]. Iso- Conversional techniques make it possible to estimate the activation energy of a process as function of the crystal- lized fraction α. Analysis of the activation energy de- pendence on α provides important clues about reaction mechanism. Therefore, the activation energies for such processes can logically not be same and it may vary with degree of conversion [18].
In the present study, we report the crystallization ki- netics of Se80In10Pb10 chalcogenide glass. The activation
energy was determined using four iso-conversional me- thods (Kissinger-Akahira-Sunose (KAS), Flynn-Wall- Ozawa (FWO), Tang and Straink). The Avrami exponent also has been determined to study nucleation and growth during crystallization process.
the ampoule was frequently rocked to ensure the homo- geneity of alloying materials. After the above said period, the ampoule with molten materials was rapidly quenched into ice cooled water. The ingot of glassy material was taken out from ampoule by breaking them. The X-ray diffraction pattern of as prepared material was recorded using Philips PW-1830 Diffractometer with Cu-Kα(λ =
1.54 Å) to confirm the amorphous nature of prepared glass. The XRD pattern of Se80In10Pb10 chalcogenide
glass is shown in Figure 1. The absence of sharp struc-
tural peak confirms the amorphous nature of Se80In10Pb10
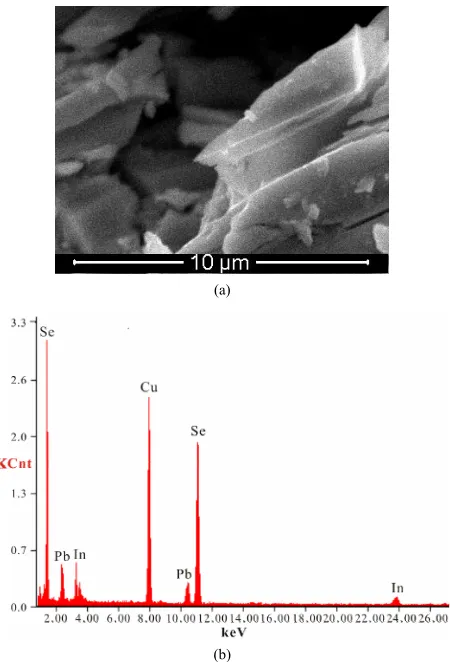
chalcogenide glass. The surface morphology of Se80In10Pb10 chalcogenide glass was done by using Scan-
ning Electron Microscopy (SEM) (Model: Quanta 200). The SEM image is shown in Figure 2(a). This again
confirms the amorphous nature of prepared glass. The composition of Se80In10Pb10 chalcogenide glass is also
confirmed by using an energy dispersive X-ray analysis (EDAX). The EDAX spectrum of Se80In10Pb10 is shown
in Figure 2(b). The crystallization kinetics of prepared
chalcogenide glass was studied by using differential scanning calorimeter (DSC) (Model: Shimadzu DSC60) at different heating rates of 5, 10, 15 and 20 K/min. The accuracy of the heat flow in instrument is ±0.01 mW and temperature precision of instrument is ±0.1 K with an average standard error ±1 K in measured values (glass transition, crystallization and melting temperatures). The DSC was calibrated prior to the measurement using high purity standard Indium (In) with well known melting point.
3. Results and Discussions
The DSC thermograms of Se80In10Pb10 chalcogenide
glass at different heating rates (5, 10, 15 and 20 K/min) are shown in Figure 3. The DSC thermograms at each
heating rate shows a well-defined endothermic peak at the glass transition temperature Tg and an exothermic
peak at the crystallization temperature Tc. The crystal-
[image:2.595.322.523.84.260.2]lized fraction α at a given temperature T is given as α= (AT/A), where A is the total area of the exothermic
Figure 1. XRD pattern of Se80In10Pb10 chalcogenide glass.
(a)
(b)
Figure 2. (a) SEM image and (b) EDAX spectrum of Se80In10Pb10 chalcogenide glass.
peak between the onset temperature (Ti) where crystalli-
zation just begins and the temperature (Tf) where the
crystallization is completed. AT is the area between Ti and
T. The values of T corresponding to α are listed in Table 1. From Table 1 we observe a systematic shift in T to
[image:2.595.312.537.284.615.2]Figure 3. DSC thermograms of Se80In10Pb10 chalcogenide
glass at different heating rates.
Table 1. The values of temperature in crystallization region for different crystallized fraction Se80In10Pb10 chalcogenide
glass at different heating rates.
Temperature (K) Crystallized
fraction (α) 5 K/min 10 K/min 15 K/min 20 K/min
0.1 391.1 398.7 417.9 425.4
0.2 396.2 405.4 426.1 434.0
0.3 400.7 410.8 432.6 440.4
0.4 404.9 415.9 437.8 445.8
0.5 408.5 420.8 442.5 450.8
0.6 412.0 425.5 446.8 455.2
0.7 415.4 430.2 451.2 459.8
0.8 418.9 435.3 455.9 465.0
0.9 423.0 441.5 461.9 471.3
1.0 434.1 459.0 476.4 485.0
shown in Figure 4. Figure 4 shows the degree of crys-
tallization as a function of temperature at different heat- ing rates.
The kinetics of crystallization in amorphous material can be described by the following rate equation [19]:
d dtK T f (1) where, K is the reaction rate constant usually has Ar- rhenius temperature dependence, f
is the reaction model, t is time and αis the crystallized fraction.But reaction rate constant K is given by following equation:
exp.0
K T K E RT (2) where, K0 is pre-exponential factor of rate constant, E is
activation energy, T is temperature and R is universal gas constant.
Under non-isothermal condition with a constant heat- ing rate = d dT t and using Equation (2), Equa-
Figure 4. Graphs of α versus temperature T for Se80In10Pb10
chalcogenide glass.
tion (1) can be written as:
0
d dT d d 1t K exp. E RT f (3) There is a variety of theoretical models and mathe- matical equations to explain the estimation of crystalliza- tion kinetics. The following four iso-conversional meth- ods have been used in present study to analyze the crys- tallization kinetics of Se80In10Pb10 chalcogenide glass. All
the four methods require the determination of the tem- perature Tαi at which a fixed fraction α of the total amount
is transformed.
3.1. Kissinger-Akahira-Sunose (KAS) Method
In KAS method, the relation between the temperature Tαi
and heating rate βi is given by [20,21];
2
ln i Ti E RT iConstant (4)
The subscript i denotes different heating rates. For each degree of the conversion α, a corresponding Tαiand heat-
ing rates are used. The graphs of ln
i T2i
versus1000/Tαifor Se80In10Pb10 chalcogenide glass are shown in Figure 5. From the slopes of straight lines obtained in Figure 5, we have evaluated the value of Eα.The
ob-tained values of Eαare listed in Table 2.
3.2. Flynn-Wall-Ozawa (FWO) Method
In FWO method, the relation between the temperature Tαi
and heating rate βi is given by [22-24];
i
ln 1.052 E RT i Constant (5)
The graphs of ln(βi) versus 1000/Tαifor Se80In10Pb10
chalcogenide glass are shown in Figure 6. From the
slopes of straight lines obtained in Figure 6, we have
evaluated the value of Eα.The obtained values of Eαare
Figure 5. Graphs of ln
i T2i
versus 1000/Tαi forSe80In10Pb10 chalcogenide glass.
Figure 6. Graphs of ln(βi) versus 1000/Tαi for Se80In10Pb10
chalcogenide glass.
Table 2. The values of activation energy of crystallization of Se80In10Pb10 chalcogenide glass at different crystallized fra-
ction (α) for different iso-conversional methods.
Eα ( k J/mol)
Crystallized
fraction (α) KAS method
FWO method
Tang method
Straink method
0.1 42.92 47.24 43.22 43.16
0.2 40.09 44.64 41.65 40.33
0.3 39.17 43.87 39.48 39.41
0.4 39.18 43.96 39.56 39.44
0.5 39.12 43.97 39.44 39.38
0.6 39.45 44.34 39.78 39.71
0.7 39.47 44.42 39.80 39.74
0.8 39.14 44.18 39.47 39.43
0.9 38.44 43.59 38.76 38.71
In Straink method [26,27], the relation between the tem- perature Tαiand heating rate βi is given by;
1.92
i
ln Ti 1.0008 E RT i Constant (7)
The graphs of
1.92
iln Ti versus 1000/Tαi for
Se80In10Pb10 chalcogenide glass are shown in Figure 8.
From the slopes of straight lines obtained in Figure 8, we
have evaluated the value of Eα. The obtained values of Eα
are listed in Table 2.
The purpose of apply four different iso-conversional methods for evaluation of Eα is to check the validity of
the four methods. The values of Eα obtained by the four
methods are in good agreement. There is an about 1% experimental error in the evaluation of Eα by all four
methods. The Kissinger-Akahira-Sunose (KAS) method is sometimes called generalized Kissinger method is one of the best iso-conversional method [28]. It is clear from
Table 2 that the activation energy shows a little variation
with α and T in these four methods. If the values of Eα
are independent of α, the crystallization process is domi- nated by a single step reaction mechanism [29]; on the other hand, a considerable variation of Eα with α could
Figure 7. Graphs of
1.895
ln i Ti versus 1000/Tαi for
Figure 8. Graphs of
1.92ln
i
i T
versus 1000/Tαi forSe80In10Pb10 chalcogenide glass.
be explained in terms of multi-step reaction me- chanism [30,31]. If the relative error of the Eα evaluated from
iso-conversional method is lower than 10%, then the values of Eα can be considered as independent of α [32].
From Table 2, it is seen that the values of Eαat different
crystallized fraction evaluated by four iso-conversional methods vary here by about 7.9, 6.2, 7.7 and 8.1%, re-spectively. So, the crystallization process could be con-sidered as a single step reaction mechanism. The varia-tion of the activavaria-tion energy with temperature demon-strates that the rate of crystallization is actually deter- mined by the rates of two processes; nucleation and dif- fusion. Because these two mechanisms are likely to have different activation energies, the effective activation en- ergy of the transformation will vary with temperature [17,33]. This interpretation is based on the nucleation theory proposed by Fisher and Turnbull [34]. It is clear from the observed temperature dependence of the activa- tion energy in Se80In10Pb10 glass that the amorphous to
crystallization can be described by single-step reaction mechanism.
The Avrami exponent can be calculated from the fol- lowing equation [35]:
ln
ln 1
1n R E T (8) The evaluated values of the Avrami exponent nα are
listed in Table 3. It is clear from Table 3 that nα decreases
with increasing temperature. It is well known that crys- tallization of chalcogenide glasses is associated with nu- cleation and growth process. The degree of crystallization increases with increase in temperature. In other words, it attains its maximum value 1. The decrease in value of nα
[image:5.595.307.538.121.279.2]with increasing temperature suggests that the character of crystallization changes from nucleation-driven in the beginning to essentially a growth-driven regime by the end of crystallization process.
Table 3. The values of local Avrami exponent n(α) of Se80In10Pb10 chalcogenide glass at different crystallized fra-
ction (α) for different heating rates.
n(α)
Crystallized
fraction (α) 5 K/min 10 K/min 15 K/min 20 K/min
0.1 4.42 3.50 3.04 3.12
0.2 4.08 3.37 3.08 3.12 0.3 3.22 2.81 2.87 2.88 0.4 2.96 2.43 2.72 2.69
0.5 2.92 2.29 2.70 2.68 0.6 2.86 2.24 2.67 2.68 0.7 2.96 2.24 2.66 2.56 0.8 3.18 2.31 2.69 2.59
0.9 3.35 2.40 2.72 2.70
4. Conclusions
1)The activation energy as determined from the four iso-conversional methods was found to be varying in the same way and show a little variation with crystallized fraction and temperature.
2)The Avrami exponent nαalso show a little variation
with crystallized fraction and temperature.
3) The transformation from amorphous to crystalline phase in Se80In10Pb10 is a single-step mechanism.
5. Acknowledgements
ISR is thankful to the Principal, Dyal Singh College, University of Delhi, New Delhi for sanctioned study leave to carry out research work. We are also thankful to CSIR, New Delhi for providing financial assistance un- der research project no. 01(2456)/11/EMR-II to carry out research work.
REFERENCES
[1] A. B. Seddon, “Chalcogenide Glasses: A Review of Their Preparation, Properties and Applications,” Journal of Non- Crystalline Solids, Vol. 184, No. 5, 1995, pp. 44-50. doi:10.1016/0022-3093(94)00686-5
[2] P. Nemec and M. Frumar, “Synthesis and Properties of Pr3+-Doped Ge-Ga-Se Glasses,” Journal of
Non-Crystal-line Solids, Vol. 299-302, No. 2, 2002, pp. 1018-1022. doi:10.1016/S0022-3093(01)01127-9
[3] Y. G. Ghoi, K. H. Kim, B. J. Park and J. Heo, “1.6 mm Emission from Pr3+: (3F
3, 3F4) 3H4 Transition in Pr3+- and Pr3+/Er3+ -Doped Selenide Glasses,” Applied Physics
Letters, Vol. 78, No. 9, 2001, pp. 1249-1252.
[4] J. Rowlands and S. Kasap, “Amorphous Semiconductors Usher in Digital X-Ray Imaging,” Physics Today, Vol.50, No. 11, 1997, pp. 24-30. doi:10.1063/1.881994
Chal-genide Glasses,” Journal of Thermal Analysis Calori- metry, Vol. 87, No. 2, 2007, pp. 343-348.
doi:10.1007/s10973-005-7411-3
[9] M. J. Straink, “Analysis of Aluminium-Based Alloys by Calorimetry: Quantitative Analysis of Reactions and Re-action Kinetics,” International Materials Reviews, Vol. 49, No. 3-4, 2004, pp. 191-226.
doi:10.1179/095066004225010532
[10] A. A. Joraid, “Estimating the Activation Energy for the Non-Isothermal Crystallization of an Amorphous Se9.1Te20.1- Se70.8 Alloy”, Thermochimica Acta, Vol. 456, No. 1, 2007, pp. 1-6.doi:10.1016/j.tca.2007.01.023
[11] L. Liu, F. W. Zhi and L. Chen, “A Kinetic Study of the Non-Isothermal Crystallization of a Zr-Based Bulk Me-tallic Glass,” Chinese Physics Letters, Vol. 19, No. 10, 2002, pp. 1483-1486. doi:10.1088/0256-307X/19/10/326 [12] S. Vyazovkin, “Modification of the Integral
Isoconver-sional Method to Account for Variation in the Activation Energy,” Journal of Computational Chemistry, Vol. 22, No. 2, 2001, pp. 178-183.
[13] S. Vyazovkin and C. A. Wight, “Isothermal and Non- Isothermal Reaction Kinetics in Solids: In Search of Ways toward Consensus,” Journal of Physical Chemistry A, Vol. 101, No. 44, 1997, pp. 8279-8284.
doi:10.1021/jp971889h
[14] S. Vyazovkin and C. A. Wight, “Model-Free and Model- Fitting Approaches to Kinetic Analysis of Isothermal and Non-Isothermal Data,” Thermochimica Acta, Vol. 340- 341, No. 12, 1999, pp. 53-68.
doi:10.1016/S0040-6031(99)00253-1
[15] S. Vyazovkin, “Advanced Isoconversional Methods,”
Journal of Thermal Analysis, Vol. 49, No. 3, 1997, pp. 1493-1499. doi:10.1007/BF01983708
[16] B. S. Patil, et al., “On the Crystallization Kinetics of In Additive Se-Te Chalcogenide Glasses,” Thermochimica Acta, Vol. 513, No. 1-2, 2011, pp. 1-8.
doi:10.1016/j.tca.2010.09.009
[17] C. Dohre and N. Mehta, “Iso-Conversional Kinetic Study of Non-Isothermal Crystallization in Glassy Se98Ag2 Al-loy,” Journal of Thermal Analysis and Calorimetry, Vol. 102, No. 1, 2012, pp. 247-253.
doi:10.1007/s10973-011-1696-1
[18] S. Vyazovkin, “A Unified Approach to Kinetic Process-ing of Nonisothermal Data,” International Journal of
[22] M. E. Brown and P. K. Gallagher, “Hand Book of Ther-mal Analysis and Calorimetry,” Elsevier, Amsterdam, 2008.
[23] T. Ozawa, “Kinetics of Non-Isothermal Crystallization,”
Polymer, Vol. 12, No. 3, 1971, pp. 150-158. doi:10.1007/s10973-006-8486-1
[24] T. Ozawa, “A New Method of Analyzing Thermo Gra-vimetric Data,” Bulletin of the Chemical Society of Japan, Vol. 38, No. 11, 1965, pp. 1881-1886.
doi:10.1246/bcsj.38.1881
[25] T. Wanjun and C. Donghua, “An Integral Method to De-termine Variation in Activation Energy with Extent of Conversion,” Thermochimica Acta, Vol. 443, No. 1-2, 2005, pp. 72-76. doi:10.1016/j.tca.2005.02.004
[26] M. J. Starink, “The Determination of Activation Energy from Linear Heating Rate Experiments: A Comparison of the Accuracy of Isoconversion Methods,” Thermochimica Acta, Vol. 404, No. 1-2, 2003, pp. 163-176.
doi:10.1016/S0040-6031(03)00144-8
[27] M. J. Starink, “Comments on Precipitation Kinetics of Al-1.12Mg2Si-0.35Si and Al-1.07Mg2Si-0.33Cu Alloys,”
Journal of Alloys and Compounds, Vol. 443, No. 1-2, 2007, pp. L4-L6. doi:10.1016/j.jallcom.2006.06.069 [28] E. Marian, B. Tita, T. Jurca, A. Fulias, L. Vicas and D.
Tita, “Thermal Behaviour of Erythromycin-Active Sub-stance and Tablets. Part 1. Kinetic Study of the Active Substance under Non-Isothermal Conditions,” Journal of Thermal Analysis and Calorimetry, Vol. 111, No. 2, 2013, pp. 1025-1031. doi:10.1007/s10973-012-2284-8
[29] B. Boonchom, “Kinetics and Thermodynamic Properties of the Thermal Decomposition of Manganese Dihydro-genphosphate Dihydrate,” Journal of Chemical and En-gineering Data, Vol. 53, No. 7, 2008, pp. 1533-1538. doi:10.1021/je800103w
[30] X. Gao and D. Dollimore, “The Thermal Decomposition of Oxalates: Part 26. A Kinetic Study of the Thermal De-composition of Manganese(II) Oxalate Dihydrate,” Ther- mochimica Acta, Vol. 215, No. 2, 1993, pp. 47-63. doi:10.1016/0040-6031(93)80081-K
[31] L. T. Vlaev, M. M. Nikolova and G. G. Gospodinov, “Non-Isothermal Kinetics of Dehydration of Some Se-lenite Hexahydrates,” Journal of Solid State Chemistry, Vol. 177, No. 8, 2004, pp. 2663-2669.
doi:10.1016/j.jssc.2004.04.036
MgHPO4·3H2O by Non-Isothermal Decomposition Data,”
Journal of Thermal Analysis and Calorimetry, Vol. 98, No. 3, 2009, pp. 863-871.
doi:10.1007/s10973-009-0108-2
[33] S. Vyazovkin and I. Dranca, “Isoconversional Analysis of Combined Melt and Glass Crystallization Data,” Macro-molecular Chemistry and Physics, Vol. 207, No. 1, 2006, pp. 20-25. doi:10.1002/macp.200500419
[34] J. C. Fisher and D. Turnbull, “Rate of Nucleation in Con-densed Systems,” Journal of Chemical Physics, Vol. 17, No. 4, 1949, p. 71. doi:10.1063/1.1747279