http://wrap.warwick.ac.uk
Original citation:
Roberts, Stephen, Wright, Steven A.,
Lecomber, David, January, Christopher, Byrd,
Jonathan, Oro, Xavier and Jarvis, Stephen A., 1970- (2015) POSE : A mathematical and
visual modelling tool to guide energy aware code optimisation. In: The 6th International
Green and Sustainable Computing Conference (IGSC' 15), Las Vegas, USA, 14-16 Dec
2015 (In Press)
Permanent WRAP url:
http://wrap.warwick.ac.uk/72793
Copyright and reuse:
The Warwick Research Archive Portal (WRAP) makes this work by researchers of the
University of Warwick available open access under the following conditions. Copyright ©
and all moral rights to the version of the paper presented here belong to the individual
author(s) and/or other copyright owners. To the extent reasonable and practicable the
material made available in WRAP has been checked for eligibility before being made
available.
Copies of full items can be used for personal research or study, educational, or not-for
profit purposes without prior permission or charge. Provided that the authors, title and
full bibliographic details are credited, a hyperlink and/or URL is given for the original
metadata page and the content is not changed in any way.
Publisher’s statement:
“© 2015 IEEE. Personal use of this material is permitted. Permission from IEEE must be
obtained for all other uses, in any current or future media, including reprinting
/republishing this material for advertising or promotional purposes, creating new
collective works, for resale or redistribution to servers or lists, or reuse of any
copyrighted component of this work in other works.”
A note on versions:
The version presented here may differ from the published version or, version of record, if
you wish to cite this item you are advised to consult the publisher’s version. Please see
the ‘permanent WRAP url’ above for details on accessing the published version and note
that access may require a subscription.
POSE: A Mathematical and Visual Modelling Tool
to Guide Energy Aware Code Optimisation
Stephen Roberts
∗, Steven Wright
∗, David Lecomber
†, Christopher January
†,
Jonathan Byrd
†, Xavier Oró
†and Stephen Jarvis
∗∗The University of Warwick, U.K.
{s.i.roberts, steven.wright, s.a.jarvis}@warwick.ac.uk †Allinea Software Ltd., U.K.
{david,cjanuary,jbyrd}@allinea.com
Abstract—Performance engineers are beginning to explore software-level optimisation as a means to reduce the energy consumed when running their codes. This paper presents POSE, a mathematical and visual modelling tool which highlights the relationship between runtime and power consumption. POSE allows developers to assess whether power optimisation is worth pursuing for their codes.
We demonstrate POSE by studying the power optimisation characteristics of applications from the Mantevo and Rodinia benchmark suites. We show that LavaMD has the most scope for CPU power optimisation, with improvements in Energy Delay Squared Product (ED2P) of up to 30.59%. Conversely, MiniMD offers the least scope, with improvements to the same metric limited to 7.60%. We also show that no power optimised version of MiniMD operating below 2.3 GHz can match the ED2P performance of the original code running at 3.2 GHz. For LavaMD this limit is marginally less restrictive at 2.2 GHz.
I. INTRODUCTION
Advances in processor design have delivered improvements in CPU performance for decades. As physical limits are reached, however, refinements to the same basic technologies are beginning to show diminishing returns [1]. One side-effect of this is an unsustainable rise in system power use, which the US Department of Energy has identified as a primary constraint for exascale systems [2].
Hardware manufacturers are increasingly prioritising energy efficiency in processor designs [3]. Research suggests that software modifications will be required to fully exploit the resulting improvements in modern processors [4]. The devel-opment of new energy-aware performance engineering tools and techniques will help developers to identify and capitalise on this new class of optimisation.
In this paper we present the Power Optimised Software En-velope (POSE). POSE is a mathematical and visual modelling tool which provides insight into the energy consumption char-acteristics of a code. Our work helps performance engineers understand whether power or runtime optimisation is the best strategy for improving the energy efficiency of their codes.
[image:2.595.304.553.244.301.2]This research was sponsored through a U.K. Technology Strategy Board project, number 131197 (Energy-Efficiency Tools For High-Performance Multi- and Many-core Applications).
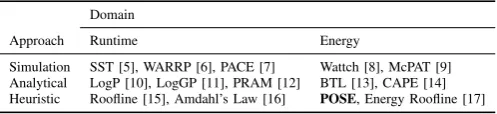
TABLE I: Performance Model Classifications
Domain
Approach Runtime Energy
Simulation SST [5], WARRP [6], PACE [7] Wattch [8], McPAT [9] Analytical LogP [10], LogGP [11], PRAM [12] BTL [13], CAPE [14] Heuristic Roofline [15], Amdahl’s Law [16] POSE, Energy Roofline [17]
The contributions made in this research are:
• We introduce POSE, providing derivations for its con-stituent boundaries and an overview of the insights it provides;
• We show how POSE can be targeted to specific platforms
and use-cases. Specifically, we investigate the trade-offs between runtime and CPU power consumption;
• We use POSE to study codes from the Mantevo and Rodinia benchmark suites. We assess the potential ben-efits of power optimisation for each code, showing that LavaMD offers the most scope for power optimisation while MiniMD offers the least;
• Finally, we investigate how opportunities for power opti-misation vary in response to frequency scaling for these two codes.
The remainder of this paper is structured as follows: Sec-tion II presents a survey of related work; SecSec-tion III details the construction of POSE along with the various insights it provides; Section IV demonstrates our new modelling tool with a study into the CPU power optimisation opportunities presented by a range of benchmark applications; and finally Section V concludes the paper and describes future research.
II. RELATEDWORK
Performance modelling techniques enable the rapid explo-ration of large hardware and software design spaces. Table I categorises the performance modelling ecosystem based on model domain and underlying approach.
A. Simulators
Performance simulators such as SST [5], WARRP [6] and PACE [7] gather performance data by executing a simplified representation of the original code. Using code as a modelling input reduces the burden of model construction placed on the user, meaning model accuracy depends instead on how faithfully the simulator is able to model an underlying system. These approaches can be extremely insightful when search-ing for optimisations, however constructsearch-ing and validatsearch-ing representative simulations is often limited by the need for numerous micro-benchmarks and also the time and state-space overheads of the underlying discrete event simulator.
Tools such as Wattch [8] and McPAT [9] extend perfor-mance simulators with models of power draw. These mod-els use the energy costs associated with particular hardware actions to estimate the power consumption characteristics of simulated code.
B. Analytical Models
Analytical models distil the structure and behaviour of a program into a set of parameterised mathematical expressions. Performance predictions are then obtained by solving these expressions for the required input parameters.
Analytical models produce results more quickly than sim-ulations, making them particularly suitable for parameter studies. Ensuring the model is expressive enough to capture all possible program behaviours is challenging however and requires a deep understanding of the target application.
Examples of this approach include LogP [10], LogGP [11] and PRAM [12], which provide model skeletons which must then be tailored to individual codes. This approach has also been applied to modelling energy consumption, with examples including BTL [13] and CAPE [14].
C. Heuristic Models
Heuristic models represent the most abstract category of performance models and the one to which our work belongs. Rather than attempting to faithfully represent an entire system, heuristic models provide a simplified analogy which helps developers reason about particular properties of a code. Ease of construction and the clarity of their insights mean heuristic models are well suited to the early stages of optimisation.
Ahmdal’s Law [16], arguably the best known heuristic model, states that the performance gains from parallelisation are limited by the serial portion of a parallel program. A further example of this approach is the Roofline model [15], which frames application performance in terms of its opera-tional intensity and two system bottlenecks; off-chip memory bandwidth and floating point performance. This simplification limits Roofline’s use as a predictive model but does mean a developer can easily isolate the limiting factor of code performance and target their optimisation efforts accordingly. POSE serves as a preliminary ‘first cut’ modelling tech-nique intended to guide energy-aware optimisation efforts. Our model provides an asymptotic analysis of the scope for optimisation in the power and runtime domains, allowing
θ A
B
C D E 1.
2. 3. 4.
Runtime (s)
Ener
gy
(
J
)
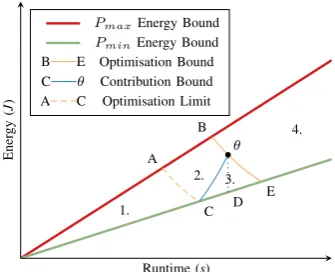
[image:3.595.345.513.50.186.2]PmaxEnergy Bound PminEnergy Bound B E Optimisation Bound C θ Contribution Bound A C Optimisation Limit
Fig. 1:E1t2 Power Optimised Software Envelope
performance engineers to focus their efforts wherever they will be most beneficial. POSE draws inspiration from the Roofline model in that its insights are also presented in an intuitive graphical format. POSE differs from the other models described in that it does not identify optimisation opportunities, but rather which tools and approaches are best suited to finding them.
Horowitz proposed the Energy Delay Product as a metric to evaluate the energy and performance trade-offs in low power design [18]. Brooks extended this by weighting each compo-nent to better reflect the demands of specific domains [19]. We refer to these as theEmtn family of metrics, which includes
power (E1t−1), energy (E1t0) and time (E0t1) as members. Most of the examples found in this paper use Energy Delay Squared Product (E1t2), described by Brookset al.as the most appropriate Emtn metric when considering a fixed
micro-architecture [8].
III. POWEROPTIMISEDSOFTWAREENVELOPE
Energy is the integral of power consumed over time, or put simply E = ¯P t. As such, the energy efficiency of a code can be achieved either through shortening its runtime (t) with conventional program optimisations or reducing average power consumption (P¯) with power optimisations. POSE enables performance engineers to compare the potential benefits of each approach for a given code and thus focus their efforts on whichever offers the greatest rewards.
The POSE heuristic partitions the energy/runtime plane into areas with differing performance characteristics relative to some initial unoptimised code and input. POSE is a general purpose heuristic which applies to all members of the Emtn
group with m > 0 and n ≥ 0, and indeed any metric that increases in line with runtime and energy consumption. We introduce the bounds which constitute POSE and provide their derivations for theEmtn family of metrics. The only prereq-uisites of our model are that time and energy consumption can be accurately measured or calculated for the target platform.
A. Feasible Performance Envelope
and Pmax in Figure 1. These values represent the minimum
and maximum rates of power consumption that can occur during normal operation of the target platform. The(Runtime, Energy) costs incurred by running any given code θ under similar conditions must be represented within this envelope.
B. Optimisation Bound
To constrain our search space further we consider the metric we wish to reduce.
Definition 1. For logically equivalent codes θ and λ, the transformation θ→λis a valid optimisation with respect to a cost metricM iffM(λ)M(θ).
We plot curve B — E in Figure 1, which passes through θ linking all points whereM(λ) =M(θ). By Definition 1 any optimised versions ofθmust exist below this bound. Naturally the equation for the Optimisation Bound depends on the metric we are optimising for. Figure 1 shows the Optimisation Bound forE1t2. The general form of this bound for theEmtn family of metrics is derived as follows:
Eλmtλn=Eθmtθn
Eλm=
Eθmtθn
tλn
Eλ= (
Eθmtθn
tλn
)m1 (1)
C. Contribution Bound
Our second bound considers what it means to optimise for reduced power draw.
Definition 2. An optimisation θ → λwith respect to metric
M is a power optimisation iff the reduction in power draw it delivers is responsible for the majority of the improvement in terms ofM.
We plot curveC — θin Figure 1 linking all points for which power and runtime factors contribute toM in the same ratio as our original code. By Definition 2 any power-optimised versions ofθ must lie below this Contribution Bound. Again the equation for the Contribution Bound depends on the metric chosen. Figure 1 shows the bound forE1t2while the general form forEmtn metrics is derived as follows:
Pλm
tλm+n
= Pθ
m
tθm+n
Pλm=
Pθm
tθm+n
×tλm+n
Eλm=
Pθm
tθm+n
×tλm+n+1
Eλ= (
Pθm
tθm+n
×tλm+n+1)
1
m (2)
We seek to use the most appropriate tools while searching for optimisations. If an optimisation yields significant reductions in runtime, with only minor reductions in power consumption, then it is reasonable to classify it as a runtime optimisation.
Conventional time-based profilers and performance engineer-ing tools are therefore better suited to findengineer-ing these optimisa-tions. It is the Contribution Bound which enables our model to make this distinction.
D. Optimisation Limit
The bounds described thus far delineate those areas of the energy/runtime plane in which runtime and power optimised versions of a given code may exist. The final component of POSE is the Optimisation Limit. This partitions runtime optimisations into those which strictly dominate all power optimisations and those which could be outperformed by some power optimisation.
This limit is related to the Optimisation Bound and is likewise based on Equation 1. It connects all points with the same value for M as the maximally power-optimised point in our envelope, C, shown as curve A — C in Figure 1. All optimisations below this limit strictly dominate any possible power optimisation.
E. POSE Insights
POSE partitions the feasible performance envelope of Figure 1 into areas with differing performance characteristics. Area 1 contains runtime optimisations which dominate the best case power optimisation in terms of M (Strong Runtime Optimisation). Area 2 contains runtime optimisations which dominateθin terms ofM, yet may be outperformed by some power optimised version of θ (Weak Runtime Optimisation). Area 3 contains optimisations for which improvements to M are primarily due to reduced power consumption (Power Optimisation). Finally, Area 4 corresponds to codes with worse performance than θ (Performance Degradation).
A key strength of POSE is that it produces quantitative and actionable insights relating directly to properties of the code. These insights fall into one of two broad categories, which taken together allow a performance engineer to decide if power optimisation is likely to prove worthwhile.
The first of these categories relates tothe benefit offered by power optimisation. Taking the difference in energy between pointθandDgives us an upper limit on the amount of energy which can be saved by reducing power consumption. Similarly, the difference in value between M(θ) and M(C) gives an upper bound on the improvement in our metric we can expect to see from power optimisation.
The second category indicates the scope a code has for power optimisation. The difference in runtime between inter-sect Eandθrepresents the maximum increase in runtime we could feasibly trade off to achieve a slower yet more energy efficient code. The value tθ/tB represents the smallest speed
up which guarantees a code that outperforms θ with respect to M. Finally, tθ/tA is the smallest speed up guaranteed to
outperform any power optimised version of θ.
θ
Runtime (s)
Ener
gy
(
J
)
PmaxEnergy Bound PminEnergy Bound
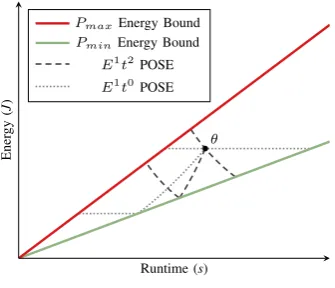
[image:5.595.83.251.50.194.2]E1t2POSE E1t0POSE
Fig. 2: POSE for Different Metrics
engineers to make informed decisions about where best to focus their optimisation efforts.
It is worth restating that POSE is a metric-agnostic heuristic. Figure 2 shows how the POSE heuristic varies with choice of metric using Energy (E1t0) and Energy Delay Squared Product (E1t2) as examples. POSE offers the same insights regardless of the metric chosen.
IV. INVESTIGATION
We use POSE to investigate the scope for CPU power optimi-sation for a selection of codes taken from the Mantevo [20] and Rodinia [21] benchmark suites.
CPU energy consumption accounts for a significant portion of the energy used by high performance systems [22] and is therefore a prime target for optimisation. It can also be measured accurately on commodity hardware [23] making it a suitable candidate for POSE modelling.
Our experiments were carried out on an Intel Core i5-3470 Ivy Bridge CPU, which supports Intel’s Running Average Power Limit (RAPL) technology [24]. The choices of platform and power measurement technique were motivated by their availability as POSE places no restrictions on either.
A. CPU Power Consumption
Current processors are based on Complimentary Metal Oxide Semiconductor (CMOS) technology. Equation 3 separates the power draw of CMOS chips into component parts, of which dynamic and leakage power are the most significant.
Ptot=Pdyn+Pleak+Pother (3)
Dynamic power is consumed when logic gates change state. Leakage power exists because at microscopic scales the in-sulating properties of silicon break down, allowing current to escape even when gates remain inactive. Other forms of power dissipation exist, though their effects are relatively minor [25].
Pdyn∝CV2Af (4)
Pleak =V ×Ileak (5)
Equation 4 is an approximation for dynamic power in which C denotes load capacitance, V the supply voltage, A the activity factor and f the clock frequency. Equation 5 is a
simplified expression for leakage power which exploits the fact that leakage current (Ileak) is not related to workload [26].
Activity factor captures the fraction of logic elements that change state each clock cycle. Frequency and supply voltage vary in tandem, taking values from a set of(frequency, voltage)
pairs known as P-states. Dynamic Voltage and Frequency Scaling (DVFS) selects a P-state based on workload, or places the CPU into an energy saving mode if no work is available. Finally, capacitance and leakage current are constants dictated by hardware design.
Processor architecture also plays a significant roll in de-termining total power consumption. Each core in a multi-core architecture operates independently with its own activity factor and in some cases P-state. Equation 3 should be summed across all cores to obtain a value for the entire processor.
B. Feasible Performance Envelope
The first step in applying POSE is to construct a feasible performance envelope. Many manufacturers publish power dissipation figures for their hardware, however for safety reasons these are usually conservative estimates. POSE works best when the power bounds are as tight as possible, therefore we determine PminandPmax empirically.
We specify power benchmarks using(S, A, C)tuples, with P-state S, activity factor A and active core count C. Our PminandPmaxbenchmarks should reflect the range of values
these properties can take for a given code θ. This notion is formalised by Equation 6.
Pmin= (Smin, Amin, Cmin | θ)
Pmax= (Smax, Amax, Cmax |θ)
(6)
The values of S, A, and C depend on the code and the nature of the optimisations being considered. POSE models for inherently serial codes should be constructed using single threaded benchmarks where Cmin=Cmax= 1, for example.
Thecpufrequtilspackage allows us to override DVFS and manually set the desired P-stateS. We control the number of active coresCby specifying the number of threads used by our benchmarking routines and pinning each one to its own core to prevent migration. The remaining property is activity factor, which is influenced by benchmark code.
We define the range of values that A can take for some fixed S and C as [α, β] where 0 < α < β < 1. Our α benchmark executes a singlejmpinstruction each clock cycle, preventing instruction pipelining. It performs no calculations or memory accesses while keeping control logic to a minimum. Supporting benchmark code can be downloaded from the link given in the Appendix.
Non-trivial codes perform more work per unit time than our minimal benchmark. This additional work means more transis-tors changing state per cycle, and hence a higher activity factor. The only exception occurs when applications are blocked for long periods, allowing the processor to enter an idle state. This can be addressed by adding delays to the benchmark.
TABLE II: Feasible Performance Envelope Parameters (W)
CPU Cores Active
1 2 3 4
[image:6.595.50.279.66.230.2]P-state (GHz) Pα Pβ Pα Pβ Pα Pβ Pα Pβ 1.60 8.92 11.29 10.47 15.13 12.01 19.01 13.51 23.06 1.70 9.11 11.62 10.73 15.76 12.38 19.83 13.97 23.95 1.80 9.29 11.98 11.02 16.29 12.77 20.67 14.46 25.14 1.90 9.61 12.36 11.33 16.96 13.15 21.52 14.93 26.20 2.10 9.97 13.12 11.99 18.42 14.12 23.56 16.10 28.81 2.20 10.19 13.58 12.39 19.06 14.59 24.66 16.78 30.06 2.30 10.47 14.04 12.74 19.92 15.10 25.74 17.39 31.53 2.40 10.71 14.56 13.17 20.81 15.73 27.01 18.11 32.97 2.50 11.04 15.15 13.65 21.72 16.34 28.37 18.97 34.83 2.60 11.36 15.67 14.16 22.83 17.14 29.95 19.81 36.43 2.70 11.71 16.34 14.64 23.95 17.82 31.48 20.74 38.39 2.90 12.47 17.79 15.92 26.37 19.46 35.25 22.85 42.01 3.00 13.00 18.64 16.68 27.91 20.45 37.43 24.03 44.96 3.10 13.39 19.38 17.44 29.35 21.49 39.18 25.41 47.46 3.20 13.93 20.43 18.26 31.07 22.83 41.52 26.88 49.61
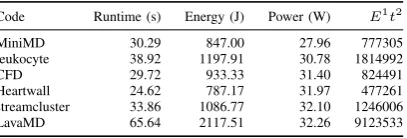
TABLE III: Code Metrics forS= 3.2GHz, C= 4
Code Runtime (s) Energy (J) Power (W) E1t2
MiniMD 30.29 847.00 27.96 777305 leukocyte 38.92 1197.91 30.78 1814992 CFD 29.72 933.33 31.40 824491 Heartwall 24.62 787.17 31.97 477261 streamcluster 33.86 1086.77 32.10 1246006 LavaMD 65.64 2117.51 32.26 9123533
consumption across a range of x86_64 processors. It consists of hand optimised assembly routines which raise the activity factor above the level achievable with high level languages. Prime95 and Linpack were also evaluated as β benchmarks however they were outperformed by FIRESTARTER.
We extended the Unixtimebinary to measure cumulative power consumption figures. Our tool polls the RAPL interface periodically to identify and compensate for any wraparound of the RAPL registers. Techniques described by Hahnel et al. [28] were used to promote measurement accuracy.
The benchmark parameter space is small enough for us to fully characterise our processor by measuring all (S, A, C) configurations. Benchmarking runs lasted for 120 seconds, allowing sufficient time for power readings to stabilise. The results of this characterisation are presented in Table II, which identifies P-states by their frequency component.
C. POSE Models for Code Optimisation
Having characterised our system we now proceed to build POSE models for benchmarks in the Mantevo and Rodinia suites. These codes were compiled with ICC version 14.0.0. Applications were run with the default configuration given by their documentation where available. In the absence of suitable defaults, parameters were chosen to yield runtimes in line with the other applications. The energy and runtime costs incurred by running each code is given in Table III.
All codes ran in parallel across four cores and spent negligible time waiting for resources. We therefore disregard optimisations which reduce parallelism (C < 4) or processor
TABLE IV:E1t2 POSE Coordinates
(a) Time (s)
Code θ A B C D E
MiniMD 30.29 24.37 25.02 29.90 30.29 30.70 leukocyte 38.92 30.33 33.20 37.21 38.92 40.72 CFD 29.72 23.01 25.52 28.22 29.72 31.30 Heartwall 24.62 18.95 21.27 23.24 24.62 26.09 streamcluster 33.86 26.02 29.29 31.92 33.86 35.92 LavaMD 65.64 50.35 56.87 61.76 65.64 69.76
(b) Energy (J)
Code θ A B C D E
MiniMD 847.00 1209.05 1241.33 803.52 814.18 824.98 leukocyte 1197.91 1504.62 1646.83 999.95 1046.14 1094.47 CFD 933.33 1141.19 1265.96 758.42 798.81 841.34 Heartwall 787.17 939.80 1055.06 624.58 661.77 701.18 streamcluster 1086.77 1290.65 1452.77 857.75 910.03 965.50 LavaMD 2117.51 2497.76 2821.05 1659.99 1764.15 1874.84
throughput (S < 3.2 GHz). This corresponds to the feasible performance envelope given by Equation 7.
Pmin= (3.2 GHz, α,4) = 26.88W,
Pmax= (3.2 GHz, β,4) = 49.61W
(7)
Table IV summarises the POSE models constructed for each code. The time and energy costs of each code are given in the θ columns of Table IVa and Table IVb respectively. The POSE model coordinates given in the remaining columns are obtained by solving Equations 1 and 2 for these values, as described in Section III.
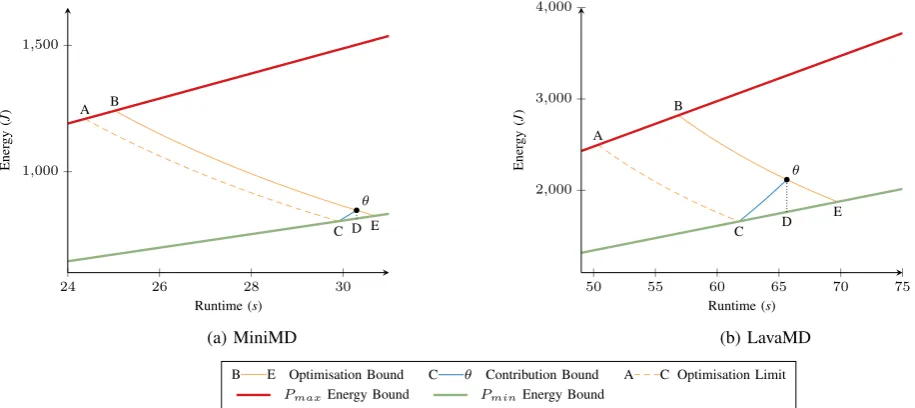
The remainder of this section focusses on MiniMD and LavaMD as the two codes representing the extremes of power consumption. POSE models for these two codes are repro-duced graphically in Figure 3a and Figure 3b, and the results of these models are presented in Table V. Results for the remaining codes can be found in the Appendix.
TABLE V: POSE Model Summaries
LavaMD
Best Case Energy Saved by Reducing Power Consumption 353.36J Worst Case Slowdown as a result of Power Optimisation 4.12s Best Case Improvement inE1t2from Power Optimisation 30.59%
Minimum Speed Up Guaranteed to Outperformθ 8.77s; 1.15×
Speed Up Required to Dominate Power Optimisation 15.29s; 1.30× MiniMD
Best Case Energy Saved by Reducing Power Consumption 32.82J Worst Case Slowdown as a result of Power Optimisation 0.40s Best Case Improvement inE1t2from Power Optimisation 7.60%
Minimum Speed Up Guaranteed to Outperformθ 5.27s; 1.21×
Speed Up Required to Dominate Power Optimisation 5.92s; 1.24×
These results show that LavaMD is more amenable to power optimisation than MiniMD, in terms of both scope and benefit; a fact illustrated by the difference in size between the power optimised areas in Figure 3a and Figure 3b.
D. POSE Models for Frequency Scaling
[image:6.595.65.269.261.330.2]θ A B
C D E
24 26 28 30
1,000
1,500
Runtime (s)
Ener
gy
(
J
)
(a) MiniMD
θ A
B
C D
E
50 55 60 65 70 75
2,000
3,000
4,000
Runtime (s)
Ener
gy
(
J
)
(b) LavaMD
[image:7.595.43.501.52.256.2]B E Optimisation Bound C θ Contribution Bound A C Optimisation Limit PmaxEnergy Bound PminEnergy Bound
Fig. 3:E1t2 POSE Comparison for MiniMD and LavaMD
states can increase runtime, offsetting any energy savings from reduced power draw [29]. Application-aware DVFS can save energy by selecting the optimal P-state schedule for a given code [30]. This implies that code changes may effect the optimal P-state assignment. We now use POSE to reason about this class of optimisation.
The performance of MiniMD and LavaMD was measured for each P-state supported by our system. Figure 4 shows that the energy consumption of both codes can be reduced at the cost of increased runtime. Despite this, the lowestE1t2value for both codes occurs at 3.2 GHz, meaning race-to-halt is the optimal strategy in terms of this metric.
While useful, this simple analysis fails to account for poten-tial co-optimisation of activity factor and P-state. It is possible that different optimisations may be required to achieve optimal performance in different P-states. The flexibility of POSE allows us to model this scenario by considering optimisations which can impact P-state as well as activity factor.
Equation 8 gives the feasible performance envelope corre-sponding to this class of optimisation. We choose 3.2 GHz as our initial ‘unoptimised’ baseline because this is the P-state our system defaults to when running MiniMD or LavaMD.
Pmin= (1.6GHz, α,4) = 13.51W,
Pmax= (3.2GHz, β,4) = 49.61W
(8)
If two P-states have overlapping POSE models then it may be possible for a power optimised code running at the lower frequency P-state to outperform an unoptimised code running at a higher frequency. Conversely, if their POSE models do not overlap then switching to the higher performance P-state dominates any possible power optimisation at the weaker state. This analysis allows the weaker state to be excluded from any search for power optimisations.
For MiniMD, Figure 4a shows that the first POSE model which does not overlap with that for our baseline occurs at 2.2
GHz. This means that no power optimisations exist at P-states 2.2 GHz and below which can match the E1t2 performance of our unoptimised baseline. Conversely, such an optimisation may exist at frequencies between 3.2 GHz and 2.2 GHz as shown by the overlapping of the respective POSE models. For LavaMD this optimisation threshold is lower at 2.1 GHz, lending support to the claim that of these two codes LavaMD is more amenable to power optimisation.
Dynamic Concurrency Throttling has also been proposed as a means to reduce energy consumption [31]. POSE could be used to model such optimisations in a similar manner to our P-state investigation; the only difference being the parameter-isation of the feasible performance envelope (Cmin= 1).
V. CONCLUSION
This paper presents POSE, a mathematical and visual mod-elling tool which captures the trade off between software power consumption and runtime. POSE provides insights regarding the scope a code has for power optimisation as well as the level of improvement which can be expected. These insights help developers to determine whether power or runtime optimisation is the best approach for improving the efficiency of a code.
POSE works by partitioning the energy/runtime plane into areas corresponding to runtime and power optimised versions of an initial code with respect to an optimisation metric. We provide derivations of POSE’s boundaries for the Energy Delay Product family of metrics. We also discuss the various insights our model provides.
3.2 GHz 1.6 GHz 2.2 GHz
20 30 40 50 60
200 400 600 800
1,000
1,200
Runtime (s)
Ener
gy
(
J
)
(a) MiniMD
3.2 GHz
1.6 GHz 2.1 GHz
40 60 80 100 120 140
1,000
2,000
3,000
Runtime (s)
Ener
gy
(
J
)
(b) LavaMD
[image:8.595.39.486.50.246.2]PminEnergy Bound 3.2 GHz POSE First Non-Overlapping POSE P-state Measurement
Fig. 4:E1t2 POSE for P-state Optimisation of MiniMD and LavaMD
LavaMD shows more scope for power optimisation, offering improvements of up to 30.59% in the same metric.
Our investigation into frequency scaling highlights the abil-ity of POSE to rule out dominated configurations and hence reduce the optimisation search space. We show that no power optimised version of MiniMD operating at P-states below 2.3 GHz can match the ED2P performance of the original unoptimised code running at 3.2 GHz. Once again LavaMD shows more scope for optimisation, with this limit falling at the marginally less restrictive level of 2.2 GHz.
We believe our results are of interest to performance engineers and serve to demonstrate the practical utility of POSE. POSE is being engineered for inclusion into Allinea MAP [32], a well-known state-of-the-art application analytics tool for HPC clusters and applications.
Future Work
Work is ongoing to develop the hardware and software re-quired to measure power consumption at scale. This will allow us further validate POSE by applying it to a broader selection of scientific codes running on a range of architectures. The quantitative nature of our technique makes it particularly well suited to comparison studies. As such we intend to investigate the power optimisation opportunities presented by a range of different platforms.
Our ultimate aim is to demonstrate how POSE may be used to identify specific optimisations. This will involve developing feasible performance envelopes for individual subsystems in-cluding memory, file systems and processors. We also intend to profile specific classes of code and establishPminbaselines for
each. Doing so would allow POSE to highlight optimisation opportunities at a per-kernel, per-subsystem level and hence facilitate targeted optimisation.
APPENDIX
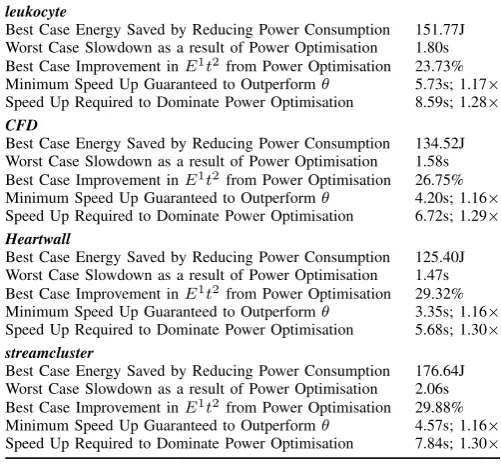
[image:8.595.301.552.403.635.2]Table VI summarises the results of POSE models for the remaining codes documented in this paper. These results were generated automatically. Software for building POSE models and producing these energy performance reports can be downloaded from http://warwick.ac.uk/pose.
TABLE VI: POSE Summaries for Remaining Codes
leukocyte
Best Case Energy Saved by Reducing Power Consumption 151.77J Worst Case Slowdown as a result of Power Optimisation 1.80s Best Case Improvement inE1t2from Power Optimisation 23.73% Minimum Speed Up Guaranteed to Outperformθ 5.73s; 1.17×
Speed Up Required to Dominate Power Optimisation 8.59s; 1.28× CFD
Best Case Energy Saved by Reducing Power Consumption 134.52J Worst Case Slowdown as a result of Power Optimisation 1.58s Best Case Improvement inE1t2from Power Optimisation 26.75%
Minimum Speed Up Guaranteed to Outperformθ 4.20s; 1.16×
Speed Up Required to Dominate Power Optimisation 6.72s; 1.29× Heartwall
Best Case Energy Saved by Reducing Power Consumption 125.40J Worst Case Slowdown as a result of Power Optimisation 1.47s Best Case Improvement inE1t2from Power Optimisation 29.32%
Minimum Speed Up Guaranteed to Outperformθ 3.35s; 1.16×
Speed Up Required to Dominate Power Optimisation 5.68s; 1.30× streamcluster
Best Case Energy Saved by Reducing Power Consumption 176.64J Worst Case Slowdown as a result of Power Optimisation 2.06s Best Case Improvement inE1t2from Power Optimisation 29.88% Minimum Speed Up Guaranteed to Outperformθ 4.57s; 1.16×
Speed Up Required to Dominate Power Optimisation 7.84s; 1.30×
REFERENCES
[2] J. Shalf, S. Dosanjh, and J. Morrison, “Exascale Computing Technology Challenges,” in High Performance Computing for Computational Sci-ence (VECPAR 2010), ser. Lecture Notes in Computer Science. Springer Berlin Heidelberg, June 2011, vol. 6449, pp. 1–25.
[3] N. Kurd, M. Chowdhury, E. Burton, T. P. Thomas, C. Mozak, B. Boswell, M. Lal, A. Deval, J. Douglas, M. Elassal et al., “5.9 Haswell: A Family of IA 22nm Processors,” inIEEE International Solid-State Circuits Conference Digest of Technical Papers (ISSCC). IEEE, February 2014, pp. 112–113.
[4] Y. S. Shao and D. Brooks, “Energy Characterization and Instruction-Level Energy Model of Intel’s Xeon Phi Processor,” inIEEE Interna-tional Symposium on Low Power Electronics and Design (ISLPED), September 2013, pp. 389–394.
[5] A. F. Rodrigues, K. S. Hemmert, B. W. Barrett, C. Kersey, R. Oldfield, M. Weston, R. Risen, J. Cook, P. Rosenfeld, E. Cooper-Balis, and B. Jacob, “The Structural Simulation Toolkit,” ACM SIGMETRICS Performance Evaluation Review, vol. 38, no. 4, pp. 37–42, March 2011. [6] S. D. Hammond, G. R. Mudalige, J. A. Smith, S. A. Jarvis, J. A. Herdman, and A. Vadgama, “WARPP: A Toolkit for Simulating High-performance Parallel Scientific Codes,” inProceedings of the 2nd Inter-national Conference on Simulation Tools and Techniques (Simutools’09). ICST, Brussels, Belgium: Institute for Computer Sciences, Social-Informatics and Telecommunications Engineering, Brussels, Belgium, March 2009, pp. 19:1–19:10.
[7] J. Cao, D. Kerbyson, E. Papaefstathiou, and G. Nudd, “Performance Modelling of Parallel and Distributed Computing using PACE,” inIEEE International Performance Computing and Communications Conference (IPCCC-2000), Febuary 2000, pp. 485–492.
[8] D. Brooks, V. Tiwari, and M. Martonosi, “Wattch: A Framework for Architectural-level Power Analysis and Optimizations,” inProceedings of the 27th Annual International Symposium on Computer Architecture (ISCA’00). ACM, New York, NY, June 2000, pp. 83–94.
[9] S. Li, J.-H. Ahn, R. D. Strong, J. B. Brockman, D. M. Tullsen, and N. P. Jouppi, “McPAT: An Integrated Power, Area, and Timing Modeling Framework for Multicore and Manycore Architectures,” in
Proceedings of the 42nd Annual IEEE/ACM International Symposium on Microarchitecture (MICRO-42), December 2009, pp. 469–480. [10] D. Culler, R. Karp, D. Patterson, A. Sahay, K. E. Schauser, E. Santos,
R. Subramonian, and T. von Eicken, “LogP: Towards a Realistic Model of Parallel Computation,” in Proceedings of the Fourth ACM SIG-PLAN Symposium on Principles and Practice of Parallel Programming (PPOPP’93). ACM, New York, NY, May 1993, pp. 1–12.
[11] A. Alexandrov, M. F. Ionescu, E. S. Klaus, and S. Chris, “LogGP: Incor-porating Long Messages into the LogP Model for Parallel Computation,”
Journal of Parallel and Distributed Computing, vol. 44, pp. 71–79, 1997. [12] R. Karp and V. Ramachandran, “Handbook of Theoretical Computer Science,” J. van Leeuwen, Ed. Cambridge, MA: MIT Press, 1990, ch. Parallel Algorithms for Shared-Memory Machines, pp. 869–941. [13] I. Manousakis and D. Nikolopoulos, “BTL: A Framework for Measuring
and Modeling Energy in Memory Hierarchies,” in IEEE 24th Inter-national Symposium on Computer Architecture and High Performance Computing (SBAC-PAD), 2012, pp. 139–146.
[14] M. B. Kamble and K. Ghose, “Analytical Energy Dissipation Models for Low Power Caches,” inProceedings of the 1997 Symposium on Low Power Electronics and Design, August 1997, pp. 143–148.
[15] S. Williams, A. Waterman, and D. Patterson, “Roofline: An Insightful Visual Performance Model for Multicore Architectures,” Communica-tions of the ACM, vol. 52, no. 4, pp. 65–76, April 2009.
[16] G. Amdahl, “Validity of the Single Processor Approach to Achieving Large Scale Computing Capabilities,” inProceedings of the 1967 Joint Computer Conference. ACM, New York, NY, 1967, pp. 483–485.
[17] J. W. Choi, D. Bedard, R. Fowler, and R. Vuduc, “A Roofline Model of Energy,” in IEEE 27th International Symposium on Parallel & Distributed Processing (IPDPS). IEEE, May 2013, pp. 661–672. [18] M. Horowitz, T. Indermaur, and R. Gonzales, “Low-Power Digital
Design,” inProceedings of the Symposium on Low Power Electronics. IEEE Computer Society, Los Alamos, CA, 1994.
[19] D. M. Brooks, P. Bose, S. E. Schuster, H. Jacobson, P. N. Kudva, A. Buyuktosunoglu, J. D. Wellman, V. Zyuban, M. Gupta, and P. W. Cook, “Power-Aware Microarchitecture: Design and Modeling Chal-lenges for Next-Generation Microprocessors,” Micro, IEEE, vol. 20, no. 6, pp. 26–44, November 2000.
[20] M. A. Heroux, D. W. Doerfler, P. S. Crozier, J. M. Willenbring, H. C. Edwards, A. Williams, M. Rajan, E. R. Keiter, H. K. Thornquist, and R. W. Numrich, “Improving Performance via Mini-Applications,”Sandia National Laboratories, Tech. Rep, 2009.
[21] S. Che, M. Boyer, J. Meng, D. Tarjan, J. W. Sheaffer, S.-H. Lee, and K. Skadron, “Rodinia: A Benchmark Suite for Heterogeneous Comput-ing,” inIEEE International Symposium on Workload Characterization (IISWC), October 2009, pp. 44–54.
[22] R. Ge, X. Feng, S. Song, H.-C. Chang, D. Li, and K. W. Cameron, “PowerPack: Energy Profiling and Analysis of High-Performance Sys-tems and Applications,”IEEE Transactions on Parallel and Distributed Systems, vol. 21, no. 5, pp. 658–671, May 2010.
[23] D. Hackenberg, T. Ilsche, R. Schone, D. Molka, M. Schmidt, and W. E. Nagel, “Power Measurement Techniques on Standard Compute Nodes: A Quantitative Comparison,”2014 IEEE International Symposium on Performance Analysis of Systems and Software (ISPASS), pp. 194–204, March 2013.
[24] H. David, E. Gorbatov, U. R. Hanebutte, R. Khanna, and C. Le, “RAPL: Memory Power Estimation and Capping,” inACM/IEEE International Symposium on Low-Power Electronics and Design (ISLPED). IEEE, August 2010, pp. 189–194.
[25] S. Kaxiras and M. Martonosi, Computer Architecture Techniques for Power-Efficiency, 1st ed. Morgan and Claypool Publishers, 2008. [26] N. S. Kim, T. Austin, D. Baauw, T. Mudge, K. Flautner, J. S. Hu, M. J.
Irwin, M. Kandemir, and V. Narayanan, “Leakage Current: Moore’s Law Meets Static Power,”Computer, vol. 36, pp. 68–75, 2003.
[27] D. Hackenberg, R. Oldenburg, D. Molka, and R. Schone, “Introducing FIRESTARTER: A Processor Stress Test Utility,” inInternational Green Computing Conference (IGCC), June 2013, pp. 1–9.
[28] M. Hähnel, B. Döbel, M. Völp, and H. Härtig, “Measuring Energy Consumption for Short Code Paths Using RAPL,”ACM SIGMETRICS Performance Evaluation Review, vol. 40, pp. 13–17, 2012.
[29] E. Le Sueur and G. Heiser, “Dynamic Voltage and Frequency Scal-ing: The Laws of Diminishing Returns,” inProceedings of the 2010 International Conference on Power Aware Computing and Systems (HotPower’10). USENIX Association, October 2010, pp. 1–8. [30] K. Choi, R. Soma, and M. Pedram, “Dynamic Voltage and Frequency
Scaling Based on Workload Decomposition,” in Proceedings of the 2004 International Symposium on Low Power Electronics and Design (IPSLED’04). ACM, New York, NY, August 2004, pp. 174–179. [31] M. Curtis-Maury, J. Dzierwa, C. D. Antonopoulos, and D. S.
Nikolopou-los, “Online Strategies for High-performance Power-aware Thread Exe-cution on Emerging Multiprocessors,” inProceedings of the 20th Inter-national Conference on Parallel and Distributed Processing (IPDPS’06). IPDPS, Rhodes Island, Greece: IEEE Computer Society, Washington, DC, April 2006, pp. 298–298.