Original citation:
Perry, David (Researcher in Chemistry), Al Botros, Rehab, Momotenko, Dmitry, Kinnear, Sophie L. and Unwin, Patrick R.. (2015) Simultaneous nanoscale surface charge and topographical mapping. ACS Nano, 9 (7). pp. 7266-7276
Permanent WRAP url:
http://wrap.warwick.ac.uk/67813 Copyright and reuse:
The Warwick Research Archive Portal (WRAP) makes this work of researchers of the University of Warwick available open access under the following conditions. Copyright © and all moral rights to the version of the paper presented here belong to the individual author(s) and/or other copyright owners. To the extent reasonable and practicable the material made available in WRAP has been checked for eligibility before being made available.
Copies of full items can be used for personal research or study, educational, or not-for-profit purposes without prior permission or charge. Provided that the authors, title and full bibliographic details are credited, a hyperlink and/or URL is given for the original metadata page and the content is not changed in any way.
Publisher’s statement:
This document is the Accepted Manuscript version of a Published Work that appeared in final form in ACS Nano, copyright © American Chemical Society after peer review and technical editing by the publisher. To access the final edited and published work, see http://pubs.acs.org/page/policy/articlesonrequest/index.html]
The version presented here may differ from the published version or, version of record, if you wish to cite this item you are advised to consult the publisher’s version. Please see the ‘permanent WRAP url’ above for details on accessing the published version and note that access may require a subscription.
Simultaneous Nanoscale Surface Charge and
Topographical Mapping
David Perry,1,2† Rehab Al Botros,1† Dmitry Momotenko,1† Sophie Kinnear1 and
Patrick R. Unwin1,*
1Department of Chemistry and 2MOAC Doctoral Training Centre, University of
Warwick, Coventry, CV4 7AL, United Kingdom. †These authors contributed equally
*Corresponding Author
ABSTRACT
Nanopipettes are playing an increasingly prominent role in nanoscience, for sizing,
sequencing, delivery, detection and mapping interfacial properties. Herein, the
question of how to best resolve topography and surface charge effects when using a
nanopipette as a probe for mapping in scanning ion conductance microscopy (SICM)
is addressed. It is shown that using a bias modulated (BM) SICM scheme it is
possible to map the topography faithfully, while also allowing surface charge to be
estimated. This is achieved by applying zero net bias between the electrode in the
SICM tip and the one in bulk solution for topographical mapping, with just a small
harmonic perturbation of the potential to create an AC current for tip positioning.
Then a net bias is applied, whereupon the ion conductance current becomes sensitive
to surface charge. Practically this is optimally implemented in a hopping-cyclic
voltammetry mode where the probe is approached at zero net bias at a series of pixels
across the surface to reach a defined separation, and then a triangular potential
waveform is applied and the current response is recorded. Underpinned with
theoretical analysis, including finite element modeling of the DC and AC components
of the ionic current flowing through the nanopipette tip, the powerful capabilities of
this approach are demonstrated with the probing of interfacial acid-base equilibria and
high resolution imaging of surface charge heterogeneities, simultaneously with
topography, on modified substrates.
KEYWORDS: Nanopipette, surface charge, scanning ion conductance microscopy,
Surface charge density plays an important role in interfacial processes and properties,
and being able to probe surface charge in a simple, robust manner could find great
application in mineralogy,1-3 colloidal science,4-7 materials science, including the
study of electrode surfaces,8 and in living systems4, 9-16 where surface charge is known
to play a key role. While zeta potential measurements17, 18 and potentiometric
titrations19-21 give important information on the charge of colloids in solutions, the
charge on extended surfaces is more difficult to probe, with relatively few techniques
available. Since surfaces are often characterized by both heterogeneous charge
distributions and topographical features, scanning probe microscopes (SPMs), such as
force microscopy (FM)22-26 and scanning ion conductance microscopy (SICM),27-32
are potentially attractive as a means of probing local surface charge. At the same time,
because the response of these techniques depends on both topography and surface
charge (and other properties) there is a wider consideration about the operation of
these SPMs, and the extent to which these different effects are convoluted in the
response.
This paper describes how SICM can be used to (i) measure topography largely
free from surface charge effects and (ii) how the corresponding charge on the surface
can be probed semi-quantitatively. SICM uses a positionable nanopipette to examine
electrolyte-substrate interfaces without requiring a direct mechanical contact with the
substrate itself, making it a powerful approach for the investigation of soft
(biological) samples.27, 32, 33 Traditionally in SICM, a bias is applied between a
quasi-reference counter electrode (QRCE) in the nanopipette tip and a second QRCE in bulk
solution to generate a direct ionic current (DC). Away from the surface, the total
resistance of this conductimetric cell is dominated by the contribution from the
resistance contribution from the tip-to-substrate gap increases and causes the value of
ionic current to drop.27 This provides a means of monitoring the surface topography,
using various schemes such as distance modulation (DM)27, 28, 30, 34 and the hopping
(backstep) mode32, 35, 36 in which a specific tip current value is used to maintain a
fixed tip-surface separation during scanning. In DM-SICM, a harmonic oscillation to
the vertical (z axis) position is applied and an alternating current signal (AC) is
induced, the amplitude of which can be used for positionable feedback.27, 28, 30, 34
Typically, under high electrolyte conditions any double layer formed at charged
interfaces is considered to be compressed to an undetectable level37 and so it has been
argued that surface charge does not convolute recorded signals, enabling topography
to be faithfully reproduced29 within the framework of traditional SICM experiments.
For lower electrolyte conditions (most prominently below 10 mM) the diffuse
double layer (DDL) at charged interfaces expands further into solution, with a Debye
length of a few nanometers, and even more in media with lower dielectric constants
and/or lower ionic strength.38 This effect leads to ion current rectification phenomena
at nanopipette tips in bulk solution39-41 as well as surface induced rectification,42, 43
once a nanopipette approaches towards a charged surface. Indeed, near a surface,
there is a polarity-dependent current enhancement or diminution, due to the double
layer at the surface modulating the transport of ions travelling through the nanopipette
opening,42, 44 in contrast to the expectations of the operation of conventional SICM.27
This phenomenon has recently been explored and used to map surface charge
heterogeneities using a classical DM-SICM setup.44 However, there are a number of
issues with this technique. The mechanical oscillation of the tip in DM-SICM, limits
the range of working distances achievable with the nanopipette and consequently the
exerts mechanical forces on the sample, which may influence its response, for
example when living cells are studied. The requirement of a large bias between the
two QRCEs has also been suggested to lead to fluidic instabilities which impact on
the surface.43 Finally, for smaller probes, it becomes especially difficult to separate
topography and surface charge.44
We have recently proposed an alternative approach for positionable feedback
control of nanopipettes in SICM, whereby the tip-to-substrate separation is controlled
through the application of an oscillating bias between the two QRCEs to generate an
AC signal.45 It has been demonstrated that at high electrolyte concentrations, bias
modulated (BM)-SICM provides a stable feedback for tracking surface topography
with oscillation around 0 V between the two QRCEs, at a range of frequencies using
either the AC amplitude or AC phase signals. In this paper, we reveal the capabilities
of BM-SICM for accurate tracing of the surface topography at charged substrates, at
low electrolyte concentrations, by minimizing (virtually eliminating) polarity
dependent effects of surface charge in the conductimetric response. Moreover, we
further highlight the possibility of probing and mapping unevenly distributed charge
at interfaces by sensing of the local ionic environment within a double layer. This is
achieved through the use of a hopping approach and CV measurement at each pixel in
an image, with certain biases between the two QRCEs shown to highlight surface
charge in a sensitive manner while, for others, the current response is insensitive to
the surface charge, thus revealing only the topography with high precision. With the
aid of finite element method (FEM) modeling, we verify the experimental
observations and demonstrate the sensitivity of the AC voltammetric response to the
topographical and surface charge imaging, this work provides a robust platform for
future local nanoscale impedance experiments.
RESULTS AND DISCUSSION
Bias Modulated-SICM as an ion-sensing probe of double layers. An uncompensated surface charge in electrolyte solutions leads to the formation of a
diffuse double layer, consisting of co- and counterions that balance the charge. The
approach herein is to probe the ionic atmosphere of the double layer
electrochemically (conductimetrically) with a nanopipette and derive surface charge
information. At low electrolyte concentrations, glass (or quartz) nanopipettes with
small tip openings exhibit perm-selectivity39, 40 towards counter ions of the DDL, that
have enhanced concentration near the charged nanopipette walls. In combination with
asymmetric mass-transport rates inside and outside nanopipettes (taking into account
the geometrical configuration of the probe) the absolute value of ionic current driven
through the opening becomes polarity dependent and this diode-like behavior is
known as ion current rectification (ICR).39-41, 46, 47
When a nanopipette approaches a charged surface, the rectifying
characteristics of the probe can be modified due to the presence of the DDL at the
surface.42, 44 As a result, the surface-induced rectification contributes significantly to
the overall mass-transport properties of the nanopipette and, in principle, this effect
can be employed for probing and mapping surface charge.44 However, as mentioned
in the introduction, the DC or AC components of ionic current, are also
distance-dependent and this presents a conundrum as to how to separate charge and distance
current driven through the nanopipette cannot necessarily be reliably employed for
either task – probing the surface charge or tracking the topography.44 For surfaces
with large topographical features and relatively low surface charge densities, the
implications of this may not be noticeable,44 but as the resolution of the technique is
advanced with smaller nanopipettes being utilized and smaller topographical features
being probed,36, 48 the resulting effects of surface charge heterogeneities on the
DM-SICM feedback, may become much more apparent.
Herein, we present an elegant way to resolve both surface topography and
charge by using BM-SICM (Figure 1a). In a BM-SICM configuration, a small
harmonic oscillation of potential is applied to induce an AC ionic current component,
which can be used for vertical probe positioning even in the absence of mean bias
applied between two QRCEs.45 Additionally, by applying an additional bias, V, we
show herein that one can control the extent to which the SICM current response is
sensitive (or not) to surface charge. In essence for V = 0, the BM-SICM response
faithfully maps topography (Figure 1b), due to minimal surface induced rectification
about 0 V, while for V 0 the SICM response becomes surface charge sensitive.
Note that by maintaining V = 0 on approach for topographical imaging in this work,
the scenario of traditional SICM experiments is avoided where, based on recent
work,42, 44 an applied bias upon approach to heterogeneously charged substrates, may
result in a non-constant working distance and hence distorted topography (Figure 1c).
To demonstrate the efficacy of BM-SICM for probe positioning near a
surface, independent of surface functionality, a series of nanopipette approaches
towards positively (APTES) and negatively (glass) charged substrates was carried out
at different nanopipette biases, applied to the probe. Here the distance, d, was defined
is the absolute tip-substrate distance. These approach curves, and all experimental and
simulation studies herein, were performed using an oscillation frequency of 270 Hz.
This frequency was selected based on our recent work45 and impedance studies
performed herein (see Supporting Information, section SI-2) that highlights a
frequency domain where the AC phase is most sensitive to changes in both system
capacitance and resistance. This region is where the slope of the Bode plot of AC
phase against frequency is greatest, which can be seen to exist between 100 Hz and 1
kHz, for the experimental conditions of the experiments herein (Supporting
Information, Figure S2). Below this frequency range, the phase is zero, as the current
solely passes through the resistive component of the system. Above this frequency
range the current is dominated by the capacitive component of the system.
As expected, based on recent DM-SICM studies,42, 44 at close probe-substrate
separations in BM-SICM surface-induced rectification influences the mass-transport
of ions, leading to surface-enhanced or diminished ion current values, compared to
the bulk to which currents are normalized (Figure 2a and b), depending on the
substrate charge and the SICM bias polarity. The AC phase shift (which we define
throughout as the distance-dependent phase with respect to that with the nanopipette
in bulk) is particularly sensitive to the presence of surface charge at the substrate
when V 0 (see Figure 2c and d), an aspect we explore further below with FEM
simulations. The AC amplitude also exhibits a dependence on the substrate surface
charge, albeit weaker, seen to be enhanced under the same conditions as the DC
enhancement and diminished with decreasing DC values (see Supporting Information,
SI-3 for AC amplitude approach curves recorded simultaneously with the data in
Figure 2). Interestingly, although these effects are manifested at low ionic strength,
strength, up to 0.1 M, even though the magnitude of the effect decreases with
increasing concentrations (see Supporting Information SI-4 for data). These data have
important implications for how topographical SICM experiments are designed (to
avoid charge effects), but could also be exploited to allow for the probing of the
double layer at biological samples in vivo, which require a physiological environment
(relatively high ionic strength) for viability. Note that the data are especially
significant as we have used a relatively large SICM tip for these studies, and the
effects seen at high ionic strength would be magnified with smaller tip sizes deployed
at closer sample distances.
A major observation in Figure 2 is that with no mean bias (V = 0, with just a
small amplitude oscillation of the bias between the QRCEs) the phase shift is
intrinsically a distance-dependent quantity and is relatively insensitive to surface
charge. The phase of the AC current (with respect to the bulk response) shifts slightly
positive over both the negatively charged glass substrate and positively charged
APTES functionalized substrate (Figure 2c and d). In order to account for these AC
effects, and to assess BM-SICM for topographical and charge mapping, finite element
simulations were used to study the AC and DC SICM response towards a harmonic
perturbation of the electric potential.
Theory and simulations. The simulation of the harmonic perturbation of the DDL
due to an applied alternating potential is a complicated task, especially in a nanopore
or nanopipette configuration, and a typical treatment of this problem is performed in
terms of equivalent electrical circuits.45, 49 Here, we adopt a more general approach by
studying the ionic transport and ion distributions, from which we can derive the
Ions are considered as point charges, while ionic transport is assumed to
follow the classical Nernst-Planck relationship, where the flux Ji of species, i, is given
as
Ji = -DiÑci-zi F
RT DiciÑf (1)
while the Poisson equation describes the electrical potential :
Ñ2
f
= - Fee
0 zicii
å
(2)Here ci denotes the species concentration, while Di, zi, F, R, T, and 0 specify
constants: system diffusion coefficient of i, its charge number, the Faraday constant,
gas constant, temperature, relative permittivity and vacuum permittivity, respectively.
Throughout this work a surface charge density on the nanopipette tip was
assumed to be -1.125 mC m-2 (140 nm2 per ionized site), consistent with previously
reported simulations.40-42, 50, 51 However, the actual density of ionizable sites strongly
depends on the nature of the material and could vary within the range of
microcoulombs to a few hundreds of millicoulombs per squared meter of a surface.42,
52-55
The system of differential equations (1) and (2) was solved with appropriate
boundary conditions (see section SI-1 and Table S1, Supporting Information), for a
particular Vand assuming flux conservation in a first step (eq. 3)
ÑJi =0 (3)
Then, for AC analysis, a harmonic bias modulation was applied between the
two QRCEs in the form of a linearized perturbation in the frequency domain
where j is the imaginary unit and is the angular frequency (full details of the FEM
simulations are given in section SI-1, Supporting Information).
This approach provides a powerful framework to study the impedance
response both in bulk (see for example Figure S2, supporting information SI-2) and
with a nanopipette positioned at different separations from a charged or uncharged
substrate. As highlighted earlier in Figure 2, the experimental phase shift with zero
net bias, V = 0, as a function of distance appeared relatively insensitive to the
surface charge, while for an applied bias (V 0) there was a surface-charge
dependent phase shift.
Figure 3a shows simulated approach curves towards substrates with applied
surface charge of 30 mC m-2 (5 nm2 per ionized site) and 0 mC m-2. It can be seen
that the model predicts the phase shift of the induced harmonic ion current to be
almost independent of surface charge when there is no DC bias offset between the
QRCEs, similar to the experimental observations in Figure 2c and d. This effect has a
very important consequence for careful (and accurate) probe positioning over a
sample surface, as the phase shift value is an intrinsically sensitive quantity that
evidently depends predominantly on the tip-to-substrate distance when V = 0. Under
these conditions, Figure 3a (and Figures 2c and 2d) make it clear that with V = 0, the
phase shift can be used as a set point for determining topography and being able to
position the probe at close tip-to-substrate separations, which is important for
enhancing the resolution of SICM.56, 57
In a similar way to the experimental approaches at non-zero bias (Figure 2),
the model predicts a dramatic change of the phase-distance behavior for V 0.
Figure 3b depicts theoretically predicted approach curves that demonstrate the
negative under conditions when an enhanced ionic current is observed, that is when
negative V is applied to the tip QRCE with a negatively charged substrate. In this
case the system resistance, upon approaching the substrate, decreases and so more
current flows through the resistive component of the system, resulting in the phase
tending more towards 0 degrees, thus explaining the negative phase shift from the
bulk value, which is between 0 and 90 degrees (Supporting Information SI-2, Figure
S2). It can further be seen that the magnitude of the effect scales with the surface
charge density, as would be expected. As the polarity of the bias is reversed, so that
the nanopipette QRCE is positive, the negatively charged substrate now induces a
diminution of the ionic current and a positive shift in the phase is observed. In this
case, the system resistance increases as the tip approaches, so more current flows
through the capacitive component of the system and the phase tends to increase
towards 90 degrees. Thus, a positive phase shift from that with the nanopipette in bulk
is observed. The simulated DC signal mirrors this behavior (Supporting Information
SI-5, Figure S5) with the DC current increasing compared to the bulk at close
tip-substrate distances (negatively charged tip-substrate) with positive bias on the
nanopipette QRCE, but decreasing at negative bias.
From these data it is clear that even a relatively small surface charge
(down to 1 mC m-2, equivalent to 160 nm2 per ionized site) leads to strong variation of
the phase shift with bias, that is particularly noticeable when the probe is brought in
close proximity to a substrate (especially, at distances below one tip radius, d < rtip).
This effect, revealed with an applied bias, can therefore be employed for mapping
surface charge with the nanopipette held at a constant distance above the specimen
Figure 3c shows the phase shift with a 75 nm radius nanopipette positioned 25
nm above a charged substrate, as a function of surface charge density for 3 biases, V
= +0.3 V, 0 V and -0.3 V. The plots clearly illustrate the sensitivity of the technique,
at a constant probe-to-substrate distance, to distinguish between values of surface
charge. Importantly, at 0 V bias, a wide range of surface charges have little influence
on the phase, making this condition ideal for detecting surface topography, as
discussed above. The sensitivity (magnitude) of the phase to a particular surface
charge is similar at both positive and negative bias polarities, although the technique
offers slightly higher sensitivity in cases when surface-induced rectification acts to
enhance the ionic current (e.g. at negative tip bias over a positively charged surface or
at positive tip bias over a negatively charged surface).
The reasons for the striking effect of bias on the phase response (Figures 3)
and DC current response of BM-SICM (Figure 2) with charged surfaces becomes
apparent from the distribution of electrical potential and ion concentrations near the
tip opening (when held in the proximity of a surface). With a 0 V bias offset there is
almost no perturbation of the DDL at the substrate, which remains intact. The
application of bias, however, is known to lead to ICR inside the nanopipette itself39-41
(when it is freely suspended in bulk) and a surface-induced rectification.44 This causes
a drastic change in the nanopipette conductance state depending on bias polarity and
surface charge due to a significant change of ionic conductivities (and therefore, the
overall resistance) within and near the tip opening (see Figure 3e and f for V values
of +0.3 V and -0.3 V, respectively). In turn, the AC ion current components,
particularly the phase shift, which are highly sensitive to the overall resistance, as
explained above, also demonstrate a strong dependence to the nature of the charged
Probing acid-base equilibria at interfaces. To illustrate the capabilities of
BM-SICM for sensing variations of surface charge, a series of approaches towards glass
substrates was carried out as a function of bulk pH (surface titration experiments).
The electrostatic charge on glass and silica surfaces is typically attributed to
the presence of silanol groups (SiOH) due to the following acid-base equilibrium:
(5)
The dissociation process, however, is rather complicated and depends on the
particular type of silica and any surface treatment. In a first approximation, the degree
of dissociation depends on the inherent properties of the glass-electrolyte interface
(given by the intrinsic dissociation constant, Kint) as well as the electrostatic potential
on the surface, 0:58
[H+]GSiO -GSiOH
=Kintexp Fy0
RT
é ëê
ù
ûú (6)
A broad range of silica interfaces show a pKint in the range 7 7.552, 54 and the surface
charge density, , can be estimated, using equation (6) along with mass-conservation,
which defines the surface concentrations of protonated and deprotonated sites (SiOH
and SiO-, respectively)
s = -eGSiO- = -eGtotal
Kint10pHexp Fy0
RT
é ëê
ù ûú
1+Kint10pHexp Fy0
RT é ëê ù ûú (7)
where total represents the total number of silanol groups per unit area and e is the
elementary charge. The surface potential can be calculated from the Grahame
equation (for monovalent electrolyte ions present at c0 bulk concentration):58
s =
(
8RTee0c0)
1/2sinh Fy02RT
é ëê
ù
Solution of equations (7) and (8) provides the self-consistent surface charge density
value. However, surface acid-base equilibria on other types of silica are characterized
by two dissociation constants53, 59 with corresponding pKa of 4.5 and 8.5. These
values are associated with two different types of titratable silanol groups, present at
the surface at 19% and 81% of the total number of ionized sites, respectively.53, 59 The
total surface charge density is therefore given through both contributions.
It follows that under ambient conditions (pH 7) a small fraction of silanol
groups are ionized, resulting in a negatively charged surface. The experimental
approaches of phase shift vs. tip to surface distance, d, shown in Figure 4 for an
applied bias V = -0.3 V to the nanopipette (and the DC data in Figure S6, Supporting
Information SI-6) confirm the presence of a negative surface charge under these
conditions, as surface-enhanced rectification induces a significant decrease of the AC
phase value (and increase in the DC value, Figure S6, Supporting Information SI-6),
when the nanopipette is brought into the vicinity of the substrate.
In more acidic solutions, increasing protonation of the silanol groups leads to
an overall decrease of (absolute) surface charge density. Experimental phase
shift-distance approach curves (Figure 4) under these conditions (pH = 2.1 – 4.3), reveal a
smaller surface-enhanced rectification at lower pH. At pH values around 2.1 – 2.5 the
AC phase shift-distance curves approach the behavior expected at an uncharged
interface, in good agreement with a point of zero charge found on most of silica
materials (typically, in the pH range 2 – 4).60 Approach curves shown in Figure 4
evidence an almost linear variation of near-surface phase shift with pH over the range
studied. Based on our simulations presented above (Figure 3c), this behavior suggests
a linear-like titration of surface charges with pH. Dedicated modeling in the future
needs to be recognized that other processes can complicate the analysis and
interpretation. Although the electric field from the SICM probe is in the kV cm-1
range, a field of this magnitude is unlikely to induce changes in the local acid
disassociation constants, as the Wein effect occurs at hundreds of kV cm-1.61-63
However local ion mobilities, particularly of protons at surfaces,64, 65 maybe high and
would need to be taken into account, with the tip-induced field possibly altering local
pH values.
Surface charge mapping. Simultaneous mapping of surface charge distributions
along with independent recording of surface topography is a particular advantage of
the SICM technique described herein: an AC phase shift at 0 V mean bias can be used
for a positionable feedback control, whereas measurements at V ≠ 0 allow the
detection of surface charge. We implemented this concept using a hopping
voltammetric scan strategy, where the nanopipette was approached towards the
substrate until a set value of a feedback parameter (phase shift, 0.5 used herein) was
reached, followed by the recording of a cyclic voltammogram at that position (for
which we present the linear part between -0.4 and 0.4 V) to sense the charge. The
probe was then moved away from the surface and to the next pixel such that a spatial
array of voltammograms was recorded. At each pixel, a voltammogram was recorded
when the probe was away from the surface (d = 500 nm) and this response was
subtracted from the surface voltammogram to reveal only the surface ICR. Examples
of bias-dependent phase responses close to glass, polystyrene and in bulk are given in
Supporting Information, section SI-7.
The capability of this approach was validated for a partial polystyrene film on
glass) in the polystyrene layer. This substrate thus comprised both negatively charged
glass regions, in 10 mM KCl solution, and neutral areas (uncharged polymer film).
The topography recorded from the initial approaches to the substrate at V = 0 is
shown in Figure 5a. This matches well to the typical topography recorded using AFM
(Figure 5b). Taking into account the working distance (given by the set point value,
corresponding to ca. 25 nm), SICM allows careful examination of substrate
topography independently of surface charge. Even the smaller nanoscale pits in the
film are apparent in the BM-SICM topography, an advance on our recent DM-SICM
studies44 in terms of resolution.
Significantly, the protocol used produces voltammetric data that can be
represented as 81 image frames (phase and DC as a function of x, y position) at a set
of different bias values at 10 mV intervals. Maps of the DC current at the surface,
normalized by that in bulk, and AC phase shift at the surface with respect to bulk
(subtracted) at -0.3 V and 0.3 V are presented in Figure 5c f. (A full image sequence
is given in a form of video files DC_CV_Polystyrene and Phase_CV_Polystyrene; see
Supporting Information, SI-8). These images, free from topographical effects, are
highly revealing of the charge distribution across the surface, which is evidently very
heterogeneous, from both the DC current and phase maps. In particular, it can be seen
that there is an increase in the ion current magnitude, when a higher conductance state
is formed. That is, with a negative tip bias applied to the nanopipette over negatively
charged regions (Figure 5c), where the normalized current magnitude ratio attains
values between 1.1 and 1.2; or current diminution with positive tip bias in negatively
charged regions where the normalized current attains values <0.8 (Figure 5e).
The corresponding phase behavior (Figures 5d and f) shows the interfacial
detected as a change in the ratio between the capacitative and resistive behavior of the
nanopipette (and better signal to noise due to measurement with the lockin amplifier).
When the nanopipette experiences a low conductance state, the capacitance provides a
larger contribution, which ideally has 90 degrees phase shift with respect to the
driving voltage, while at a high conductance state a nanopipette acts more like as a
resistor (0 degrees phase shift for resistor circuit component).
The change of the conductance state of the nanopipette is also seen in
voltammograms recorded at each pixel during imaging. As follows from the image
sequences (see Supporting Information Figure S7 and the video files in section SI-8),
the AC phase shift flips from negative to positive as the bias (V) is scanned from
negative to positive values through 0 V. With the bias ca. 0 V, however, the phase
signal across both the glass and polystyrene regions of the sample is close to the set
point value because of the insensitivity of the phase to surface charge when V = 0, a
key feature of this technique that we have described.
These data allow the standard deviation of every pixel value of each DC and
phase image in the sequence to be calculated, with results shown in Figures 5g and h.
It is clear that around V = 0, the images are relatively featureless (small standard
deviation), but increase with a higher magnitude of applied potential, consistent with
the greater contrast between the heterogeneously charged regions seen at 0.3 V.
Interestingly, the region where the standard deviation attains a minimum is relatively
broad (-0.2 V – 0.1 V) for the DC signal, highlighting the lower sensitivity of the DC
signal (Figure 5g) towards surface charge compared to the AC phase signal (Figure
This work provides a robust framework for nanoscale mapping of surface charge
variations at substrates through sensing the ionic atmosphere of the diffuse double
layers formed at interfaces with a simple nanopipette approach. We have explored the
versatility of bias-modulated SICM for independent and accurate characterization of
the topographical and charge properties of surfaces, using the capability of BM-SICM
for performing experiments in the absence of a mean applied bias. In this situation,
the nanopipette can be carefully positioned over the sample at a desired distance,
using a set point value of the AC phase shift of the ionic current, which is shown to be
a distance-dependent quantity, essentially unaffected by surface charge that makes it
ideal for topographical mapping.
At non-zero bias, however, BM-SICM becomes an extremely sensitive tool
for probing surface charge via surface-induced rectification. Our experimental
findings, supported by finite element simulations, suggest that AC components of the
ionic current, and, in particular, the phase shift are very responsive to the local
resistance and, correspondingly, variations in surface charge. The possibility of
imaging heterogeneities of surface charge makes this technique indispensable for
surface science, to unravel structure-functional relationships and to provide insights
on interfacial processes and adsorption equilibria that modify the charge. Here, we
have been able to resolve topography, free from surface-charge effects, and obtain
semi-quantitative insights into surface charge. Further quantitative analysis will
require extremely detailed characterization of tip geometry and charge (which is often
not the precise conical shape assumed in this and other work), and the charge/ICR
characteristics of the nanopipette itself, as well as considerations of changes in ion
mobility near surfaces. For future studies, transmission electron microscopy of glass
perspective, this nanopipette approach should offer detailed quantification of surface
charges.
MATERIALS AND METHODS
Solutions. Milli-Q reagent grade water (resistivity ca. 18.2 MΩ cm at 25°C) was used for all solutions. For the BM-SICM approach curve measurements to glass,
impedance studies and BM-SICM imaging, 10 mM KCl (Sigma-Aldrich, pH 6.5)
solutions were prepared. To produce the polystyrene-glass substrate for imaging,
polystyrene (Sigma-Aldrich) was dissolved in chloroform (Fisher Scientific) giving a
solution (0.66 mg/ml) into which a glass slide was dip-coated (30 s) to create a
polystyrene film. A solution of 3-aminopropyl triethoxysilane (APTES, Sigma
Aldrich) in toluene (2 l/ml) was used for glass surface modification for some
experiments (dip-coated for 5 min). All impedance measurements and approach curve
studies carried out on APTES samples were done in a slightly acidic solution of HCl
(pH 3.4, Fisher Scientific) and KCl (9 mM). Solutions with varying ratios of KCl to
HCl (keeping 10 mM constant ionic strength) were used to explore the effect of pH on
the surface charge of glass. Approach curve measurements were also carried out
towards glass in 1 100 mM KCl solutions to test the limits at which surface charge
effects could be observed.
Nanopipettes. Nanopipettes (75 nm radius, inner taper angle 2.5 – 3.5°, dimensions
measured with a Zeiss Supra55VP field emission scanning electron microscope) were
pulled from borosilicate glass capillaries (o.d. 1.2 mm, i.d. 0.69 mm, Harvard
Apparatus) using a laser puller (P-2000, Sutter Instruments; pulling parameters: Line
Pul 120). We deliberately chose to use a relatively large tip to produce a well-defined
probe that was easily characterized. Although surface charge effects would be
expected to be less prominent than on smaller tips;42, 44 they are still shown to be
significant with major implications for nanoscale SICM imaging as we discuss herein.
Substrates. Glass bottomed petri dishes with detachable cover slips (3512, WillcoWells) were used as glass samples, either as received, after sonication in
acetone (10 min), sonication in water (10 min) and plasma ashing in oxygen (1 min,
100 W), or after functionalization with either polystyrene or APTES. The polystyrene
samples were dip coated to produce a heterogeneous thin neutral polystyrene film
with exposed negatively charged glass regions, under the condition of the
measurements (aerated, unbuffered, 10 mM KCl, pH 6.5).
Instrumentation. The basic instrumentation has been described elsewhere.45, 67 Briefly, movement of the SICM probe in the direction normal to the substrate was
controlled using a piezoelectric positioning stage of range 38 µm (P-753-3CD, Physik
Intrumente) with lateral movement of the substrate controlled using a two-axis
piezoelectric positioning system with a range of 300 µm (Nano-BioS300, Mad City
Labs Inc.) The current-to-voltage converter used to measure currents was custom
built. A lock-in amplifier (SR830, Stanford Research Systems) was used to generate
the oscillating signal for BM-SICM approaches and to extract the phase and
amplitude of the AC ion current. Data recording, as well as the probe position and
voltage output control, was performed using a custom written LabVIEW (2013,
National Instruments) program through an FPGA card (7852R, National Instruments).
Impedance measurements were carried out using a Gamry Femtostat (FAS2-38039),
Bias Modulated-Scanning Ion Conductance Microscopy approaches. An
oscillating bias (10 mV rms amplitude, 270 Hz) was applied between the two QRCEs
about mean biases of -0.3 V, 0 V and 0.3 V. All potentials quoted herein refer to the
potential of the QRCE inside of the nanopipette with respect to the bulk QRCE.
Nanopipettes were approached towards glass and APTES-coated substrates at 10 nm
s-1 and the DC, AC phase and AC amplitude of the ionic current were recorded
simultaneously. Approaches towards glass were also carried out in 10 mM electrolyte
concentration with the pH varying between 2.1 (10 mM HCl) and 6.5 (10 mM KCl) to
vary the surface charge on the glass substrate.
Bias Modulated-Scanning Ion Conductance Microscopy imaging. BM-SICM images were acquired with a positionable nanopipette in a hopping mode, while applying a small oscillation to the bias (10 mV rms amplitude, 270 Hz) about 0 V. In this mode, the probe was translated towards the surface at each image pixel at 700 nm s-1 until the surface was detected through a 0.5° increase in the AC phase signal. The piezo height at this point was used to generate topographical maps (as under these conditions the SICM response was relatively insensitive to surface charge effects;
vide infra). The bias between the QRCEs was then swept linearly up to 0.4 V,
reversed to -0.4 V, and finally returned to 0 V at a rate of 1 V s-1, and the AC phase and DC recorded, enabling polarity-dependent surface charge mapping. As well as movies of SICM response vs. applied potential (presented over the range -0.4 V to 0.4 V), representative maps at specific potentials as an average of several maps over potentials within ±5 mV of the stated bias value were extracted, by taking average values of the AC and DC response for each pixel in the map.
surface (with a varying tip-to-substrate separation distance). Simulations were
constructed in Comsol Multiphysics (version 4.4), using the transport of diluted
species and electrostatics modules, using harmonic bias perturbation boundary
conditions to simulate the AC behavior of the BM-SICM setup (for more details see
Supporting Information SI-1).
Impedance measurements. The Gamry Femtostat was connected between the two
QRCEs: one in the nanopipette and one in bulk solution. Impedance spectra were
collected at a set of frequencies between 1 Hz and 100 kHz, with 9 points per decade.
Impedance measurements were performed with a 10 mV rms oscillation with 0 V
mean bias.
Atomic Force Microscopy. Contact mode atomic force microscopy (AFM) (Catalyst,
Bruker-Nano), using silicon tips on a nitride lever (SNL-10, Veeco), was employed
for the analysis of sample substrates.
Acknowledgement:This work was supported by the European Research Council through Project ERC-2009 AdG 247143-QUANTIF, EPRSC (grant number
EP/F500378/1 through the MOAC DTC) and a Marie Curie IntraEuropean
Fellowship 626158 FUNICIS (D.M.). The authors thank A. Colburn for the custom
built electronics and K. McKelvey for the development of instrumentation and
software.
Supporting Information available: The SI includes FEM model details and
schematic, impedance measurements. Also provided are typical AC amplitude
Theoretical DC approach curves and DC approach curves in varying pH are included,
as well as experimental phase-voltage curves and the image sequences in the form of
REFERENCES
1. Sahın, Ö.; Nusret Bulutcu, A. Effect of Surface Charge Distribution on the Crystal Growth of Sodium Perborate Tetrahydrate. J. Cryst. Growth 2002, 241, 471-480.
2. Lin, N. H.; Shih, W.-Y.; Lyster, E.; Cohen, Y. Crystallization of Calcium Sulfate on Polymeric Surfaces. J. Colloid Interface Sci. 2011, 356, 790-797. 3. Bodhak, S.; Bose, S.; Bandyopadhyay, A. Role of Surface Charge and
Wettability on Early Stage Mineralization and Bone Cell–Materials Interactions of Polarized Hydroxyapatite. Acta Biomater. 2009, 5, 2178-2188.
4. Hirsch, V.; Kinnear, C.; Moniatte, M.; Rothen-Rutishauser, B.; Clift, M. J. D.; Fink, A. Surface Charge of Polymer Coated Spions Influences the Serum Protein Adsorption, Colloidal Stability and Subsequent Cell Interaction in Vitro.
Nanoscale 2013, 5, 3723-3732.
5. Chan, D. Y.; Pashley, R. M.; White, L. R. A Simple Algorithm for the
Calculation of the Electrostatic Repulsion between Identical Charged Surfaces in Electrolyte. J. Colloid Interface Sci. 1980, 77, 283-285.
6. Ohshima, H.; Healy, T. W.; White, L. R. Accurate Analytic Expressions for the Surface Charge Density/Surface Potential Relationship and Double-Layer Potential Distribution for a Spherical Colloidal Particle. J. Colloid Interface Sci.
1982, 90, 17-26.
7. Tufenkji, N.; Elimelech, M. Breakdown of Colloid Filtration Theory: Role of
the Secondary Energy Minimum and Surface Charge Heterogeneities. Langmuir
2005, 21, 841-852.
8. Cuesta, A. Measurement of the Surface Charge Density of Co-Saturated Pt
(111) Electrodes as a Function of Potential: The Potential of Zero Charge of Pt (111). Surf. Sci. 2004, 572, 11-22.
9. Manzini, M. C.; Perez, K. R.; Riske, K. A.; Bozelli Jr, J. C.; Santos, T. L.; da Silva, M. A.; Saraiva, G. K. V.; Politi, M. J.; Valente, A. P.; Almeida, F. C. L., et al. Peptide:Lipid Ratio and Membrane Surface Charge Determine the Mechanism of Action of the Antimicrobial Peptide Bp100. Conformational and Functional Studies. Biochim. Biophys. Acta, Biomembr. 2014, 1838, 1985-1999.
10. Chen, L.; Mccrate, J. M.; Lee, J. C.; Li, H. The Role of Surface Charge on the Uptake and Biocompatibility of Hydroxyapatite Nanoparticles with Osteoblast Cells. Nanotechnology 2011, 22, 105708.
11. Chung, T.-H.; Wu, S.-H.; Yao, M.; Lu, C.-W.; Lin, Y.-S.; Hung, Y.; Mou, C.-Y.; Chen, Y.-C.; Huang, D.-M. The Effect of Surface Charge on the Uptake and Biological Function of Mesoporous Silica Nanoparticles in 3t3-L1 Cells and Human Mesenchymal Stem Cells. Biomaterials 2007, 28, 2959-2966.
12. Xiao, K.; Li, Y.; Luo, J.; Lee, J. S.; Xiao, W.; Gonik, A. M.; Agarwal, R. G.; Lam, K. S. The Effect of Surface Charge on in Vivo Biodistribution of Peg-Oligocholic Acid Based Micellar Nanoparticles. Biomaterials 2011, 32, 3435-3446.
13. Dobrovolskaia, M. A.; Patri, A. K.; Simak, J.; Hall, J. B.; Semberova, J.; De Paoli Lacerda, S. H.; McNeil, S. E. Nanoparticle Size and Surface Charge Determine Effects of Pamam Dendrimers on Human Platelets in Vitro. Mol. Pharmaceutics
2011, 9, 382-393.
14. Asati, A.; Santra, S.; Kaittanis, C.; Perez, J. M. Surface-Charge-Dependent Cell Localization and Cytotoxicity of Cerium Oxide Nanoparticles. ACS Nano
15. Ghosh, P. S.; Kim, C.-K.; Han, G.; Forbes, N. S.; Rotello, V. M. Efficient Gene Delivery Vectors by Tuning the Surface Charge Density of Amino
Acid-Functionalized Gold Nanoparticles. ACS Nano 2008, 2, 2213-2218.
16. Bakhti, M.; Snaidero, N.; Schneider, D.; Aggarwal, S.; Möbius, W.; Janshoff, A.; Eckhardt, M.; Nave, K.-A.; Simons, M. Loss of Electrostatic Cell-Surface
Repulsion Mediates Myelin Membrane Adhesion and Compaction in the Central Nervous System. Proc. Natl. Acad. Sci. U. S. A. 2013, 110, 3143-3148.
17. Arjmandi, N.; Van Roy, W.; Lagae, L.; Borghs, G. Measuring the Electric Charge and Zeta Potential of Nanometer-Sized Objects Using Pyramidal-Shaped Nanopores. Anal. Chem. 2012, 84, 8490-8496.
18. Sprycha, R. Electrical Double Layer at Alumina/Electrolyte Interface: I. Surface Charge and Zeta Potential. J. Colloid Interface Sci. 1989, 127, 1-11.
19. Szekeres, M.; Tombácz, E. Surface Charge Characterization of Metal Oxides by Potentiometric Acid–Base Titration, Revisited Theory and Experiment.
Colloids Surf., A 2012, 414, 302-313.
20. Gibson, G. T. T.; Mohamed, M. F.; Neverov, A. A.; Brown, R. S.
Potentiometric Titration of Metal Ions in Ethanol. Inorg. Chem. 2006, 45, 7891-7902.
21. Sánchez, J.; del Valle, M. Determination of Anionic Surfactants Employing Potentiometric Sensors—a Review. Crit. Rev. Anal. Chem. 2005, 35, 15-29. 22. Heinz, W. F.; Hoh, J. H. Relative Surface Charge Density Mapping with the Atomic Force Microscope. Biophys. J. 1999, 76, 528-538.
23. Miyatani, T.; Okamoto, S.; Rosa, A.; Marti, O.; Fujihira, M. Surface Charge Mapping of Solid Surfaces in Water by Pulsed-Force-Mode Atomic Force Microscopy. Appl. Phys. A Mater. Sci. Process. 1998, 66, S349-S352.
24. Miyatani, T.; Horii, M.; Rosa, A.; Fujihira, M.; Marti, O. Mapping of Electrical Double-Layer Force between Tip and Sample Surfaces in Water with Pulsed-Force-Mode Atomic Force Microscopy. Appl. Phys. Lett. 1997, 71, 2632-2634. 25. Hillier, A. C.; Kim, S.; Bard, A. J. Measurement of Double-Layer Forces at the Electrode/Electrolyte Interface Using the Atomic Force Microscope: Potential and Anion Dependent Interactions. J. Phys. Chem. 1996, 100, 18808-18817. 26. Manne, S.; Cleveland, J.; Gaub, H.; Stucky, G.; Hansma, P. Direct
Visualization of Surfactant Hemimicelles by Force Microscopy of the Electrical Double Layer. Langmuir 1994, 10, 4409-4413.
27. Chen, C. C.; Zhou, Y.; Baker, L. A. Scanning Ion Conductance Microscopy. Annu. Rev. Anal. Chem. 2012, 5, 207-28.
28. Happel, P.; Thatenhorst, D.; Dietzel, I. D. Scanning Ion Conductance Microscopy for Studying Biological Samples. Sensors 2012, 12, 14983.
29. Rheinlaender, J.; Geisse, N. A.; Proksch, R.; Schäffer, T. E. Comparison of Scanning Ion Conductance Microscopy with Atomic Force Microscopy for Cell Imaging. Langmuir 2010, 27, 697-704.
30. Shevchuk, A. I.; Gorelik, J.; Harding, S. E.; Lab, M. J.; Klenerman, D.; Korchev, Y. E. Simultaneous Measurement of Ca2+ and Cellular Dynamics: Combined Scanning Ion Conductance and Optical Microscopy to Study Contracting Cardiac Myocytes. Biophys. J. 2001, 81, 1759-1764.
32. Novak, P.; Li, C.; Shevchuk, A. I.; Stepanyan, R.; Caldwell, M.; Hughes, S.; Smart, T. G.; Gorelik, J.; Ostanin, V. P.; Lab, M. J. Nanoscale Live-Cell Imaging Using Hopping Probe Ion Conductance Microscopy. Nat. Methods 2009, 6, 279-281. 33. Korchev, Y.; Milovanovic, M.; Bashford, C.; Bennett, D.; Sviderskaya, E.; Vodyanoy, I.; Lab, M. Specialized Scanning Ion‐Conductance Microscope for Imaging of Living Cells. J. Microsc. 1997, 188, 17-23.
34. Ushiki, T.; Nakajima, M.; Choi, M.; Cho, S.-J.; Iwata, F. Scanning Ion Conductance Microscopy for Imaging Biological Samples in Liquid: A Comparative Study with Atomic Force Microscopy and Scanning Electron Microscopy. Micron 2012, 43, 1390-1398.
35. Yang, X.; Liu, X.; Zhang, X.; Lu, H.; Zhang, J.; Zhang, Y. Investigation of Morphological and Functional Changes During Neuronal Differentiation of Pc12 Cells by Combined Hopping Probe Ion Conductance Microscopy and Patch-Clamp Technique. Ultramicroscopy 2011, 111, 1417-1422.
36. Takahashi, Y.; Murakami, Y.; Nagamine, K.; Shiku, H.; Aoyagi, S.; Yasukawa, T.; Kanzaki, M.; Matsue, T. Topographic Imaging of Convoluted Surface of Live Cells by Scanning Ion Conductance Microscopy in a Standing Approach Mode. Phys. Chem. Chem. Phys. 2010, 12, 10012-10017.
37. Klenerman, D.; Korchev, Y. E.; Davis, S. J. Imaging and Characterisation of the Surface of Live Cells. Curr. Opin. Chem. Biol. 2011, 15, 696-703.
38. Bard, A. J.; Faulkner, L. R. Electrochemical Methods: Fundamentals and Applications. Wiley New York: 1980; Vol. 2.
39. Wei, C.; Bard, A. J.; Feldberg, S. W. Current Rectification at Quartz Nanopipet Electrodes. Anal. Chem. 1997, 69, 4627-4633.
40. Momotenko, D.; Cortes-Salazar, F.; Josserand, J.; Liu, S.; Shao, Y.; Girault, H. H. Ion Current Rectification and Rectification Inversion in Conical Nanopores: A Perm-Selective View. Phys. Chem. Chem. Phys. 2011, 13, 5430-5440.
41. White, H. S.; Bund, A. Ion Current Rectification at Nanopores in Glass Membranes. Langmuir 2008, 24, 2212-2218.
42. Sa, N.; Lan, W.-J.; Shi, W.; Baker, L. A. Rectification of Ion Current in Nanopipettes by External Substrates. ACS Nano 2013, 7, 11272-11282.
43. Clarke, R. W.; Zhukov, A.; Richards, O.; Johnson, N.; Ostanin, V.; Klenerman, D. Pipette-Surface Interaction: Current Enhancement and Intrinsic Force. J. Am. Chem. Soc. 2013, 135, 322-9.
44. McKelvey, K.; Kinnear, S. L.; Perry, D.; Momotenko, D.; Unwin, P. R. Surface Charge Mapping with a Nanopipette. J. Am. Chem. Soc. 2014,136, 13735-44.
45. McKelvey, K.; Perry, D.; Byers, J. C.; Colburn, A. W.; Unwin, P. R. Bias Modulated Scanning Ion Conductance Microscopy. Anal. Chem. 2014, 86, 3639-46.
46. Sa, N.; Baker, L. A. Rectification of Nanopores at Surfaces. J. Am. Chem. Soc.
2011, 133, 10398-10401.
47. Siwy, Z.; Heins, E.; Harrell, C. C.; Kohli, P.; Martin, C. R. Conical-Nanotube Ion-Current Rectifiers: The Role of Surface Charge. J. Am. Chem. Soc. 2004, 126, 10850-10851.
49. Feng, J.; Liu, J.; Wu, B.; Wang, G. Impedance Characteristics of Amine Modified Single Glass Nanopores. Anal. Chem. 2010, 82, 4520-4528.
50. Sa, N.; Baker, L. A. Experiment and Simulation of Ion Transport through Nanopipettes of Well-Defined Conical Geometry. J. Electrochem. Soc. 2013, 160, H376-H381.
51. Kubeil, C.; Bund, A. The Role of Nanopore Geometry for the Rectification of Ionic Currents. J. Phys. Chem. C 2011, 115, 7866-7873.
52. Behrens, S. H.; Grier, D. G. The Charge of Glass and Silica Surfaces. J. Chem. Phys 2001, 115, 6716-6721.
53. Fisk, J. D.; Batten, R.; Jones, G.; O'Reill, J. P.; Shaw, A. M. pH Dependence of the Crystal Violet Adsorption Isotherm at the Silica-Water Interface. J. Phys. Chem. B 2005, 109, 14475-14480.
54. Sabia, R.; Ukrainczyk, L. Surface Chemistry of Sio 2 and Tio 2–Sio 2 Glasses as Determined by Titration of Soot Particles. J. Non-Cryst. Solids 2000, 277, 1-9. 55. Zhuravlev, L. Concentration of Hydroxyl Groups on the Surface of
Amorphous Silicas. Langmuir 1987, 3, 316-318.
56. Weber, A. E.; Baker, L. A. Experimental Studies of Resolution in Scanning Ion Conductance Microscopy. J. Electrochem. Soc. 2014, 161, H924-H929.
57. Edwards, M. A.; Williams, C. G.; Whitworth, A. L.; Unwin, P. R. Scanning Ion Conductance Microscopy: A Model for Experimentally Realistic Conditions and Image Interpretation. Anal. Chem. 2009, 81, 4482-4492.
58. Stumm, W.; Morgan, J. J. Aquatic Chemistry: Chemical Equilibria and Rates in Natural Waters. John Wiley & Sons: 2012; Vol. 126.
59. Powell, H. V.; Schnippering, M.; Mazurenka, M.; Macpherson, J. V.;
Mackenzie, S. R.; Unwin, P. R. Evanescent Wave Cavity Ring-Down Spectroscopy as a Probe of Interfacial Adsorption: Interaction of Tris (2, 2′-Bipyridine) Ruthenium (Ii) with Silica Surfaces and Polyelectrolyte Films. Langmuir 2008, 25, 248-255.
60. Papirer, E. Adsorption on Silica Surfaces. CRC Press: 2000.
61. Eckstrom, H. C.; Schmelzer, C. The Wien Effect: Deviations of Electrolytic Solutions from Ohm's Law under High Field Strengths. Chem. Rev. 1939, 24, 367-414.
62. Onsager, L.; Kim, S. K. Wien Effect in Simple Strong Electrolytes. J. Phys. Chem. 1957, 61, 198-215.
63. Onsager, L. Deviations from Ohm's Law in Weak Electrolytes. J. Chem. Phys
1934, 2, 599-615.
64. Slevin, C. J.; Unwin, P. R. Lateral Proton Diffusion Rates Along Stearic Acid Monolayers. J. Am. Chem. Soc. 2000, 122, 2597-2602.
65. Lockwood, G. K.; Garofalini, S. H. Proton Dynamics at the Water–Silica Interface Via Dissociative Molecular Dynamics. J. Phys. Chem. C 2014, 118, 29750-29759.
66. Zhou, L.; Zhou, Y.; Baker, L. A. Measuring Ions with Scanning Ion Conductance Microscopy. Electrochemical Society Interface 2014, 47.
67. Nadappuram, B. P.; McKelvey, K.; Al Botros, R.; Colburn, A. W.; Unwin, P. R. Fabrication and Characterization of Dual Function Nanoscale pH-Scanning Ion
Conductance Microscopy (Sicm) Probes for High Resolution pH Mapping. Anal.
FIGURES Figure 1
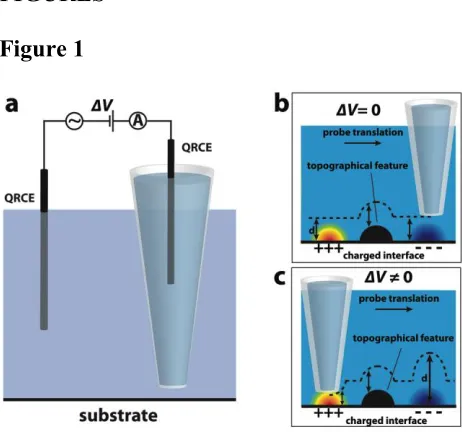
Figure 1. Concept of simultaneous topographical and charge mapping with a positionable nanopipette. a) Schematic representation of the bias-modulation SICM
(BM-SICM) setup. Graphical representation (not to scale) demonstrating
deconvoluted (b) and hypothetically convoluted (c) scanning over a sample
containing topographical (shown in black) and charge features (double layer over
positively and negatively charged areas are shown in rainbow and blue gradients,
respectively). The possible probe trajectory for a fixed set point (target distance, d) is
Figure 2
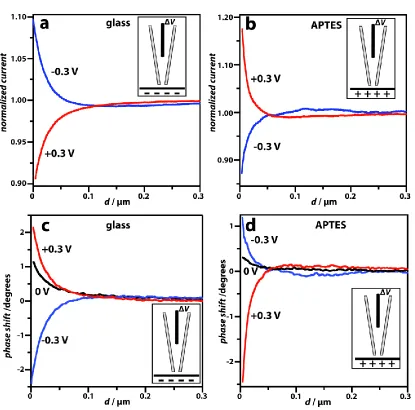
Figure 2. Experimental approach curves depicting: normalized DC ion current (a) and
(b); and phase shift (c) and (d) behavior as a function of the probe-to-substrate
distance, d, recorded with ca. 75 nm radius nanopipette over negatively charged glass
and positively charged APTES substrates at 0.3 V (red lines), -0.3 V (blue lines) and
0 V (black lines) bias offset (V) values. Schematic illustrations, as insets, depict the
nanopipette approaching variously charged substrates for the corresponding plots. The
DC ionic currents are normalized to the respective values at solution bulk, while the
phase shifts are reported with respect to the corresponding bulk values. The DC data
Figure 3
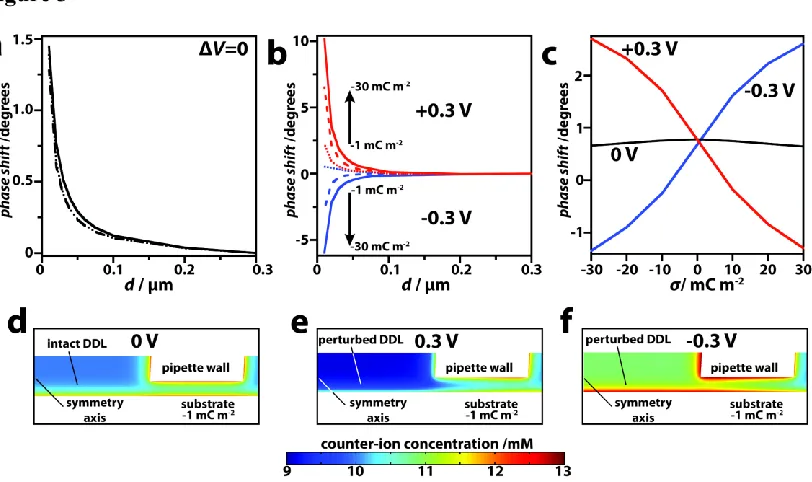
Figure 3. a) Simulated BM-SICM approach curves in the absence of mean bias offset
(V = 0) at 270 Hz, 10 mV rms amplitude bias modulation over a substrate carrying
surface charge densities, , of 0 (solid), -30 (dotted) and +30 (dashed) mC m-2. b) A
series of simulated approaches towards a negatively charged surface ( values -30
(solid), -10 (dashed) and -1 (dotted) mC m-2 with the arrows indicating an the increase
of the absolute magnitude of the surface charge density) at bias values of +0.3 V (red
lines) and -0.3 V (blue lines). c) Theoretically predicted values of the phase shift of
the ion current passing through a 75 nm radius nanopipette positioned at 25 nm from a
charged surface at 0 V, -0.3 V and +0.3 V bias (black, blue and red lines,
respectively). d-f) Calculated steady-state concentration profiles of DDL counter-ion,
for a DC bias only, near a nanopipette tip positioned 10 nm above a charged interface
( = -1 mC m-2) at d) 0 V, e) +0.3 V and f) -0.3 V bias. Note that only half of the
Figure 4
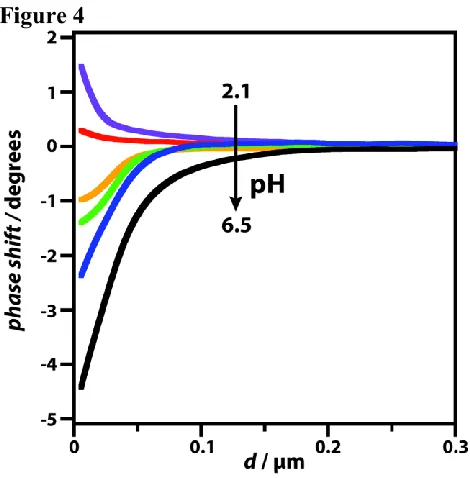
Figure 4. Experimental approach curves recorded with ca. 75 nm radius nanopipettes over a glass substrate at different solution pH (2.1, 2.5, 3.3, 3.7, 4.3 and 6.5 for
purple, red, orange, green, blue and black lines, respectively) performed with a bias,
V = -0.3 V applied to the nanopipette QRCE with respect to that in bulk solution.
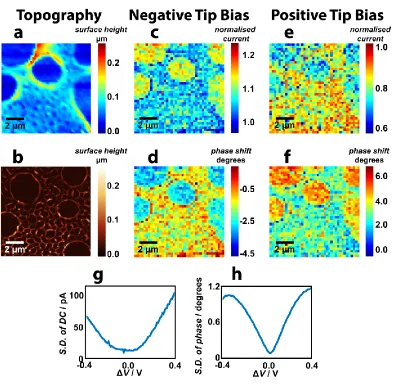
Figure 5
Figure 5. Simultaneous surface charge and topographical mapping over a
non-uniform polystyrene film on glass. a) Topography image recorded with a 75 nm
radius nanopipette operated in a hopping mode at 0 V bias offset and b) an AFM
image of a similar area of a substrate. c)-f) Example images of the normalized DC
component and AC phase shift (with the response in bulk subtracted) of the ion
current at -0.3 V and +0.3 V mean bias values. Standard deviation of g) ion currents
and h) bulk-corrected AC phase shift calculated across each image in a set of image
frames acquired at 81 equally spaced bias values over the linear regions scanned