Image Enhancement Using Particle Swarm
Optimization
Malik Braik, Alaa Sheta
∗and Aladdin Ayesh
†Abstract—Applications of the Particle Swarm Op-timization (PSO) to solve image processing problem with a reference to a new automatic enhancement technique based on real-coded particle swarms is pro-posed in this paper. The enhancement process is a non-linear optimization problem with several con-straints. The objective of the proposed PSO is to maximize an objective fitness criterion in order to en-hance the contrast and detail in an image by adapt-ing the parameters of a novel extension to a local enhancement technique. The feasibility of the pro-posed method is demonstrated and compared with Genetic Algorithms (GAs) based image enhancement technique. The obtained results indicate that the pro-posed PSO yields better results in terms of both the maximization of the number of pixels in the edges and the adopted objective evaluation. Computational time is also relatively small in the PSO case compared to the GA case.
Keywords: particle swarm optimization, genetic algo-rithms, image enhancement
1
Introduction
Particle Swarm Optimization (PSO) is one of the mod-ern heuristic algorithms that can be applied to non lin-ear and non continuous optimization problems. It is a population-based stochastic optimization technique for continuous nonlinear functions [1]. PSO was developed in 1995 by Dr. James Kennedy, a social psychologist, and Dr. Russell Eberhart, an electrical engineer [2]. PSO term refers to a relatively new family of algorithms that may be used to find optimal (or near optimal) solutions to numerical and qualitative problems. It is easily imple-mented in most programming languages and has proven both very effective and quick when applied to a diverse set of optimization problems [2, 3]. PSO was discovered through simulation of a simplified bird flocking model. Dr. Kennedy and Dr. Eberhart stated in [2] ”Particle swarm optimization has roots in two main component methodologies. Perhaps more obvious are its ties to ar-tificial life (A-life) in general, and to bird flocking, fish
∗Information Technology Department, Prince Abdullah Bin
Ghazi Faculty of Science and Information Technology,
Al-Balqa Applied University, Jordan, Email: [email protected],
†Computer Engineering Division, De Montfort University,
Le-icester, UK. Email: [email protected]
schooling, and swarming theory in particular. It is also related, however, to evolutionary computation, and has ties to both Genetic Algorithms (GAs) and Evolutionary Programming (EP).” Unlike GAs and EP, PSO is a sim-ple concept and is very easy to imsim-plement. The develop-ers of PSO stated in [2] ”Particle swarm optimization as developed by [Kennedy and Eberhart] comprises a very simple concept, and paradigms can be implemented in a few lines of computer code. It requires only primitive mathematical operators, and is computationally inexpen-sive in terms of both memory requirements and speed. Early testing has found the implementation to be effec-tive with several kinds of problems...Particle swarm op-timization has also been demonstrated to perform well on genetic algorithm test functions.” PSO shares many similarities with GAs.
Many authors explored the use of PSO to solve variety of
problems in computer science and engineering [4, ?, 5].
The use of PSO to solve various problems in pattern recognition and image processing was presented in [6]. In [8], author used PSO to estimate model parameters for software fault detection and diagnosis. Online training algorithm of a Generalized Neuron (GN) was developed using PSO in [9]. Particle swarm optimization for image registration was introduced in [10]. This is why it was quite challenging to adjust or tune the PSO parameters such that the required goals are achieved. An empirical study on the setting of control coefficients in PSO was presented in [11]. When should we use swarm to solve problems was explored in [12]. In this paper, a real-coded PSO is applied to adapt the gray-level intensity transfor-mation in the image. The fitness of each image is taken as a swarm particle and its subjective score is given by the human interpreter.
2
Local Enhancement Model
Local enhancement model apply transformation func-tions that are based on the gray-level distribution in the neighborhood of each pixel in the given image. In the traditional enhancement technique, the original equation shown in ”(1),” is applied to each pixel at location (i, j) using the following transformation [13]:
g(i, j) = [ M
σ(i, j)][f(i, j)−m(i, j)] (1)
The mean and standard deviation are computed in a
neighborhood centered at (i, j). Therefore, they are
de-pendent on the local information. f(i, j) andg(i, j) are the gray-level intensity of pixels in the input and
out-put image, respectively, centered at location (i, j). And
lastly, M is the global mean of the image.
3
Proposed Enhancement Model
There are two key steps when applying PSO to optimiza-tion problems:
1. The representation of the solution and
2. The fitness function.
The proposed enhancement model is derived from ”(1),”
and is applied to each pixel at location (i, j) using the
following transformation [14]:
g(i, j) = [K M
σ(i, j) +b][f(i, j)−c∗m(i, j)]+m(i, j) a (2)
a, b, c, andkare the parameters defined over the real pos-itive numbers and they are the same for the whole image. Comparing ”(1),” to ”(2),” the values of the parameters are taken as constants (i.e. b= 0, c= 1, k= 1,) and the termm(i, j)a is taken as 0. In ”(2),”b= 0” prohibits the
Not A Number (NAN) values,c= 1 allows for only a
frac-tion of the mean to be subtracted from the pixel’s input gray-level intensity value, while the last term may have brighten and smooth the effects on the image. Accord-ingly, the proposed equation broadened the spectrum of the transformation output range by modifying the origi-nal equation.
PSO task is to solve the image enhancement problem by tuning the four parameters in order to find the best com-bination according to an objective criterion that describes
the contrast in the image. The parameters a, b, c, and
k are represented as particles. Each particle represents
a candidate solution to solve the optimal enhancement problem. Therefore, the representation of the particle is a string of four real swarms denoting the forth dimension.
The proposed method using PSO has many advantages.
1. It uses a local enhancement technique based on the standard deviation and the mean value of the pixels.
2. It has no interaction with the humans.
3. It uses an objective fitness criterion that is propor-tional to the number of edges in the image and to a clumping factor of the intensity transformation curve.
3.1
Enhancement Criterion
One of the requirements of the PSO based image enhance-ment is to choose a criterion that is related to a fitness function. The proposed technique needs the enhanced image to have a relatively high intensity of the edges. Consequently, the fitness criterion is proportional to the number and intensities of the pixels in the edges that might give an over-sized credit to an image that doesn’t have a natural contrast.
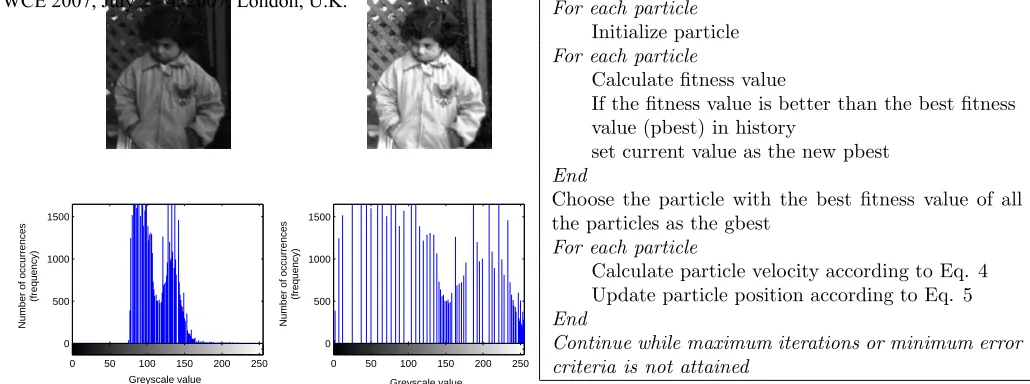
In fact, we need from the fitness criterion a histogram of the image that should approach the uniform distribution as shown in Figure 1 [13]. The fitness function shown in ”(3),” [14] is a good choice for an enhancement criterion:
F(Z) = log(log(E(I(Z))))∗n edgels(I(Z))
M∗N ∗H(I(Z))
(3)
F(Z) is the fitness function. I(Z) denotes the original
image I with the transformationT applied according to
”(1),”. The parameters a, b, c, and k are the respective
parameters given by the particle Z = (abck). E(I(Z))
is the intensity of the edges detected with a Sobel edge
detector that is applied to the transformed imageI(Z),
n edgels is the number of edgel pixels as detected with the Sobel edge detector. The Sobel detector used here is an automatic threshold detector [15]. M and N are the number of pixels in the horizontal and vertical direction of the image. E(I) is the sum of intensities of the edges
included in the enhanced image [16]. Lastly, H(I(z))
measures the entropy of the imageI(z).
The proposed PSO objective is to find the solution that
maximizesF(Z). To achieve these objectives we need to:
1. Increase the relative number of pixels in the edges of the image.
2. Increase the overall intensity of edges, and
3. Transform the histogram of the image to one that approximates a uniform distribution by maximizing the entropic measure [17].
4
PSO Algorithm
PSO is initialized with a group of random particles (solu-tions). The algorithm then searches for optima through a series of iterations. The particle’s fitness value is eval-uated on each iteration. If it is the best value the parti-cle has achieved, the partiparti-cle stores the location of that
value as pbest (particle best). The location of the best
fitness value achieved by any particle during any iteration
is stored asgbest(global best) [18, 19, 20]. Using pbest
0 50 100 150 200 250 0
500 1000 1500
Greyscale value
Number of occurrences
(frequency)
0 50 100 150 200 250
0 500 1000 1500
Greyscale value
Number of occurrences
(frequency)
Figure 1: Global Histogram Equalization, Upper left: Unequalized image, Upper right: Same image after his-togram equalization, Lower left: Unequalized hishis-togram, Lower right: Equalized global histogram.
and gbest, each particle moves with a certain velocity, calculated by Equations 4, 5, and 6 [2, 18].
Vi=wVi−1 + c1∗rand()∗(pbest−pL) + c2∗rand()∗(gbest−pL) (4)
pL=pvL+Vi (5)
w= 1
iterN um (6)
Vi is the current velocity, Vi−1 is the previous velocity,
pLis the present location of the particle,pvLis the
pre-vious location of the particle, rnd is a random number
between (0,1),c1 andc2 are learning factors or
stochas-tic factors, anditerN umis the current iteration number.
The pseudo code of the PSO procedure was presented in [2, 20] and is given in Figure 2.
5
Genetic Algorithms
At each generation, each individual is evaluated and re-combined with others on the basis of its fitness. The expected number of times an individual is selected for re-combination is proportional to its fitness relative to the rest of the population. New individuals are created using crossover and mutation.
• Crossover operates by selecting a random location
in the genetic string of the parents (crossover point) and concatenating the initial segment of one parent with the final segment of the second parent to cre-ate a new child. A second child is simultaneously generated using the remaining segments of the two parents.
For each particle
Initialize particle
For each particle
Calculate fitness value
If the fitness value is better than the best fitness value (pbest) in history
set current value as the new pbest
End
Choose the particle with the best fitness value of all the particles as the gbest
For each particle
Calculate particle velocity according to Eq. 4 Update particle position according to Eq. 5
End
[image:3.612.35.550.32.224.2]Continue while maximum iterations or minimum error criteria is not attained
Figure 2: The Pseudo code of the PSO procedure
• Mutation provides for occasional disturbances in the
crossover operation by inverting one or more genetic elements during reproduction [21, 22, 23].
The pseudo code of the standard GAs is as shown in Figure 3 [24, 23]:
Begin GA
g=0 generation counter Initialize population
Evaluate population P(g) i.e., compute fitness values
While not done do
g=g+1
Select P(g) from P(g-1) Crossover P(g)
Mutate P(g) Evaluate P(g)
End while End GA
Figure 3: The Pseudo code of the GAs procedure
6
PSO and GA Control Parameters
In the objective enhancement criterion we need to find the solution of the fitness functionF(z) wherea, b, c, and
kare set to be the swarms.
The following combinations of the control parameters are used for running PSO. The number of particles is 30. Di-mension of particles is four since the parameters need to be tuned are 4. Range of particles is the positive real numbers. The maximum change one particle can take during one iteration is 20. Learning factors or accelera-tion constants are equal to 1.3. The searching is a repeat
[image:3.612.74.285.338.414.2]process and the stop condition or the maximum num-ber of iterations the PSO executes is set to 200. Inertia weight is set at 0.6 and 0.9. Using the above control parameters, the PSO is executed and the results are ob-tained.
The following combinations of the control parameters are used for running GAs. The chromosome structure had four parameters to be estimated. The selection mech-anism of using GAs is binary tournament and K-elitism with K = 5. GAs was used with population size, crossover probability and mutation probability of 1000, 0.9, 0.03, respectively.
7
Comparison between GAs and PSO
Most of the evolutionary techniques have the following procedure:
1. Random generation of an initial population.
2. Reckoning of a fitness value for each subject.
3. Reproduction the population based on fitness values.
4. If the requirements are met, then stop. Otherwise go back to 2.
From the above procedure, we can learn that PSO shares many common points with GAs [1, 20]. Both GAs and PSO are initialized with a population of random solu-tions and search for the optimum by updating genera-tions. Both have fitness values to evaluate the population. However, the information sharing mechanism in PSO is significantly different [1, 20, 25].
• In GAs, each possible solution within the
popula-tion of a biological individual is coded in so called chromosome. Chromosomes share information with each other. Each chromosome is assigned a fitness score according to how good a solution to the prob-lem based on a given fitness function. The solutions are taken according to their fitness values and used to construct new solutions by a hope that the new solutions will be better than the old solutions and a generation is complete. Thus, the whole popula-tion moves like a one group towards an optimal area [23, 21, 24, 22].
• In PSO, the potential solutions, called particles, fly
through the problem space by following the current optimum particles. Only the particle with the best fitness value of all the particles gives out the informa-tion to others, so it is a one-way informainforma-tion sharing mechanism, where the evolution only looks for the best solution. Then, all the particles tend to con-verge to the best solution quickly even in the local version in most cases. In GAs, the new solutions are
created using two main evolution operators known as crossover and mutation. However, PSO does not have the evolution operators and particles update themselves with the internal velocity [20, 25].
8
Results and Discussion
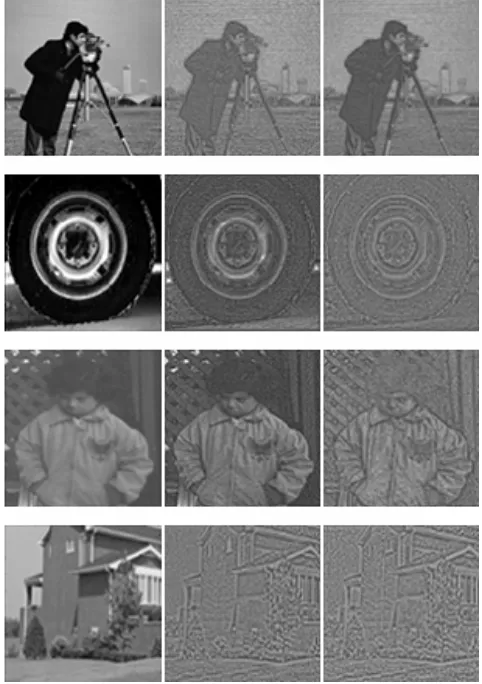
The optimization problem considered in this paper is to solve the enhancement problem using PSO. Our objec-tive is to maximize the number of pixels in the edges, increase the overall intensity of the edges, and increase the measure of the entropy. After that, the histogram of the enhanced image approaches the required uniform dis-tribution. In order to evaluate the PSO-based enhance-ment method, we compared the proposed method with GA-based enhancement method using four selected im-ages. They are the Cameraman, Tire, Pout and House. The size of each image is varying. For example, the Cam-eraman has a 256x256 pixels.
For each PSO or GA run we report three values:
• The performance of the algorithms by computing the
objective evaluation function in terms of the fitness value
• The computational time per run of each algorithm
• The efficiency in terms of the number of edgels which
gives an indication of the performance of the pro-posed algorithm.
The objective evaluation criterion in terms of fitness score is employed to rank the proposed method; the results are given in Table 1 for typical runs. It can be shown that the results obtained using PSO when compared with the results obtained using GA reveals the following fact:
• The fitness value using PSO is more when compared
with the fitness value using GAs for the same number of generations.
• The computational time for PSO based enhancement
was found 130.5 seconds whereas the time taken for GAs based enhancement was found 182.4 seconds.
• The computational time is less in case of PSO when
compared with that of GAs since PSO does not per-form the selection and crossover operations as in the GA case.
• The image that contains the highest number of edgel
pixels can be rated as having high detail contents as shown in Table 2.
It is clear from Table 2 that the PSO-based method achieves the best detail content in the enhanced images
Table 1: The fitness value of both PSO and GAs Using 200 Generations
Image/Fitness PSO-based GAs-based
Cameraman 128.821 102.988
Tire 136.398 130.030
Pout 10.450 2.972
House 250.345 240.342
Table 2: The number of edgels as detected with Sobel automatic edge detector
Image Original GA PSO
Cameraman 2485 2575 2674
Tire 1823 1917 2020
Pout 1492 2040 2048
when compared with the number of edgels in the en-hanced image using GAs and both are greater than the number of edgels in the original image. This ensures that the PSO method yields better quality of solution com-pared to GAs. Thus, the above facts reveal the superior properties of PSO when compared with GAs. So, the proposed PSO method yields high quality solutions with better computation efficiency. It can be shown from Fig-ure 4, that the brightness and contrast of the enhanced images using PSO and GAs appear visibly and is more than the brightness and contrast of the original images. Also, it can be shown clearly, that the brightness of the enhanced images using PSO is better than the brightness of the enhanced images using GAs. The convergence pro-cess of the 4 images is shown in Figure 5.
PSO has been successfully applied for image enhance-ment application and demonstrated that PSO gets bet-ter results in a fasbet-ter, cheaper way compared with GA evolutionary method. Also PSO is more attractive than GA is that there are few parameters to adjust compared with the large number of parameters adjusted when GA is run. All in all, these reported values and the results shown in Figure 4 give a good explanation of the superior of using PSO for image enhancement compared to GAs.
9
Conclusions and Future Work
In this paper, a new approach to automatic image en-hancement using real-coded PSO is implemented by spec-ifying a suitable fitness function proportional to the num-ber and intensity of the edgel pixels and to the entropic measure of the image. The objective of the algorithm was to maximize the total number of pixels in the edges thus being able to visualize more details in the images. The algorithm is tested on four selected images. The results obtained are tabulated and compared with the results
ob-Figure 4: Enhancement results: left-original image;
[image:5.612.62.279.68.132.2]middle-GA based method; right-PSO based method. For the images a) Cameraman b) Tire c) Pout d) House.
Figure 5: Convergence process of the tested
images-blue color, PSO-based method; green color, GA-based method; upper left-Cameraman; upper right-Tire; lower left-Pout; lower right-House.
[image:5.612.77.262.194.246.2] [image:5.612.310.546.456.643.2]tained using GAs. It is clear from the obtained results that the proposed PSO based image enhancement is bet-ter than the GAs based image enhancement in bet-terms of quality solution and computational efficiency. The pro-posed PSO based image enhancement method may be extended in several ways, such as: fine tuning of the PSO parameters in order to reduce the number of particles and reducing the maximum number of iterations. Another extension is to code local parameters of the method that applies to each neighborhood.
References
[1] J. Kennedy, R. C. Eberhart, and Y.Shi,Swarm
In-telligence. Morgan Kaufmann Publishers, San Fran-cisco, 2001.
[2] J. Kennedy and R. C. Eberhart, “Particle swarm
optimization,” Proceedings of IEEE International
Conference on Neural Networks (Perth, Australia), IEEE Service Center, Piscataway, NJ, vol. 5, no. 3, pp. 1942–1948, 1995.
[3] M. A. Talal and A. A. Mohamed, “Simulation-based optimization for repairable systems using particle swarm algorithm,” Proceedings of the 2005 Winter Simulation Conference, Department of Statistics and Operations Research Kuwait University, 2005.
[4] H. Sun, Y. Pan, and Y. Zhang, “Pso based gabor
wavelet feature extraction method,” in Proceedings
of the International Conference on Information Ac-quisition, 21-25 June 2004, pp. 422 – 425, 2005.
[5] J.-I. Lin and T.-Y. Cheng, “Dynamic clustering us-ing support vector learnus-ing with particle swarm
op-timization,” inProceedings of the 18th International
Conference on Systems Engineering, pp. 218–223, 2005.
[6] Y.-C. Chen, H.-C. Wang, and T.-J. Su, “Particle swarm optimization for image noise cancellation,” in
First International Conference on Innovative Com-puting, Information and Control - Volume I (ICI-CIC’06), pp. 587–590, 2006.
[7] M. G. H. Omran,PSO methods for pattern
recogni-tion and image processing. PhD thesis, University Pretoria, November, 2004.
[8] A. Sheta, “Reliability growth modeling for software fault detection using particle swarm optimization,” pp. 10428–10435, Proceedings of IEEE Congress on Evolutionary Computation (CEC 2006), Vancouver, BC, Canada, 2006.
[9] R. Kiran, S. R. Jetti, and G. K. Venayagamoorthy, “Online training of generalized neuron with particle swarm optimization,” pp. 10187–10194, Proceedings of IEEE Joint Conference on Neural Networks, Van-couver, BC, Canada, 2006.
[10] H. Talbi and M. Batouche, “Particle swarm
op-timization for image registration,” in Proceedings.
2004 International Conference on Information and Communication Technologies: From Theory to Ap-plications, 19-23 April 2004, pp. 397–398, 2004.
[11] N. M. Kwok, D. K. Liu, K. Tan, and Q. P. Ha, “An empirical study on the setting of control coefficient in particle swarm optimization,” pp. 3165–3172, Pro-ceedings of IEEE Congress on Evolutionary Compu-tation (CEC 2006), Vancouver, BC, Canada, 2006.
[12] T. J. Richer and T. M. Blackwell, “When is a swarm necessary?,” pp. 5618–5625, Proceedings of IEEE Congress on Evolutionary Computation (CEC 2006), Vancouver, BC, Canada, 2006.
[13] R. Gonzalez, R. Woods, and S. Eddins, Digital
Im-age Processing using matlab. Upper Saddle River, NJ Jensen: Prentice Hall,2nd Edition, 2004.
[14] C. Munteanu and A. Rosa, “Towards automatic
image enhancement using genetic algorithms,”
LaSEEB-ISR-Instituto Superior Tcnico, 2001.
[15] P. L. Rosin, “Edges: saliency measures and au-tomatic thresholding, machine vision and
applica-tions,”Springer Verlag, vol. 9, pp. 139–159, 1997.
[16] J. S. DaPonte and F. M. D., “Enhancement of chest
radiographs with gradient operators,”IEEE
Trans-actions on Medical Imaging, vol. 7, no. 2, pp. 109– 117, 1988.
[17] A. K. Jain,Fundamentals of Digital Image
Process-ing. Prentice Hall, 1991.
[18] Y. Zheng, L. Ma, L. Zhang, and J. Qian, “On the convergence analysis and parameter selection in par-ticle swarm optimization,” pp. 1802–1807, Proceed-ings of International Conference, Machine Learning and Cybernetics, 2003.
[19] K. Yasuda, A. Ide, and N. Iwasaki, “Adaptive par-ticle swarm optimization,” pp. 1554–1559, Proceed-ings of IEEE International Conference on Systems, Man and Cybernetics, 2003.
[20] Y. Zheng, L. Ma, L. Zhang, and J. Qian, “Empir-ical study of particle swarm optimizer with an in-creasing inertia weight,” pp. 221–226, Proceedings of IEEE Congress on Evolutionary Computation (CEC 2003), Canbella, Australia, 2003.
[21] J. Holland,Adaptation in Natural and Artificial
Sys-tems. PhD thesis, University of Michigan Press, Ann
Arbor, 1975.
[22] K. DeJong, An Analysis of Behavior of a Class
of Genetic Adaptive Systems, Doctoral dissertation. PhD thesis, University of Michigan, Dissertation Ab-stracts International, 1975.
[23] D. Goldberg, “The design of innovation: Lessons
from and for competent genetic algorithms,”
Addison-Wesley, Reading, MA, 2002.
[24] D. Goldberg, “Genetic algorithms in search,
opti-mization and machine learning,” Kluwer Academic
Publishers, Boston, MA, 1989.
[25] H. K. Dong, “Improvement of genetic algorithm us-ing PSO and euclidean data distance algorithm,”
International Journal of Information Technology, vol. 12, no. 3, 2006.