https://www.scirp.org/journal/ojop ISSN Online: 2325-7091
ISSN Print: 2325-7105
DOI: 10.4236/ojop.2019.83008 Sep. 9, 2019 83 Open Journal of Optimization
Optimization of Specific Draft Requirement and
Hitch Length for an Animal Drawn Sub-Soiler:
A Case of Sandy Clay Loam Soils
Nicodemus K. Mwonga
*, Ayub N. Gitau, Joackim M. Mutua, Simon T. Mwangi
Department of Environmental and Biosystems Engineering, University of Nairobi, Nairobi, Kenya
Abstract
This study aimed at optimizing tillage depth and hitching length for optimal draft requirement in sandy clay loam soils for animal drawn subsoiler. Field experiments were conducted to collect draft datasets using the MSI 7300 dig-ital dynamometer communicating remotely with MSI-8000 RF data logger connected to a laptop through the serial port. To determinethe numeric val-ues of soil parameters pertinent to subsoiling, field experiments, laboratory tests and numerical analysis techniques were employed. For a specified speed, a combination of three hitch lengths of 2.5 m, 3.0 m and 3.5 m and three depths from 0 cm to 30 cm with a range of 10 cm interval was used. Soil bulk density was found to vary between 1.52 to 1.37 g/cm3 and 1.44 to 1.67 g/cm3
for Machakos and Kitui experimental plots respectively. Soil moisture content increased with an increase in depth ranging from 3.53% to 9.94% for Macha-kos site and from 4.15% to 9.61% for Kitui site. Soil shear strength parameters ranged between 21.71 and 29.6 kPa between depths of 0 - 20 cm and de-creased to 28.07 kPa for depths beyond 20 cm at Machakos experimental plot; while for Kitui experimental plot, it ranged between 30.02 and 39.29 kPa be-tween depths of 0 - 30 cm. A second-order quadratic expression of the form y
= ax2 + bx + c was obtained for the relationship between specific draft and
depth at given hitching length as well as specific draft against hitching length
at a given depth. The optimal hitching length and tillage depth for Machakos experimental plot were obtained as 2.9 m (~3 m) and 16.5 cm respectively. In Kitui experimental site, the optimal hitching length was obtained as 2.9 m (~3 m) and the optimal tillage depth was 15.4 cm.
Keywords
Soil Resistance, Specific Draft, Hitching Length, Subsoiling Depth, Animal Power
How to cite this paper: Mwonga, N.K., Gitau, A.N., Mutua, J.M. and Mwangi, S.T. (2019) Optimization of Specific Draft Re-quirement and Hitch Length for an Ani-mal Drawn Sub-Soiler: A Case of Sandy Clay Loam Soils. Open Journal of Optimi-zation, 8, 83-99.
https://doi.org/10.4236/ojop.2019.83008
Received: June 28, 2019 Accepted: September 6, 2019 Published: September 9, 2019
Copyright © 2019 by author(s) and Scientific Research Publishing Inc. This work is licensed under the Creative Commons Attribution International License (CC BY 4.0).
http://creativecommons.org/licenses/by/4.0/
DOI: 10.4236/ojop.2019.83008 84 Open Journal of Optimization
1. Introduction
Kenya is a predominantly dry country with about 80% (467,200 km2) of the total
area falling under Arid and Semi-Arid Lands (ASAL). The rains are low and er-ratic and vary greatly both in space and time. Rainfall events are generally in-tense and can produce considerable runoff and soil erosion. Over the last dec-ades, there has been a general decline in cropped land productivity. Land degra-dation, which includes soil compaction, diminishing plant-available moisture and reduced soil fertility has been identified as factors behind this gradual de-cline in agricultural productivity, which has immensely contributed to food in-security in the county especially in the ASAL.
Intensive land preparation by animal or tractor drawn ploughs, hand hoe or and removing of crop residue by burning are the main causes of land degrada-tion because it leaves the soil exposed to hazardous climatic condidegrada-tions for in-stance sun, wind and rain [1]. It is important to examine land preparation prac-tices, which will improve soil and water conservation and systematically reverse land degradation trend for increased crop yields.
Agricultural mechanization is one of the major agricultural production inputs and a catalyst for rural development. Application of agricultural mechanization technology increases power to agriculture, largely therefore enhancing the productivity of human labor. Despite agricultural mechanization being vital for agricultural production, most farming communities lack appropriate machinery and equipment to undertake their operations efficiently and effectively. Cur-rently the use of motorized power stands at 30 percent; hand and animal draught power (ADP) at 20 percent and 50 percent respectively at the National level [2].
The relatively low level of mechanization is due to a number of challenges facing the subsector. These include: inadequate research and technology devel-opment, weak local manufacturing and distribution, and insufficient agricultural mechanization quality assurance, low level of investments in mechanization ser-vices, poor extension and technology adoption, weak institutional and legal framework. The cross-cutting issues affecting agricultural mechanization include matters related to vulnerable groups, gender and youth, negative effects of the environment, inappropriate land use and climate change.
In Kenya, a larger population resides in the rural areas, mainly in ASAL and depends on Agriculture for their livelihood. These Communities have been us-ing Animal Draught Power (ADP) for cultivation and transportation for ages. Although there has been a significant improvement in achieving large ploughed areas, the yields have been low owing to the use of inappropriate tools that have not mobilized the soil effectively [3].
DOI: 10.4236/ojop.2019.83008 85 Open Journal of Optimization
Tillage tool geometry has received immense emphasis in the past years; this is considering that an ideal tool should perform satisfactorily over a wide range of initial soil conditions and tillage depths [4]. Considering the importance of sub-soiling in view of its environmental effect on reducing soil compaction, en-hancing water storage and reducing soil and water erosion and seemingly de-clining availability of draft animal power, it is imperative to evaluate the perfor-mance of an animal drawn sub-soiler at different hitch length and depths of til-lage.
Although agricultural mechanization has increased at a rate of 1.0% to 1.5% per year in the developing countries such as Kenya, draft animals still remain a major source of farm power providing nearly 50% of the agricultural power [7]. Animals utilized as a source of traction, include oxen and donkeys in the study area while in other parts of the world horses, mules, buffalo and cattle are used. In addition to utilization as a source of power, these same animals provide fuel, wool, hair, offspring and by-products, such as hides, horns, hooves and meat at the end of their working lives. The extent to which draft animals are employed in tillage might lead one to expect considerable information on guidelines for utili-zation, but this is not the case, particularly for sub-soiling which is a more recent conservation tillage technology that has not been fully explored especially in the ASAL.
Conventional tillage using oxen or tractor drawn ploughs has been perceived as the indicator of farm systems modernization in developing countries over years [8]. This has not worked well in tropics where the temperatures are high, the rainfalls are erratic and very intensive and the soils are prone to erosion. Minimum and Conservation tillage coupled with the use of appropriate tools and equipment offers a window of opportunity to convert degraded soils into productive soils and thereby improves crop yields, reduces land degradation ul-timately addressing environmental conservation concerns [9] [10].
Numerous studies have concentrated on effect of depth, rake angles and speed on draft requirement while limited studies have been done on the effect of hitch length and tillage depth on draft requirement for an animal drawn equipment. This study evaluated the effect of varying the tillage depth and draft hitch length on draft power requirement for draft animals in the lower Eastern part of Kenya particularly in Kitui and upper parts of Machakos counties.
2. Materials and Methods
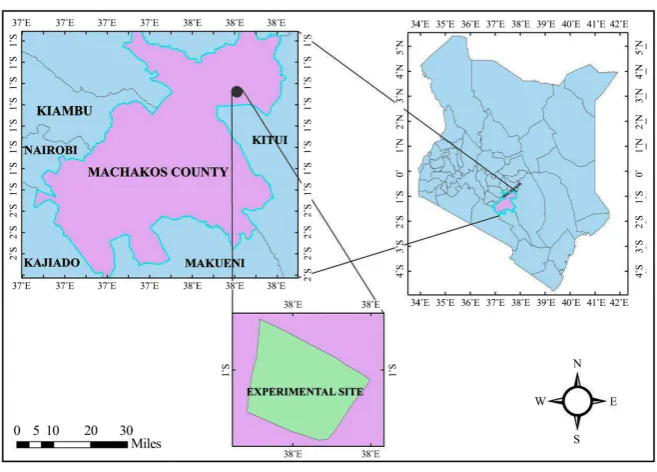
2.1. Experimental Site
The study was conducted in Machakos and Kitui Counties on experimental fields shown in Figure 1 and Figure 2 respectively.
2.2. Data Collection Approach
2.2.1. Experimental Set-Up and Methodology
DOI: 10.4236/ojop.2019.83008 86 Open Journal of Optimization
[image:4.595.209.538.141.377.2]the MSI 7300 digital dynamometer attached between the equipment and the bullocks as shown in Figure 3 using hitches and steel shackles. The dynamome-ter remotely was communicating with a data logger MSI 8000 RF connected to the computer capturing the draft power instantaneously.
Figure 1. Machakos experimental plot.
[image:4.595.206.539.163.567.2]Figure 2. Kitui county experimental plot.
Figure 3. The experimental set-up. Towed
Equipment
Digital Dynamometer
[image:4.595.209.539.384.666.2]DOI: 10.4236/ojop.2019.83008 87 Open Journal of Optimization
The sub-soiler was attached to the frame as shown in Figure 4.
At the start of the experiments, a run of the system described in Figure 3 was done with the tillage tine disengaged to establish the rolling resistance of the towed equipment. Draft for each hitch length and depth of sub-soiling combi-nation was determined by subtracting rolling resistance from the draft ob-tained when the tool is engaged. A sample of the data obob-tained is represented in Table 1.
2.2.2. Experimental Design and Treatments
The parameters investigated for the draft measurement included width and depth of tillage. For a specified speed, three hitch lengths of 2.5 m, 3.0 m and 3.5 m for each depth and three depths from 0 cm to 30 cm with a range of 10 cm were used in combination. For each set up, three replications were performed giving a total of 27 treatments.
2.2.3. Soil Characterization
[image:5.595.245.500.411.544.2]The soil physical and mechanical properties (soil moisture, texture, structure, bulk density, shear stress and penetration resistance) were determined during the study. Soil samples were collected randomly to depths of 30 cm with each test plot having at least three soil samples. The soil samples were collected using sealed plastic containers clearly labelled with reference numbers indicating the plot and the depth from which the sample was collected.
Figure 4. Subsoiler attachment [11].
Table 1. Sample Draft data (kN) from the dynamometer.
Hitching length = 2.5 m
Plot 1 Plot 1 Plot 1 Plot 2 Plot 2 Plot 2 Plot 3 Plot 3 Plot 3
1.22 1.32 1.80 1.48 1.04 1.78 0.66 1.46 1.14
1.12 1.36 1.74 1.50 1.18 1.84 0.98 1.48 1.36
1.10 1.48 1.78 1.44 1.26 1.78 1.06 1.58 1.40
1.06 1.52 1.92 1.46 1.16 1.90 1.04 1.54 1.72
[image:5.595.207.541.594.727.2]DOI: 10.4236/ojop.2019.83008 88 Open Journal of Optimization 2.2.4. Statistical Analysis
Outliers were eliminated from the draft dataset obtained from the field tests using the interquartile range. The datasets were compared using statistical meas-ures of fit particularly the coefficient of determination (R2) and the student t-test.
The coefficient of determination, R2 was computed using Equation (1)
2 SSR sum of squares explained by regression
SST Total sum of squares
R = = (1)
where
2
ˆ
SSR=
∑
y−y (2)[
]
2SST=
∑
y−y (3)Effects of hitching length on draft power and effect of depth on draft require-ment was assessed by ANOVA using the linear mixed model [12]. The protected SED mean separation procedure at P ≤ 0.05 was used to compare treatment means [13].
3. Results and Discussion
3.1. Soil Characteristics
3.1.1. Shear Strength
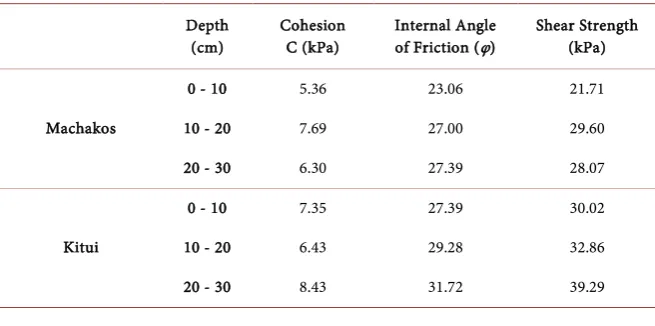
[image:6.595.210.538.569.732.2]Soil shear strength, Cohesion and angle of internal friction are represented in
Table 2.
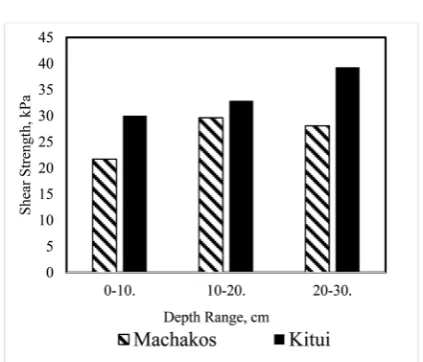
There is a general increase in soil shear strength with increase in depth. At Experimental site in Machakos, the shear strength increases from 21.71 to 29.6 kPa from depth of 0 - 20 cm and then decreases to 28.07 kPa between 20 - 30 cm indicating the presence of a hard pan between depth of 10 - 20 cm and the soil starts to loosen below 20 cm.
In Kitui experimental site, the shear strength increased from a low of 30.02 kPa at depths of 0 - 10 cm to a high of 39.29 kPa at depths of 20 - 30 cm (Figure 5). This was indicative of less compacted soils at the surface and presence of hardpan as the depth increases.
Table 2. Soil shear strength for the experimental sites.
Depth
(cm) Cohesion C (kPa) Internal Angle of Friction (φ) Shear Strength (kPa)
0 - 10 5.36 23.06 21.71
Machakos 10 - 20 7.69 27.00 29.60
20 - 30 6.30 27.39 28.07
0 - 10 7.35 27.39 30.02
Kitui 10 - 20 6.43 29.28 32.86
DOI: 10.4236/ojop.2019.83008 89 Open Journal of Optimization Figure 5. Soil shear strength for experimental sites.
3.1.2. Bulk Density
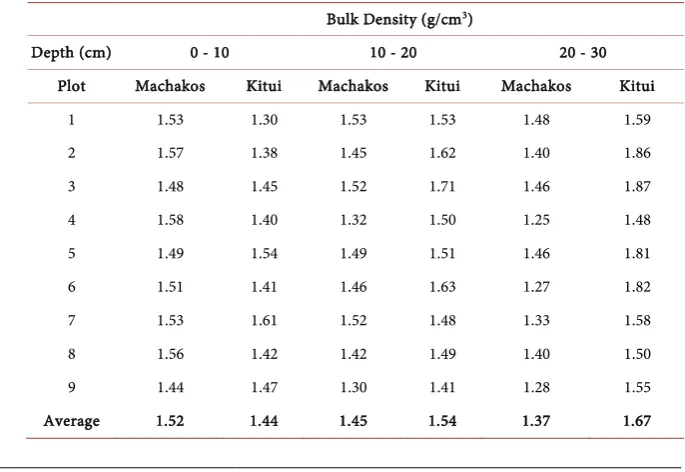
Bulk density was computed as a ratio of oven dry weight of bulk sample to the total volume of the soil core ring. For the two experimental sites, bulk density values were determined for each range of 10 cm depth from 0 - 30 cm and the results are shown in Table 3.
The average bulk densities for experimental plot in Machakos decreased with increase in depth from a value of 1.52 to 1.37 g/cm3. However, the values for
bulk densities for the experimental plot in Kitui increased with increasing depth from a value of 1.44 to a value of 1.67 g/cm3 (Figure 6). The results are an
indica-tion of soil compacindica-tion/crusting on the surface for Machakos experimental field; however, these values of bulk densities are below 1.6 g/cm3 beyond which there
can be inhibited root growth in soil. In Kitui experimental site the compaction is below the soil surface as indicated by increasing bulk density upto 1.67 g/cm3 at
the depth range of 20 - 30 cm. which still is within the range of 1.6 g/cm3 beyond
which there could be restricted root growth. Twum reported that soil bulk den-sity is significantly influenced by soil compaction [14]. They also indicated that the bulk density of compacted soils tended to decrease with increasing depth. The dry bulk density for this soil is within the normal range of bulk densities for clay soils, which is 1.0 to 1.6 g/cm3[15]. The values for the dry bulk densities for
the two experimental sites can effectively allow plant root development.
3.1.3. Penetration Resistance
DOI: 10.4236/ojop.2019.83008 90 Open Journal of Optimization Figure 6. Soil bulk density for Experimental Sites.
Figure 7. Soil penetration resistance for Experimental Sites.
Table 3. Bulk density results for the experimental sites.
Bulk Density (g/cm3)
Depth (cm) 0 - 10 10 - 20 20 - 30
Plot Machakos Kitui Machakos Kitui Machakos Kitui
1 1.53 1.30 1.53 1.53 1.48 1.59
2 1.57 1.38 1.45 1.62 1.40 1.86
3 1.48 1.45 1.52 1.71 1.46 1.87
4 1.58 1.40 1.32 1.50 1.25 1.48
5 1.49 1.54 1.49 1.51 1.46 1.81
6 1.51 1.41 1.46 1.63 1.27 1.82
7 1.53 1.61 1.52 1.48 1.33 1.58
8 1.56 1.42 1.42 1.49 1.40 1.50
9 1.44 1.47 1.30 1.41 1.28 1.55
Average 1.52 1.44 1.45 1.54 1.37 1.67
-0.2 0.4 0.6 0.8 1.0 1.2 1.4 1.6 1.8
0-10 10-20. 20-30
Bu
lk
D
en
sit
y,
g/
cm
3
Depth Range, cm Machakos Kitui
5.1 5.2 5.3 5.4 5.5 5.6 5.7 5.8
0-10 10-20. 20-30
Pe
ne
tr
at
io
n r
es
ist
an
ce
,M
Pa
Depth Range, cm
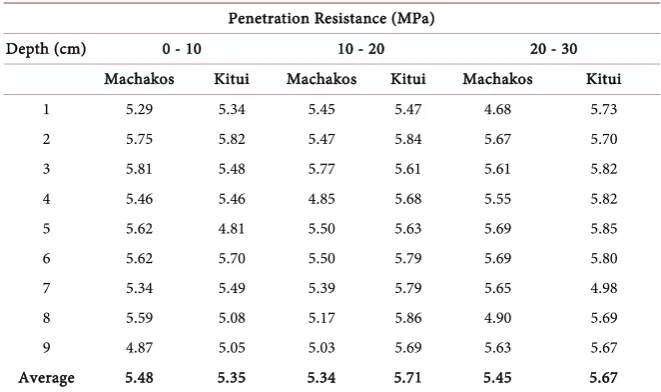
[image:8.595.196.539.504.740.2]DOI: 10.4236/ojop.2019.83008 91 Open Journal of Optimization Table 4. Penetration resistance data for the experimental sites.
Penetration Resistance (MPa)
Depth (cm) 0 - 10 10 - 20 20 - 30
Machakos Kitui Machakos Kitui Machakos Kitui
1 5.29 5.34 5.45 5.47 4.68 5.73
2 5.75 5.82 5.47 5.84 5.67 5.70
3 5.81 5.48 5.77 5.61 5.61 5.82
4 5.46 5.46 4.85 5.68 5.55 5.82
5 5.62 4.81 5.50 5.63 5.69 5.85
6 5.62 5.70 5.50 5.79 5.69 5.80
7 5.34 5.49 5.39 5.79 5.65 4.98
8 5.59 5.08 5.17 5.86 4.90 5.69
9 4.87 5.05 5.03 5.69 5.63 5.67
Average 5.48 5.35 5.34 5.71 5.45 5.67
Several researchers have reported an increase in penetration resistance with
tillage depth under different tillage implements [16] [17]. However, [18] [19]
reported that for penetration resistance beyond 3 MPa, plant root growth is con-sidered slow. It is therefore evident that for both Machakos and Kitui experi-mental sites, the penetration resistance values are beyond this limit for the stu-died depth of 0 - 30 cm and therefore at the two experimental sites it is recom-mended that ploughing could be done after the rains when the ground is wet and the hard pan is softened. Further ripping is recommended using specialized til-lage implements like chisel ploughs to break the plough pan.
3.1.4. Moisture Content
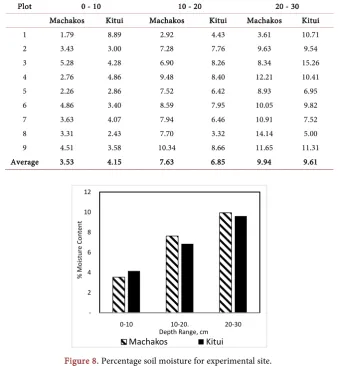
Percentage moisture content increased with an increase in depth between the ranges 0 - 30 cm. for Kitui and Machakos experimental fields (Table 5).
For Machakos experimental site, the moisture content increased from 3.53% at a depth of 0 - 10 cm, to 7.63% at a depth of 10 - 20 cm and to 9.94% at depths of 20 - 30 cm. On the other hand, the moisture content increased from 4.15% at a depth of 0 - 10 cm, to 6.85% at a depth of 10 - 20 cm and to 9.61% at depths of 20 - 30 cm for Kitui experimental site (Figure 8). This was indicative of loose soil and existence of more voids at the depths of 20 - 30 cm at the two experi-mental sites.
According to [20] soil columns tend to be drier at the top due to evaporation from the surface.
3.1.5. Effect of Depth on Specific Draft
DOI: 10.4236/ojop.2019.83008 92 Open Journal of Optimization
[image:10.595.204.543.134.501.2]lengths less than 2.5 m will have limited the penetration of the implement and defeat the purpose of the experiment.
Table 5. Moisture data for the experimental sites.
Plot 0 - 10 10 - 20 20 - 30
Machakos Kitui Machakos Kitui Machakos Kitui
1 1.79 8.89 2.92 4.43 3.61 10.71
2 3.43 3.00 7.28 7.76 9.63 9.54
3 5.28 4.28 6.90 8.26 8.34 15.26
4 2.76 4.86 9.48 8.40 12.21 10.41
5 2.26 2.86 7.52 6.42 8.93 6.95
6 4.86 3.40 8.59 7.95 10.05 9.82
7 3.63 4.07 7.94 6.46 10.91 7.52
8 3.31 2.43 7.70 3.32 14.14 5.00
9 4.51 3.58 10.34 8.66 11.65 11.31
[image:10.595.275.473.517.693.2]Average 3.53 4.15 7.63 6.85 9.94 9.61
Figure 8. Percentage soil moisture for experimental site.
Figure 9. Specific draft against tillage depth at different
hitching length for Machakos experimental site.
-2 4 6 8 10 12
0-10 10-20. 20-30
% Mo
istu
re
C
on
te
nt
Depth Range, cm
Machakos Kitui
y = 0.015x2- 0.514x + 8.741
R² = 1
y = 0.012x2- 0.395x + 7.267
R² = 1
y = 0.026x2- 0.852x + 11.64
R² = 1
3.0 4.0 5.0 6.0 7.0 8.0 9.0
2.5 5 7.5 10 12.5 15 17.5 20 22.5 25 27.5
Sp
ecif
ic Dr
af
t
(x
1
0
-3k
N/cm
2)
Tillage depth, cm
DOI: 10.4236/ojop.2019.83008 93 Open Journal of Optimization Figure 10. Specific draft against tillage depth at different
hitching length for Kitui experimental site.
The results at Machakos experimental field indicated that the relationship between specific draft and tillage depth at different hitching length is a second-order quadratic equation of the form; y = ax2 − bx + c with the
coeffi-cient of determination (R2) of 1.
where,
y = specific draft, kN/cm2 a & b = scalar quantities
x = tillage depth c = y-intercept
The optimum tillage depth is given as x when the gradient of the curve y = ax2
− bx + c is zero.
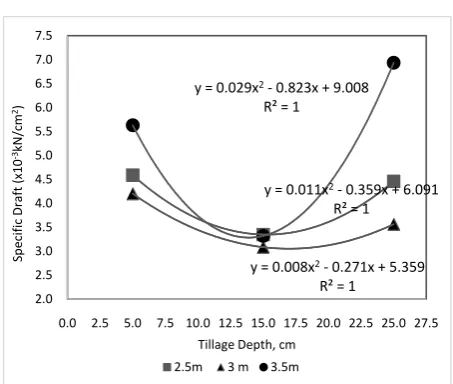
Similarly, for Kitui Experimental site.
The results at Kitui experimental field indicated that the relationship between specific draft and tillage depth at different hitching length is a second-order qu-adratic equation of the form; y = ax2 − bx + c with the coefficient of
determina-tion (R2) of 1.
The optimum tillage depth is given as x when the gradient of the curve y = ax2
− bx + c is zero.
The values of optimum tillage depth and optimal energy requirement for a given hitching length are given in Table 6.
3.1.6. Effects of Hitching Length on Draft
Figure 11 and Figure 12 represent the relationship between specific draft and
hitching length at given tillage depths for Machakos and Kitui experimental sites respectively.
The results at Kitui experimental field indicated that the relationship between specific draft and tillage depth at different hitching length is a second-order qu-adratic equation of the form; y = ax2 − bx + c with the coefficient of
determina-tion (R2) of 1.
y = 0.011x2- 0.359x + 6.091
R² = 1
y = 0.008x2- 0.271x + 5.359
R² = 1
y = 0.029x2- 0.823x + 9.008
R² = 1
2.0 2.5 3.0 3.5 4.0 4.5 5.0 5.5 6.0 6.5 7.0 7.5
0.0 2.5 5.0 7.5 10.0 12.5 15.0 17.5 20.0 22.5 25.0 27.5
Sp
ec
ifi
c
Dr
aft (
x1
0
-3kN
/c
m
2)
DOI: 10.4236/ojop.2019.83008 94 Open Journal of Optimization Figure 11. Specific draft against hitching length at different
[image:12.595.262.485.286.451.2]tillage depth for Machakos experimental site.
Figure 12. Specific draft against hitching length at different
tillage depth for Kitui experimental site.
Table 6. Summary of optimum tillage depth and specific draft requirement at given
hitching length.
Hitching Length 2.5 m 3.0 m 3.5 m
Machakos Kitui Machakos Kitui Machakos Kitui
Optimum Depth
(cm) 17.13 15.22 16.1 16.97 16.14 13.91
Optimum Specific
Draft (kN/m2) 43.4 33.6 40.8 30.6 47.7 32.8
The optimum tillage depth is given as x; when the gradient of the curve y = ax2
− bx + c is zero.
Similarly, for Kitui Experimental field.
It indicated that the relationship between specific draft and hitching length at different tillage depth is a second-order quadratic equation with the coefficient of determination (R2) of 1. The optimum hitching length is given as x; when the
y = 6.794x2- 39.27x + 62.25
R² = 1
y = 2.032x2- 11.79x + 21.17
R² = 1 y = 4.002x2- 22.41x + 36.26
R² = 1
3.5 4.0 4.5 5.0 5.5 6.0 6.5 7.0 7.5 8.0 8.5
2.4 2.6 2.8 3.0 3.2 3.4 3.6
Sp ec ifi c Dr aft ( x1 0 -3kN /c m 2)
Hitching Length, m 0-10 cm 10-20 cm 20-30 cm
y = 3.631x2- 20.74x + 33.75
R² = 1
y = 1.000x2- 6.029x + 12.17
R² = 1 y = 8.534x2- 48.72x + 72.94
R² = 1
2.0 2.5 3.0 3.5 4.0 4.5 5.0 5.5 6.0 6.5 7.0 7.5
2.0 2.5 3.0 3.5 4.0
Sp ec ifi c Dr aft ( x10 -3kN /c m 2)
hitching length, m
[image:12.595.208.539.529.622.2]DOI: 10.4236/ojop.2019.83008 95 Open Journal of Optimization
gradient of the equation/curve = ax2 − bx + c is zero.
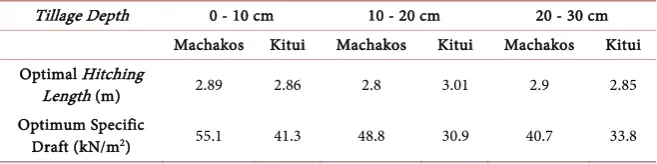
Value of optimum hitching length and optimal energy requirement for a given
tillage depth is given in Table 7.
According to [21] well-conditioned oxen are capable of working draft loads measured as tension (kg-force, kN) equal to 10% - 12% of their body weight throughout the day and greater loads for short periods of time. Therefore, two oxen of average weight 250 kg each (1 Tropical Livestock Unit) can generate a draft force of 500 - 600 N for normal pull or towing. At the experimental sites the bulls used weighed on average 250 - 300 kg each and this produced an aver-age specific draft of 28 kN/m2 - 40.7 kN/m2.
[image:13.595.210.539.328.410.2]Average specific draft at different tillage depths and hitching length were sub-jected to Analysis of Variance (ANOVA). Table 8 and Table 9 for Machakos and Kitui experimental sites respectively at 95% confidence level (P > 0.05). The following hypotheses were tested.
Table 7. Summary of optimum hitching length and specific draft requirement at given
tillage depth.
Tillage Depth 0 - 10 cm 10 - 20 cm 20 - 30 cm
Machakos Kitui Machakos Kitui Machakos Kitui
Optimal Hitching
Length (m) 2.89 2.86 2.8 3.01 2.9 2.85
Optimum Specific
Draft (kN/m2) 55.1 41.3 48.8 30.9 40.7 33.8
Table 8. Machakos experimental site specific draft summary.
Analysis
Machakos ANOVA
SUMMARY Count Sum Average Variance
0 - 10 cm 3 20.18402 6.728008 1.522888
10 - 20 cm 3 13.29262 4.430872 0.127045
20 - 30 cm 3 17.13099 5.710329 0.974999
2.5 m 3 16.18619 5.395396 1.170132
3 m 3 14.73088 4.910293 0.578375
3.5 m 3 19.69056 6.56352 2.684681
ANOVA Source of
Variation SS df MS F P-value F crit
Tillage Depth 7.949513 2 3.974756 17.34065 0.010693 6.944272 Hitching Length 4.332998 2 2.166499 9.451775 0.030501 6.944272
Error 0.916864 4 0.229216
Total 13.19937 8
Remarks
Ho: μ0-10 = μ10-20 = μ20-30 H1: μ0-10 ≠ μ10-20 ≠ μ20-30
[image:13.595.205.540.440.743.2]DOI: 10.4236/ojop.2019.83008 96 Open Journal of Optimization Table 9. Kitui experimental site specific draft summary.
Analysis
Kitui ANOVA
SUMMARY Count Sum Average Variance
0 - 10 cm 3 14.42157 4.807189 0.545998
10 - 20 cm 3 9.753063 3.251021 0.021041
20 - 30 cm 3 14.96017 4.986722 3.05001
2.5m 3 12.39738 4.132461 0.465047
3 m 3 10.85067 3.616889 0.314354
3.5m 3 15.88675 5.295582 3.352586
ANOVA
Source of Variation SS df MS F P-value F crit
Tillage Depth 5.466549 2 2.733275 3.908274 0.1145879 6.944272 Hitching Length 4.436674 2 2.218337 3.171971 0.1495367 6.944272
Error 2.797424 4 0.699356
Total 12.70065 8
Remarks
Ho: μ0-10 = μ10-20 = μ20-30 H1: μ0-10 ≠ μ10-20 ≠ μ20-30
Ho: μ2.5 = μ3 = μ3.2 H1: μ2.5 ≠ μ3 ≠ μ3.5
For tillage depth: Ho: μ0-10 = μ10-20 = μ20-30
H1: μ0-10 ≠ μ10-20 ≠ μ20-30
For hitching length: Ho: μ2.5 = μ3 = μ3.5
H1: μ2.5 ≠ μ3 ≠ μ3.5
In Table 8, the specific draft results for Machakos Experimental have signifi-cant difference across the different tillage depth as well as for different hitching lengths. The P-values obtained through ANOVA analysis are 0.010693 and 0.030501 for tillage depth and hitching length respectively, which are less than 0.05. The conclusion made therefore is that specific draft varies significantly with changing tillage depth and hitching length for Machakos experimental site.
However, a different scenario was reported for Kitui experimental site. No statistically significant difference was reported for specific draft at different til-lage depths and hitching lengths. The P values obtained were 0.1145879 and 0.1495367 for tillage depth and hitching length respectively Table 9. These val-ues are greater than 0.05 and therefore specific draft does not vary significantly with changing tillage depth and hitching length for Kitui experimental site.
4. Conclusions
The two sites Machakos and Kitui were found to have similar soils types, i.e.
le-DOI: 10.4236/ojop.2019.83008 97 Open Journal of Optimization
vels was notable. This is well-collaborated by the determined values of the bulk density, penetration resistance and shear strength at the two sites.
At the two experimental sites it was notable that beyond the depths of 20 - 30 cm the soil was loosening, hence the existence of more voids which has been collaborated by high Percentage (%) of moisture content. Consequently, to allow effective root development there is a need to rip or carry out sub soiling with deep penetration tillage implements to break the hardpan. Further farmers in those sites are advised to plough after the rains when the ground is wet enough to allow implement penetration.
The study established that the relationship between the specific draft, tillage depth and hitch length was a second-order quadratic equation of the form y =
ax2 − bx + c with the coefficient of determination (R2) of 1 at the Machakos and
Kitui experimental sites. where;
y = Specific draft, kN/cm2 a & b = scalar quantities
x = tillage depth c = y-intercept
After optimization of the above model, it was found that the optimum average
tillage depth was 16 cm, at the optimum hitch length of 3 m when an average specific draft of 41 kN/m2 was applied at normal oxen operating rate in a sandy
clay loam soils using an animal drawn sub-soiler. Analysis of variance (ANOVA) was carried for the results of Specific draft hitch length and tillage depth for the two experimental sites. The analysis established that specific draft varies signifi-cantly with changing tillage depth and hitching length for Machakos experi-mental site while for Kitui there was no significant difference and this is attri-buted to the shear strength characteristics.
Based on this study is can be concluded that the optimum hitching length
when using oxen drawn tillage implements is 3.0 m which can give an optimum furrow depth of 16 cm. This depth is sufficient enough to allow root growth for most of the crops grown in the ASAL regions.
Acknowledgements
The authors are grateful to the Department of Environmental and Biosystems Engineering, University of Nairobi, for availing research facilities and supportive staff members.
Conflicts of Interest
The authors declare no conflicts of interest regarding the publication of this pa-per.
References
Small-DOI: 10.4236/ojop.2019.83008 98 Open Journal of Optimization
holder Adoption and Implications for Climate Change Adaptation and Mitigation. Mitigation of Climate Change in Agriculture Working Paper, 1-37.
[2] Kienzle, J. and Sims, B.G. (2014) Agricultural Mechanization Strategies for Sustain-able Production Intensification: Concepts and Cases from (and for) Sub-Saharan Africa. FAO, Rome.
[3] Guthiga, P.M., Karugia, J.T. and Nyikal, R.A. (2007) Does Use of Draft Animal
Power Increase Economic Efficiency of Smallholder Farms in Kenya? Renewable
Agriculture and Food Systems, 22, 290-296.
https://doi.org/10.1017/S174217050700186X
[4] Phillips, I.D., Fielke, S.L., Young, I.R. and McMillen, I.C. (1996) The Relative Roles of the Hypothalamus and Cortisol in the Control of Prolactin Gene Expression in the Anterior Pituitary of the Sheep Fetus. Journal of Neuroendocrinology, 8, 929-933.
https://doi.org/10.1111/j.1365-2826.1996.tb00823.x
[5] Anon, (1992) Tools for Agriculture. Intermediate Technology Publications Ltd., London, 238 p.
[6] Brassington, T.J.M. (1987) Re-Examination of the Plough. Agricultural Engineer, 5, 53-57.
[7] Gitau, A.N. (1995) Tillage Practices and Draft Power Requirements for Soil Mois-ture Conservation of a Hard Setting Soil. Masters Dissertation, University of Nairo-bi, Nairobi.
[8] Johansen, C., Haque, M.E., Bell, R.W., Thierfelder, C. and Esdaile, R.J. (2012) servation Agriculture for Smallholder Rainfed Farming: Opportunities and Con-straints of New Mechanized Seeding Systems. Field Crops Research, 132, 18-32.
https://doi.org/10.1016/j.fcr.2011.11.026
[9] Rusinamhodzi, L., Corbeels, M., Van Wijk, M.T., Rufino, M.C., Nyamangara, J. and Giller, K.E. (2011) A Meta-Analysis of Long-Term Effects of Conservation
Agricul-ture on Maize Grain Yield under Rain-Fed Conditions. Agronomy for Sustainable
Development, 31, 657.https://doi.org/10.1007/s13593-011-0040-2
[10] Giller, K.E., Witter, E., Corbeels, M. and Tittonell, P. (2009) Conservation Agricul-ture and Smallholder Farming in Africa: The Heretics’ View. Field Crops Research, 114, 23-24. https://doi.org/10.1016/j.fcr.2009.06.017
[11] Starkey, P. and Kaumbutho, P. (1999) Meeting the Challenges of Animal Traction: A Resource Book of the Animal Traction Network for Eastern and Southern Africa (ATNESA). Intermediate Technology Publications, London, 326 p.
https://doi.org/10.3362/9781780445458
[12] Chartier, S. and Cousineau, D. (2011) Computing Mixed-Design (Split-Plot) ANOVA.
MathematicaJournal, 13, 13-17.https://doi.org/10.3888/tmj.13-17
[13] Saville, D.J. and Rowarth, J.S. (2008) Statistical Measures, Hypotheses, and Tests in Applied Research. Journal of Natural Resources & Life Sciences Education, 37, 74-82.
[14] Twum, E.K. and Nii-Annang, S. (2015) Impact of Soil Compaction on Bulk Density and Root Biomass of Quercus Petraea L. at Reclaimed Post-Lignite Mining Site in Lusatia, Germany. Applied and Environmental Soil Science, 2015, Article ID: 504603. https://doi.org/10.1155/2015/504603
DOI: 10.4236/ojop.2019.83008 99 Open Journal of Optimization
[16] Boydaş, M.G. and Turgut, N. (2007) Effect of Tillage Implements and Operating Speeds on Soil Physical Properties and Wheat Emergence. Turkish Journal of Agri-culture and Forestry, 31, 399-412.
[17] Mwangi, S.T., Gitau, A.N. and Muchiri, G. (2018) Effect of Chisel Ploughing on Physical and Mechanical Soil Properties on a Maize Cropped Field. International Journal of Emerging Technology and Advanced Engineering, 8, 84-93.
[18] Bengough, A.G. and Mullins, C.E. (1990) Mechanical Impedance to Root Growth: A
Review of Experimental Techniques and Root Growth Responses. Journal of Soil
Science, 41, 341-358.https://doi.org/10.1111/j.1365-2389.1990.tb00070.x
[19] Vepraskas, M.J. (1994) Plant Response Mechanisms to Soil Compaction. In:
Wil-kerson, R.E., Plant Environment Interactions, M. Dekker, New York, 263-287. [20] Gong, Y. Cao, Q. and Sun, Z. (2003) The Effects of Soil Bulk Density, Clay Content
and Temperatute on Soil Water Content Measurement Using Time-Domain Ref-lectometry. Hydrological Processes, 17, 3601-3614.
https://doi.org/10.1002/hyp.1358
![Figure 4. Subsoiler attachment [11].](https://thumb-us.123doks.com/thumbv2/123dok_us/8983628.394882/5.595.207.541.594.727/figure-subsoiler-attachment.webp)