ISSN Online: 1942-0749 ISSN Print: 1942-0730
DOI: 10.4236/jemaa.2019.115005 May 31, 2019 55 Journal of Electromagnetic Analysis and Applications
Multiphysics Analysis for Thermal Management
of a 3 MeV, 325 MHz Radio Frequency
Quadrupole Accelerator for Indian
Spallation Neutron Source
N. K. Sharma
1,2*, C. P. Paul
1,2, S. C. Joshi
1, G. V. Kane
1, A. Chaturvedi
11Raja Ramanna Centre for Advanced Technology, Indore, India 2Homi Bhabha National Institute, Mumbai, India
Abstract
We present multiphysics design studies for thermal management of a 325 MHz 3 MeV Radio Frequency Quadrupole (RFQ) structure for the front end of 1 GeV proton linac for proposed Indian Spallation Neutron Source (ISNS). Physics design of RFQ for ISNS application has been carried out for 10% (maximum) duty factor. During high power operation of RFQ, RF-induced heating would result in temperature rise, thermal deformations and frequen-cy shift of RFQ from designed values. Therefore thermal management is one of the important design considerations for RFQ development. During design studies, electromagnetic analysis of RFQ cavity is performed to compute RF induced heat fluxes on RFQ surfaces using SUPERFISH and ANSYS software. Simulated results for both codes were compared and found in well agreement. A water cooling scheme has been designed to absorb RF induced heat from RFQ structure. Cooling parameters are optimized by employing univariate search method optimization technique. An RF-Thermal-Structural-RF coupled multi-physics analysis methodology is developed to evaluate thermal induced frequency detuning of ISNS RFQ structure. Parametric studies are carried out to investigate the effect of cooling water temperatures on RFQ frequency. Based on analysis results, cooling water temperatures are varied to restore RFQ fre-quency to designed values. Thus, water cooling will not only remove heat from structure, but it will also be used for online control of resonating frequency during steady state operation of RFQ structure. Results of numerical studies carried out for thermal management of ISNS RFQ are presented in thispaper.
Keywords
Multiphysics, RFQ, ISNS, ANSYS, Electromagnetic, Thermal, Structural, How to cite this paper: Sharma, N.K.,
Paul, C.P., Joshi, S.C., Kane, G.V. and Chaturvedi, A. (2019) Multiphysics Analy-sis for Thermal Management of a 3 MeV, 325 MHz Radio Frequency Quadrupole Accelerator for Indian Spallation Neutron Source. Journal of Electromagnetic Analy-sis and Applications, 11, 55-78.
https://doi.org/10.4236/jemaa.2019.115005
Received: November 30, 2018 Accepted: May 28, 2019 Published: May 31, 2019
Copyright © 2019 by author(s) and Scientific Research Publishing Inc. This work is licensed under the Creative Commons Attribution International License (CC BY 4.0).
DOI: 10.4236/jemaa.2019.115005 56 Journal of Electromagnetic Analysis and Applications Water Cooling, Detuning
1. Introduction
Raja Ramanna Centre for Advanced Technology (RRCAT) Indore is involved in the development of a 1 GeV H-injector linac for proposed Indian Spallation Neutron Source (ISNS) [1] [2]. The ISNS facility will be used for research in the fields of material science, condensed matter physics, nuclear physics, chemistry, biology and engineering. The major subsystems of ISNS consist of H− ion source, Radio Frequency Quadrupole (RFQ), Drift Tube Linac (DTL), Spoke Resonators (SR), Superconducting Radio Frequency (SCRF) cavity, Accumulator Ring (AR) and high atomic number target material [3] [4]. RFQ is an important subsystem of linac for low velocity ion beams typically in the range of 0.01 - 0.08 times the speed of light. It is a four-vane alternate gradient resonating structure which performs bunching, focusing and acceleration of ion beam simultaneous-ly. Beam dynamics and electromagnetic design of a 3 MeV, 325 MHz H-RFQ li-nac have been carried out. RFQ has been designed to accelerate up to 15 mA beam current from 50 keV to 3 MeV. Engineering design and fabrication of ISNS RFQ is in progress [5]. Due to high thermal and electrical conductivity, strength, fabrication feasibility, vacuum properties and cost aspects, OFE (Oxy-gen Free Electronic) copper is chosen as material of construction for RFQ linac. The 3.5 m long RFQ structure will be fabricated by machining and joining three segments of length ~1150 mm each. The major challenges during RFQ develop-ment are machining of vanes within desired accuracies, brazing of vanes to form an RFQ segment, tuning of 3.5 m long RFQ for electric field profile and thermal stability of RFQ structure during operation. The issue of thermal stability of RFQ structure is addressed in the present paper.
analy-DOI: 10.4236/jemaa.2019.115005 57 Journal of Electromagnetic Analysis and Applications sis methodology has been developed for RFQ structure and presented in paper. All analysis (RF, thermal and structural) and their coupling are carried out using a single code namely ANSYS Mechanical version 19.0. To the best of our know-ledge, details of multiphysics analysis methodology are not available in open li-terature. Also, majority of the published literature reports RF analysis of initial and deformed cavity geometry with SUPERFISH code and intermediate thermal and structural analysis using ANSYS/ABAQUS codes. Transfer of data and mesh from one code to other may lead data loss and error in simulated results. Present methodology proposes complete simulations using single code (ANSYS Me-chanical) and thus eliminates the issue of data loss completely.
The paper is organized as follows. In the next section important parameters of RFQ emerged from physics design have been described. In Section 3, computa-tion of surface heat fluxes due to electromagnetic field have been presented using SUPERFISH code version 7.17. SUPERFISH is an established 2D code for RF simulations of resonating cavities. Based on evaluated heat fluxes, thermal anal-ysis of RFQ without cooling channel is discussed in Section 4. It was inferred from results that water cooling is essential for thermal stability of RFQ structure. Section 5 presents the design of a cooling scheme to dissipate heat from RFQ structure and optimization of cooling parameters using univariate search me-thod optimization technique. Section 6 describes the development of ANSYS version 19.0 code based RF-Thermal-Structural-RF coupled multiphysics analy-sis methodology for evaluating thermal induced frequency detuning of RFQ structure. RF analysis of RFQ is performed using ANSYS code and results are compared with SUPERFISH code. Results obtained from two codes are found in well agreement. The advantage of using ANSYS code for RF analysis lies in the fact that ANSYS RF analysis can be further coupled with thermal, structural and back to RF analysis for evaluating thermal induced frequency shift in RFQ structure. Section 7 presents the implementation of multiphysics analysis me-thodology for evaluating the effect of cooling water temperatures on RFQ fre-quency. RFQ water cooling will serve dual purposes. It will remove heat from RFQ and it will also be used for fine control of RFQ frequency by varying cool-ing water temperatures. Section 8 presents the RFQ simulations for various duty factors (maximum ~10%) and evaluation of optimum parameters for minimiz-ing thermal induced frequency shift of RFQ structure. Finally, concludminimiz-ing dis-cussions are presented in Section 9.
2. RFQ Physics Design
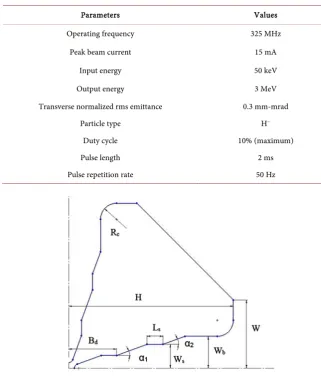
DOI: 10.4236/jemaa.2019.115005 58 Journal of Electromagnetic Analysis and Applications Table 1. Design parameters of RFQ.
Parameters Values
Operating frequency 325 MHz
Peak beam current 15 mA
Input energy 50 keV
Output energy 3 MeV
Transverse normalized rms emittance 0.3 mm-mrad
Particle type H−
Duty cycle 10% (maximum)
Pulse length 2 ms
Pulse repetition rate 50 Hz
Figure 1. Cross-section of one quadrant of an RFQ cavity.
Beam dynamics studies for RFQ were performed to minimize the emittance growth and maximizing particle transmission. Vane tip parameters like average aperture radius and transverse radius of curvature were optimized by beam dy-namics code namely Curli, RFQuick and Pari. Figure 1 shows the cross section of one quadrant of RFQ cavity. Figure 2 shows details near the vane tip for RFQ quadrant. Table 2 lists the optimized cell parameters and beam parameters of RFQ.
DOI: 10.4236/jemaa.2019.115005 59 Journal of Electromagnetic Analysis and Applications Figure 2. Cross-section of one quadrant of RFQ cavity near vane tip.
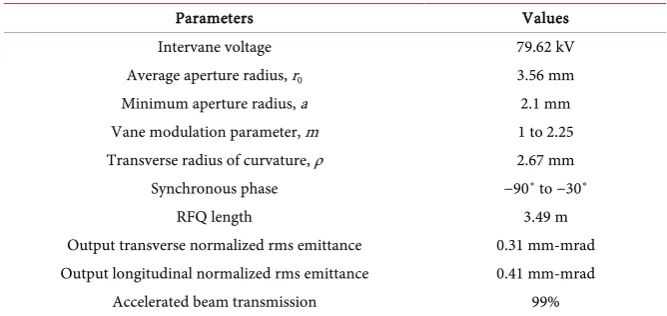
Table 2. Optimized cell parameters and beam parameters of RFQ.
Parameters Values
Intervane voltage 79.62 kV
Average aperture radius, r0 3.56 mm
Minimum aperture radius, a 2.1 mm Vane modulation parameter, m 1 to 2.25 Transverse radius of curvature, ρ 2.67 mm Synchronous phase −90˚ to −30˚
RFQ length 3.49 m
Output transverse normalized rms emittance 0.31 mm-mrad Output longitudinal normalized rms emittance 0.41 mm-mrad
Accelerated beam transmission 99%
Table 3. Geometrical parameters of RFQ.
Parameters Values
Breakout angle, αbk 20˚
Vane blank half width, Bw 8 mm
Vane blank depth, BD 30 mm
Vane shoulder half width, Ws 15 mm
Vane base half width, Wb 20 mm
Vane shoulder length, Ls 10 mm
Vane angle 1, α1 200
Vane angle 2, α2 20˚
Corner radius, Rc 10 mm
Vane height, H 103.38 mm
[image:5.595.207.539.547.722.2]DOI: 10.4236/jemaa.2019.115005 60 Journal of Electromagnetic Analysis and Applications
3. Computation of Surface Heat Fluxes for RFQ Structure
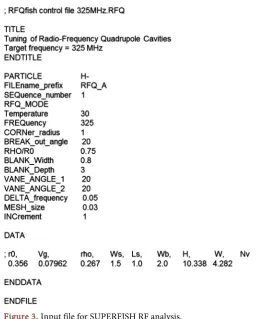
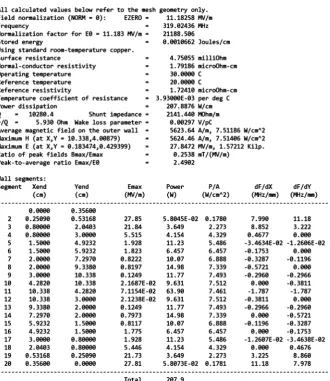
The electromagnetic analysis of RFQ cavity is carried out using SUPERFISH code. The analysis aims for evaluation of cavity frequency, quality factor, power loss and surface heat fluxes required for thermal design of RFQ. The geometric parameters obtained from physics design are used as input for RF analysis. Ac-cordingly a notepad text file is generated to model one quadrant of RFQ cross section. The file is assigned with .RFQ (dot RFQ) extension and executed in RFQfish tuning programme of SUPERFISH code. Figure 3 shows a screen shot of input file used for RF analysis. The data line of input file consists of nine pa-rameters as shown in input file. Eight papa-rameters are defined based on physics design and last option Nv was left blank. RF analysis of cavity was performed and results are summarized in output file. Figure 4 shows a screen shot of simulated results from output file. Cavity frequency and quality factor were evaluated as 319.024 MHz and 10280 respectively. Total power loss for RFQ was computed as 207.9 Watt/cm for one quadrant of RFQ cross section.
4. Thermal Analysis of RFQ without Water Cooling
[image:6.595.246.519.398.718.2]After evaluating heat fluxes from RF analysis, thermal analysis of RFQ is carried out for evaluating temperature rise in RFQ structure. A 2D cross section of RFQ is modeled using ANSYS finite element analysis software. The power loss for the thermal analysis has been considered 30% more than the power loss calculated
DOI: 10.4236/jemaa.2019.115005 61 Journal of Electromagnetic Analysis and Applications Figure 4. SUPERFISH RF analysis results.
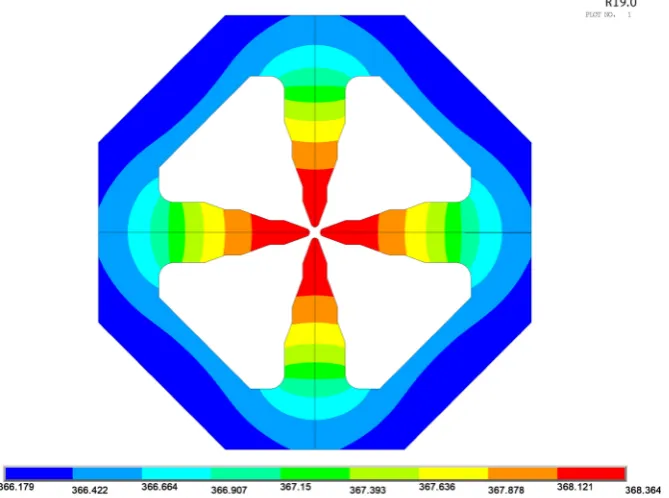
by SUPERFISH to compensate for the deviation in ideal surface conditions, theoretical electrical conductivity and joints etc. Duty factor for analysis is con-sidered as 3%. The heat fluxes obtained from RF analysis are applied as loads for thermal analysis. RFQ cooling is assumed to be from natural convection only. Therefore, a heat transfer coefficient of 10 W/m2K with bulk temperature of 25˚C was applied for RFQ surfaces exposed to atmosphere. Thermal conductivity of copper is considered as 400 W/m-K. Steady state thermal analysis of RFQ is car-ried out to evaluate temperature distribution for RFQ. Figure 5 shows tempera-ture distribution for RFQ structempera-ture. It was found that maximum temperatempera-ture of RFQ reaches ~368˚C. Therefore forced cooling of the structure is required and water cooling channels must be provided to absorb heat from RFQ structure.
5. Design of Cooling Scheme for RFQ Structure
DOI: 10.4236/jemaa.2019.115005 62 Journal of Electromagnetic Analysis and Applications Figure 5. RFQ temperature profile without water cooling.
Figure 6. One quadrant of RFQ with cooling channels and parameters nomenclature.
scheme and nomenclature used for RFQ structure. Circular cooling channels are designed for ease of fabrication. The diameter for each cooling channel is consi-dered as 12 mm. Maximum flow velocity for cooling channels is restricted to 2 m/s to avoid material erosion. The local Nusselt number and convective heat transfer coefficients for cooling channels were calculated by using Dittus Boelter equation (Equation (1)). It is an established empirical correlation for fully de-veloped turbulent flow inside a circular tube [8]. The simplified form of Dittus Boelter equation is presented by Equation (2).
( )
( ) ( )
0.8 0.4 [image:8.595.289.459.364.552.2]DOI: 10.4236/jemaa.2019.115005 63 Journal of Electromagnetic Analysis and Applications
0.8 0.4
0.023 v d CP
d k h k ρ µ µ × = × × × × ×
(2)
Symbols:
Nu = Nusselt number Re = Reynold number Pr = Prandtl number
h = Convective heat transfer coefficient (W/m2K)
d = Diameter of cooling channel (m) k = Thermal conductivity (W/m-K) ρ = Density of fluid in (kg/m3)
v = Flow velocity (m/s)
μ = Dynamic viscosity of fluid (kg/ms) Cp = Specific heat (J kg/K)
The Univariate search method optimization technique was employed for op-timization of cooling parameters [9]. In this method, an objective function and independent variables affecting objective function are identified and effect of independent variables on objective function is evaluated to optimize indepen-dent variables. The objective function is optimized with respect to one variable at a time, while keeping other variables constant. The range of independent va-riables is defined to calculate objective function. Initially arbitrary values of all independent variables are substituted and calculations are carried out to predict objective function. Than one variable is varied within its complete range and its effect on objective function is evaluated. All other independent variables are kept constant while studying the effect of this variable on objective function. The op-timum value of variable is thus evaluated and is used for further calculations. In next iteration, second variable is varied within its complete range and its effect on objective function is evaluated. The optimum value of second variable is thus calculated. The optimal value is substituted into the function and the function is further optimized with respect to next variable. The function is optimized with respect to each variable in sequence with the optimal value of a variable substi-tuted into the function for the optimization of the succeeding variables. The op-timization process continues until the successive change of the dependent or in-dependent variables is less than a specified tolerance.
During design of cooling scheme, cooling channel locations, heat transfer coefficients and RFQ wall thickness are considered as independent variables. Temperature rise in RFQ structure is considered as objective function. Optimi-zation procedure was started by assuming some trial values of parameters. A se-ries of multiple iterative analyses for RFQ structure was carried out and temper-ature distribution was evaluated. Parameters were varied according to optimiza-tion technique and after few iteraoptimiza-tions, the following optimized parameters are obtained for minimum temperature rise in RFQ structure.
DOI: 10.4236/jemaa.2019.115005 64 Journal of Electromagnetic Analysis and Applications
• Cooling channel 3 location (x3) = 10 mm
• Heat transfer coefficient for cooling channel 1 (H1) = 8440 W/m2K
• Heat transfer coefficient for cooling channel 2 (H2) = 8440 W/m2K
• Heat transfer coefficient for cooling channel 3 (H3) = 8440 W/m2K
Heat transfer coefficient of 8440 W/m2K corresponds to a flow velocity of 2.0 m/s for a 12 mm diameter circular cooling channel. RFQ temperature distribu-tion for optimized parameters is shown in Figure 7. The heat flux corresponding to 3% duty cycle and 30% margin is applied for thermal analysis. The maximum temperature for RFQ structure was evaluated as 25.97˚C.
6. Multi-Physics Analysis of RFQ for Evaluating Thermal
Induced Frequency Shift
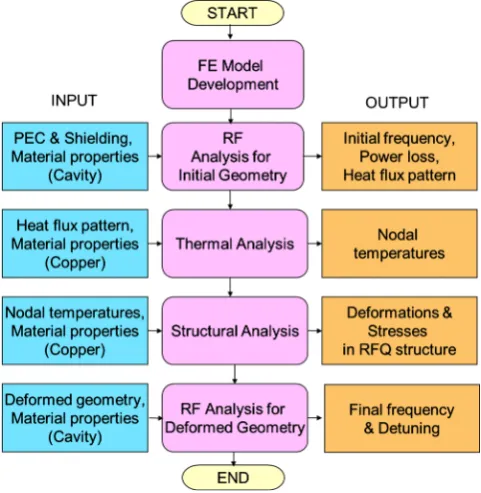
[image:10.595.196.542.445.714.2]A water cooling scheme has been designed to dissipate RF heat from RFQ struc-ture. The cooling parameters are optimized to minimize temperature rise within RFQ structure. However, temperature rise results thermal induced frequency detuning of RFQ from designed frequency and it becomes more critical at high duty factors. A multi physics analysis methodology has been developed to pre-dict thermal induced frequency shift of RFQ using ANSYS finite element analy-sis code. Proposed methodology for RFQ simulation conanaly-sists of five steps name-ly, Finite Element (FE) model development, RF analysis for initial RFQ geome-try, Thermal analysis, Structural analysis and again RF analysis for deformed RFQ geometry. Analysis process initiates with FE model development for RFQ cavity and RFQ wall domains. High Frequency Electromagnetic (RF)
DOI: 10.4236/jemaa.2019.115005 65 Journal of Electromagnetic Analysis and Applications analysis of RFQ cavity domain is performed to evaluate cavity frequency, quality factor, electromagnetic field distribution and cavity wall surface heat fluxes. Heat fluxes obtained from RF analysis are used as input for thermal analysis. Resulting temperature distribution obtained from thermal analysis is used as input for struc-tural analysis to evaluate RFQ thermal deformations. Strucstruc-tural displacements are transferred to update cavity geometry and RF analysis for updated geometry is per-formed again to estimate thermal induced frequency detuning of RFQ structure. Thus, RF-Thermal-Structural-RF coupled multi physics analysis predicts thermal induced frequency detuning of RFQ structure. Based on multi physics simula-tion results, water cooling will be used for control of RFQ resonant frequency for its stable operation. Figure 8 shows flow chart for RF-Thermal-Structural-RF coupled multiphysics analysis methodology for RFQ structure.
6.1. Finite Element (FE) Model Development
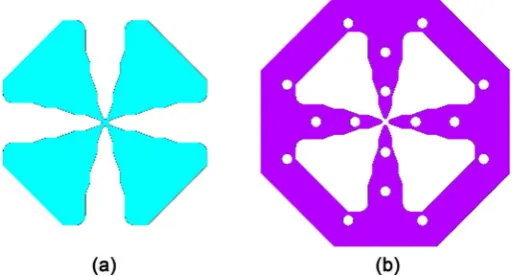
The Finite Element (FE) model for multiphysics analysis is developed using ANSYS Programming Development Language (APDL). RFQ FE model consists of two domains as shown in Figure 9. Domain 1 consists of electromagnetic re-gion of RFQ cavity (Figure 10(a)). Domain 2 consists of RFQ wall region
(Figure 10(b)). During FE model preparation, both domains are meshed with
[image:11.595.253.494.459.706.2]Mesh 200 elements, which share nodes at common boundaries. Mesh 200 ele-ments are dummy eleele-ments, where nodes and eleele-ments exist within that domain but they do not participate in the analysis. ANSYS has special provision of these dummy elements, which are useful in performing selective analysis of required domains during multi physics problems [10]. During multi physics analysis, do-main 1 is used for initial and final RF analysis, and dodo-main 2 is used for thermal
DOI: 10.4236/jemaa.2019.115005 66 Journal of Electromagnetic Analysis and Applications and structural analysis. During RF analysis of domain 1, the elements within domain 1 are converted in to appropriate High Frequency (HF120) elements, whereas the other domain still have Mesh 200 elements. Similarly, during ther-mal and structural analysis, the elements within domain 2 are converted in to appropriate thermal and structural elements and elements of domain 1 are con-verted in to Mesh 200 elements. Nodes at common boundaries of two domains are used to transfer results of one physics to another physics. Table 4 lists the material properties used for RFQ analysis.
[image:12.595.245.503.368.506.2]Figure 9. RFQ model for multiphysics analysis.
Figure 10. (a) RFQ cavity region (domain-1) for RF analysis; (b) RFQ wall region (do-main-2) for thermal and structural analysis.
Table 4. Material properties used for RFQ analysis.
Description Properties Unit Value
Vacuum (Domain 1) Relative Permeability - 1
Relative Permittivity - 1
Copper (Domain 2)
Modulus of Elasticity GPa 125
Poisson’s Ratio - 0.3
Thermal Conductivity W/m-K 400 Thermal Expansion m/ m0C 16 × 10−6
Electrical Conductivity simens / m 5.8 × 10⁷
[image:12.595.208.539.565.727.2]DOI: 10.4236/jemaa.2019.115005 67 Journal of Electromagnetic Analysis and Applications
6.2. RF Analysis for Initial Geometry
After FE model development, High Frequency Electromagnetic (RF) analysis of RFQ cavity region (domain-1) is performed. Elements within domain 1 are con-verted in HF 120 elements, whereas elements within domain 2 are still Mesh 200. Perfectly Electric Conductor (PEC) and shield conditions are applied at RFQ walls. RF analysis of cavity is performed to evaluate electric field distribution, magnetic field distribution, cavity resonating frequency, quality factor, in-ter-vane voltage, power loss and cavity wall surface heat fluxes. Figure 11 shows normalized electric field distribution for RFQ quadrupole mode. It is evaluated that electric field is maximum near cavity vane tip and it decreases near cavity wall. Figure 12 shows magnetic field distribution for RFQ cavity. Magnetic field is maximum at the cavity walls and it decreases at vane tip. Cavity resonating frequency and Quality Factor are evaluated as 319.031 MHz and 10,424 respec-tively. An ANSYS programme was developed to simulate RFQ inter vane voltage using electric field distribution and cavity geometry. A scale factor based on the ratio of designed intervene voltage (79.62 kV) and simulated inter vane voltage was evaluated. Simulated power loss from RF analysis was multiplied by the square of scale factor to evaluate the actual power loss. The power loss for RFQ cross section is evaluated as 836 W/cm. RFQ surface heat flux distribution is also scaled up by square of scale factor for subsequent thermal analysis.
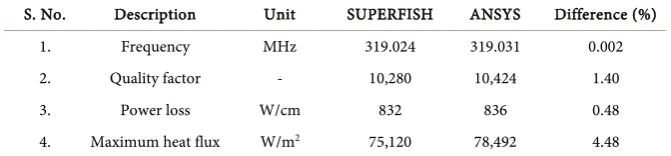
[image:13.595.201.541.437.734.2]Comparison of RF analysis results with SUPERFISH and ANSYS code The power loss in RFQ structure has been evaluated using SUPERFISH and ANSYS software. SUPERFISH is an established 2D electromagnetic analysis
DOI: 10.4236/jemaa.2019.115005 68 Journal of Electromagnetic Analysis and Applications Figure 12. Magnetic field distribution.
Table 5. Comparison of RF analysis results from SUPERFISH and ANSYS code.
S. No. Description Unit SUPERFISH ANSYS Difference (%) 1. Frequency MHz 319.024 319.031 0.002 2. Quality factor - 10,280 10,424 1.40
3. Power loss W/cm 832 836 0.48
4. Maximum heat flux W/m2 75,120 78,492 4.48
[image:14.595.205.541.391.469.2]per-DOI: 10.4236/jemaa.2019.115005 69 Journal of Electromagnetic Analysis and Applications formed within ANSYS itself, than during thermal analysis in ANSYS, there will be node to node transfer of heat flux from RF to thermal analysis and tempera-ture distribution would be more accurate because there is no averaging of heat flux for wall segments.
6.3 Thermal Analysis
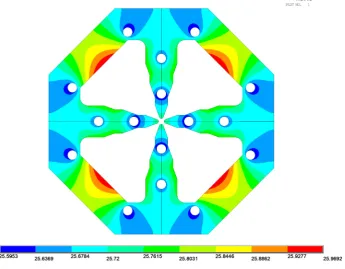
After evaluating initial frequency and heat fluxes from RF analysis, thermal analysis of RFQ is performed for evaluating temperature distribution in RFQ structure. During thermal analysis, Mesh 200 dummy elements of domain 2 are converted into ANSYS thermal elements (Solid 90). HF 120 elements of domain 1 are converted into Mesh 200 dummy elements. Heat flux distribution eva-luated from RF analysis is shown in Figure 13. Heat flux pattern shows that it is minimum near vane tip where magnetic field is minimum. It increases conti-nuously as we move away from vane tip. It is expected because magnetic field intensity is also varying in similar way and power loss is proportional to the square of magnetic field intensity. Heat flux on various segments varies from 0 to 78,492 W/m2. RF analysis output file “.rmg” was used to apply surface heat fluxes for thermal elements. Heat fluxes are applied with 3% duty factor and 30% margin during thermal analysis. Heat transfer coefficient of 8440 W/m2K with bulk temperature of 25˚C is applied for cooling channels. Steady state thermal analysis of RFQ is performed and temperature distribution has been evaluated.
Figure 14 shows temperature distribution for RFQ structure. The maximum
[image:15.595.200.539.432.732.2]temperature in RFQ is found to be 25.73˚C.
DOI: 10.4236/jemaa.2019.115005 70 Journal of Electromagnetic Analysis and Applications Figure 14. Temperature distribution for RFQ.
6.4. Structural Analysis
Subsequent to RF and thermal analysis, structural analysis is next step for RFQ multiphysics analysis. Structural analysis is carried out to evaluate thermal de-formations and stresses in RFQ structure. During structural analysis, the thermal elements Solid 90 used in thermal analysis are switched to structural elements Solid 186. The output file “.rth” obtained from thermal analysis is used to apply temperature loading for structural analysis. The displacement constraints are applied such that the RFQ structure is free to expand in the radial and longitu-dinal directions. The bottom plane is constrained in downward direction. The ambient temperature for deformation calculations is taken as 25˚C. Structural analysis is performed to evaluate stress and deformations developed in RFQ structure. Figure 15 shows deformation pattern in RFQ structure. Maximum Deformation in RFQ structure is found to be 2.6 microns. Figure 16 shows the stress distribution within RFQ structure. Maximum stress was ~1 MPa, which is much less than yield strength of copper (80 MPa). Induced stresses are within the limit and there will not be any permanent deformations possible during op-eration of RFQ under these conditions.
6.5. RF Analysis for Deformed Geometry
DOI: 10.4236/jemaa.2019.115005 71 Journal of Electromagnetic Analysis and Applications Figure 15. Deformation pattern for RFQ.
Figure 16. Stress distribution for RFQ.
DOI: 10.4236/jemaa.2019.115005 72 Journal of Electromagnetic Analysis and Applications into Mesh 200 elements. PEC electric wall conditions are applied at cavity boundaries. RF analysis of RFQ cavity region is performed to obtain final fre-quency and thermal induced frefre-quency shift of RFQ structure. Based on analysis results, thermal induced frequency detuning of −1.230 kHz is evaluated for RFQ structure. The RFQ frequency shift can be controlled by varying cooling water temperatures.
7. Effect of Cooling Water Temperatures on RFQ Frequency
[image:18.595.200.539.459.707.2]Water cooling in RFQ will serve two purposes. It will remove RF induced heat from RFQ structure as well as water cooling will also be used for restoring RFQ frequency at designed values during steady state operation. Therefore, parametric studies based on multiphysics analysis methodology have been carried out to in-vestigate the effect of cooling water temperatures on RFQ frequency [11]. During simulations, cooling channel 1 water temperature (T1) is varied from 20˚C to 30˚C in a step of 1˚C. Cooling channel 2 water temperature (T2) and cooling channel 3 water temperature (T3) are kept constant at 25˚C. Multiphysics analyses are per-formed for each case and temperature distribution, thermal deformations and thermal induced frequency shift for RFQ are evaluated. Figure 17 shows the ef-fect of variation of T1, T2 and T3 on frequency shift. RFQ frequency with all cooling water temperature at 25˚C has been considered as reference frequency and frequency shift has been evaluated with respect to this frequency. The fre-quency shift of RFQ was found to vary linearly with T1. Frefre-quency of RFQ structure decreases with increase in T1 and sensitivity is evaluated as −18.8 kHz/˚C. During next series of analysis, temperature T2 is varied from 20˚C to 30˚C in a step of 1˚C and temperatures T1 and T3 are kept constant at 25˚C. The
DOI: 10.4236/jemaa.2019.115005 73 Journal of Electromagnetic Analysis and Applications frequency shift of RFQ was found to vary linearly with T2. Frequency of RFQ structure decreases with increase in T2 and sensitivity is evaluated as −7.4 kHz/˚C. Similar analyses are performed for cooling channel 3 to evaluate the ef-fect of variation of T3 on frequency shift. It is found that efef-fect of variation of T3 on RFQ frequency is opposite to the effect evaluated for T1 and T2. Although, the frequency shift of RFQ is found to vary linearly with T3 in this case also, but frequency of RFQ structure increases with increase in T3 and sensitivity is eva-luated as 20.8 kHz/˚C. Analyses are also performed to evaluate the effect of cooling water temperature on RFQ frequency when T1 and T2 are varied and T3 is kept constant. Another series of analysis is performed to evaluate the effect on RFQ frequency if all T1, T2 and T3 are varied simultaneously. Figure 18 shows the results for these analyses.
Table 6 lists the effect of cooling water temperatures on RFQ frequency. It
was evaluated that, RFQ frequency decreases with increase in vane water tem-peratures. The RFQ cavity may be considered as a capacitor near vane tip and inductor near the cavity walls. An increase in vane cooling water temperature
[image:19.595.196.539.618.734.2]Figure 18. RFQ frequency shift with variation in combined cooling water temperatures.
Table 6. Frequency sensitivity of RFQ with cooling water temperatures.
S. No. Description Sensitivity (kHz/˚C)
DOI: 10.4236/jemaa.2019.115005 74 Journal of Electromagnetic Analysis and Applications gives lesser cooling on vane tip resulting higher deformations. Thus vane tips come closer to each other and gap between them reduces. This results an in-crease in capacitance and hence dein-crease in frequency of resonating cavity. On the other hand, RFQ frequency increases with increase in wall water tempera-tures. An increase in wall water temperature results less cooling on cavity walls resulting higher deformations. This results a decrease in cavity inductance and increase in cavity frequency. It may be noted that sensitivity evaluated by vary-ing T1 and T2 simultaneously is an algebraic sum of individual sensitivity of T1 and T2. Also, sensitivity evaluated by varying T1, T2 and T3 simultaneously is algebraic sum of individual sensitivity of T1, T2 and T3. Increase in T1 and T2 decreases frequency by an amount of 26.2 kHz/˚C, whereas increase in T3 in-creases frequency by 20.8 kHz/˚C. The net effect is decrease in RFQ frequency by 5.4 kHz/˚C, if all T1, T2 and T3 are varied simultaneously. It can be con-cluded from simulations that RFQ frequency varies linearly with cooling water temperatures and principle of superposition can be applied for combined effect of change in cooling water temperature on RFQ frequency. By varying cooling water temperatures, fine control on resonating frequency can be achieved during RFQ operation.
8. RFQ Frequency Control by Varying Cooling Water
Temperatures
[image:20.595.207.539.581.726.2]ISNS RFQ has been designed to operate in pulse mode with maximum 10% duty factor. RFQ will be operated initially with 3% duty factor and thereafter duty factor will be increased in steps like 5%, 7% and 10%. Cooling parameters re-sulting minimum temperature rise in RFQ structure are evaluated in Section 5. A multiphysics analysis methodology to predict frequency shift is elaborated in Section 6. Effect of cooling water temperature on RFQ frequency are investigated and presented in Section 7. Based on these studies, a series of simulations is per-formed for 3%, 5%, 7% and 10% duty factor operation of RFQ and cooling pa-rameters resulting minimum temperature rise, thermal deformations and fre-quency shift have been evaluated. Table 7 shows the results of analyses per-formed for 3% duty factor operation of RFQ.
Table 7. Multiphysics analysis results for 3% duty factor operation.
S. No. (˚C) T1 (˚C) T2 (˚C) T3 temperature (˚C) Maximum displacement, (μm) Maximum Frequency shift (Δf) (kHz)
1 25 25 25 25.73 2.60 −1.230
2 24.9 25 25 25.73 2.57 0.664
3 25 24.9 25 25.72 2.52 −0.486
4 25 24.8 25 25.70 2.43 0.259
5 25 25 25.1 25.81 2.95 0.879
DOI: 10.4236/jemaa.2019.115005 75 Journal of Electromagnetic Analysis and Applications The other parameters used for analysis are following.
• Cooling channel 1 location (x1) = 35 mm • Cooling channel 2 location (x2) = 80 mm • Cooling channel 3 location (x3) = 10 mm
• Heat transfer coefficient for cooling channels = 8440 W/m2K
• Wall thickness = 40 mm
Table 7 lists the various options for controlling RFQ frequency by varying
cooling water temperatures. However the best solution for thermal management would be such that, it minimizes temperature rise, thermal deformations and frequency shift of RFQ structure. It is inferred from table that option 7 is best suitable for heat removal and frequency control of RFQ structure for 3% duty factor operation. Hence water temperatures for cooling channels 1, 2 and 3 would be set at 24.8˚C during RFQ operation. RFQ temperature and deforma-tion pattern with these optimum parameters are shown in Figure 19 and Figure 20 respectively. Maximum temperature in RFQ was found to be 25.53˚C. Ther-mal deformations are restricted to 1.67 microns. TherTher-mal induced frequency detuning of RFQ is limited to −172 Hz only.
[image:21.595.211.540.459.708.2]Multiphysics analysis of RFQ is performed for higher duty factor namely 5%, 7% and 10%. Table 8 summarizes the analysis results for higher duty factors. It is evaluated that temperature gradient, deformations and frequency shift in-creases at higher duty factors. The increase in RFQ temperature, deformations and frequency shift with duty factors may be attributed to the fact that average power loss in RFQ structure increases with increase in duty factor. The increased power loss is due to the higher RF pulse repetition rate during high duty factor
DOI: 10.4236/jemaa.2019.115005 76 Journal of Electromagnetic Analysis and Applications Figure 20. Displacement pattern for RFQ with optimum parameters.
Table 8. Multiphysics analysis results for high duty factor operation of RFQ structure.
Duty Factor
(%) T1 & T2 (˚C) (˚C) T3 Temperature (˚C) Maximum Maximum Deformation (microns) Frequency Detuning (kHz)
3 25 25 25.73 2.60 −1.230
5 25 25 26.22 4.34 −2.050
7 25 25 26.71 6.07 −2.872
10 25 25 27.44 8.68 −4.104
Table 9. Optimum parameters for RFQ operation at higher duty factors.
Duty Factor
(%) T1 & T2 (˚C) (˚C) T3 Temperature (˚C) Maximum Maximum Deformation (micron) Frequency Detuning (kHz)
3 24.8 24.8 25.53 1.67 −0.172
5 24.6 24.6 25.82 2.46 0.066
7 24.4 24.4 26.11 3.26 0.304
10 24.2 24.2 26.64 4.93 0.131
[image:22.595.207.538.510.602.2]fre-DOI: 10.4236/jemaa.2019.115005 77 Journal of Electromagnetic Analysis and Applications quency detuning by cooling water temperatures.
9. Conclusion
A 3 MeV, 325 MHz RFQ structure for pulse mode operation is being developed for ISNS programme. A multiphysics analysis methodology and its implementa-tion for thermal management of ISNS RFQ structure have been presented in this paper. Computation of RF induced surface heat fluxes is carried out with SUPERFISH and ANSYS codes. The results of both codes are compared and maximum deviations of 5% are achieved for simulation results. ANSYS RF anal-ysis is further extended and an RF-Thermal-Structural-RF coupled multiphysics analysis methodology has been developed for accelerating structures. The me-thodology is used to evaluate temperature distribution, thermal deformations and thermal induced frequency shift for RFQ structure. A water cooling scheme is designed to remove RF heat from RFQ structure. Univariate search method optimization technique is employed to evaluate cooling parameters resulting in minimum temperature rise within RFQ structure. Cooling water in RFQ will serve two purposes. It will remove RF heat from the structure and will also be used for frequency control during steady state operation of RFQ. Effects of cooling water temperatures on RFQ frequency have been evaluated. It is estab-lished that RFQ frequency varies linearly with cooling water temperatures and the principle of superposition can be applied to predict RFQ frequency for com-bined effect of more than one cooling water temperatures. Various options for RFQ frequency control are investigated and parameters resulting in minimum temperature gradient, thermal deformations and frequency shift have been eva-luated for 3%, 5%, 7% and 10% duty factor operations. Due to linear behavior, it is convenient to use cooling water for fine control of RFQ frequency. The cool-ing water temperatures will be varied to restore RFQ frequency near designed values. The results of numerical studies would be used for thermal management and stable operation of ISNS RFQ at various duty cycles.
Conflicts of Interest
The authors declare no conflicts of interest regarding the publication of this pa-per.
References
[1] Bhawalkar, D.D., Bhujle, A.G., Fatnani, P., Hannurkar, P.R., Joshi, S.C., Karmarkar, M.G., Kotaiah, S., Mhaskar, S.P., Pande, S.A., Prabhu, S.S., Shinde, R.S., Shukla, S.K. and Singh, G. (2003) Indian Spallation Neutron Source. Indian Particle Accelerator Conference, RRCAT, Indore, 3-6 February 2002, 57-60.
[2] Joshi, S.C. (2018) R&D Activities for Indian Spallation Neutron Source. Indian Par-ticle Accelerator Conference (InPAC-2018), RRCAT, Indore, 9-12 January 2018. [3] Joshi, S.C., Roy, S.B., Hannurkar, P.R., Kush, P., Puntambekar, A., Shrivastava, P.,
DOI: 10.4236/jemaa.2019.115005 78 Journal of Electromagnetic Analysis and Applications Tel-Aviv, Israel, 9-14 September 2012, 843-845.
[4] Joshi, S.C. (2015) Critical Aspects of Spallation Neutron Source. Indo-JapanSchool on Advanced Accelerators of Ions & Electrons, IUAC, New Delhi, 17 February 2015.
[5] Kane, G.V., Sharma, N.K., Chaturvedi, A., Oraon, B., Veerbhadraiah, T., Kokil, S.V. and Joshi, S.C. (2018) Innovative Design of 3 MeV, 325 MHz RFQ Structure from Manufacturing Consideration. Indian Particle Accelerator Conference, InPAC-2018, RRCAT, Indore, 9-12 January 2018, 161-166.
[6] Gaur, R. and Kumar, V. (2018) Beam Dynamics and Electromagnetic Studies of a 3 MeV, 325 MHz Radio Frequency Quadrupole Accelerator. EPJ Nuclear Sciences & Technologies, 4, 9.
[7] Sharma, N.K., Joshi, S.C., Kumar, N. and Raghavendra, S. (2005) Optimization of Cooling Circuit for 350 MHz 4.5 MeV RFQ for Proposed High Power Proton Linac. Indian Particle Accelerator Conference (InPAC-2005), VECC, Kolkata, 1-5 March 2005, 507-508.
[8] Incropera, F.P., Dewitt, D.P., Bergman, T.L. and Lavine, A.S. (2006) Fundamentals of Heat and Mass Transfer. 6th Edition,Wiley,Hoboken, NJ.
[9] Sharma, N.K. and Joshi, S.C. (2009) Search Method Optimization Technique for Thermal Design of High Power RFQ Structure. Indian Particle Accelerator Confe-rence (InPAC-2009), RRCAT, Indore, 10-13 February 2009, 508-510.
[10] (2015) ANSYS Finite Element Analysis Software Manuals.