Microfiber-microcavity system for efficient
single photon collection
C
HANG-M
INL
EE,
1H
EE-J
INL
IM,
1,4M
IREUL
EE,
1C
HRISTIANS
CHNEIDER,
2S
EBASTIANM
AIER,
2S
VENH
ÖFLING,
2,3M
ARTINK
AMP,
2 ANDY
ONG-H
EEL
EE,
1,*1Department of Physics, Korea Advanced Institute of Science and Technology (KAIST), Daejeon 34141,
Republic of Korea
2Technische Physik, Physikalisches Institut and Wilhelm Conrad Röntgen-Research Center for Complex
Material Systems, Universität Würzburg, Am Hubland, D-97074, Würzburg, Germany
3SUPA, School of Physics and Astronomy, University of St. Andrews, St. Andrews, KY 16 9SS, UK 4Present Address: London Centre for Nanotechnology, University College London, London, WC1H
0AH, UK
Abstract: Single photon sources are key components for various quantum information processings. For practical quantum applications, bright single photon sources with efficient fiber-optical interfaces are highly required. Here, bright fiber-coupled single photon sources based on InAs quantum dots are demonstrated through the k-vector matching between a microfiber mode and a normal mode of the linear photonic crystal cavity. One of the modes of the linear photonic crystal cavity whose k-vector is similar to that of the microfiber mode is employed. From independent transmission measurement, the coupling efficiency directly into the fiber of 58% is obtained. When the quantum dot and cavity system is non-resonantly pumped with 80 MHz pulse train, a raw count rate of 1.81 MHz is obtained with g(2)(0) =
0.46. Resonant pump is expected to improve the rather high g(2)(0) value. Time-resolved
photoluminescence is also measured to confirm the three-fold Purcell enhancement. This system provides a promising route for efficient direct fiber collections of single photons for quantum information processing.
© 2016 Optical Society of America
OCIS codes: (230.5590) Quantum-well, -wire and -dot devices; (230.5298) Photonic crystals; (270.0270) Quantum Optics;
References and links
1. N. Gisin, G. G. Ribordy, W. Tittel, and H. Zbinden, "Quantum cryptography," Rev. Mod. Phys. 74, 145– 195 (2002).
2. E. Knill, R. Laflamme, and G. J. Milburn, "A scheme for efficient quantum computation with linear optics," Nature 409, 46–52 (2001).
3. S. Buckley, K. Rivoire, and J. Vučković, "Engineered quantum dot single-photon sources," Rep. Prog. Phys. 75, 126503 (2012).
4. M. Pelton, C. Santori, J. Vučković, B. Zhang, G. Solomon, J. Plant, and Y. Yamamoto, "Efficient Source of Single Photons: A Single Quantum Dot in a Micropost Microcavity," Phys. Rev. Lett. 89, 233602 (2002). 5. C. Santori, D. Fattal, J. Vučković, G. S. Solomon, and Y. Yamamoto, "Single-photon generation with InAs
quantum dots," New J. Phys. 6, 89–89 (2004).
6. W.-H. Chang, W.-Y. Chen, H.-S. Chang, T.-P. Hsieh, J.-I. Chyi, and T.-M. Hsu, "Efficient Single-Photon Sources Based on Low-Density Quantum Dots in Photonic-Crystal Nanocavities," Phys. Rev. Lett. 96, 117401 (2006).
7. S. Strauf, N. G. Stoltz, M. T. Rakher, L. A. Coldren, P. M. Petroff, and D. Bouwmeester, "High-frequency single-photon source with polarization control," Nature Photonics 1, 704–708 (2007).
8. J. Claudon, J. Bleuse, N. S. Malik, M. Bazin, P. Jaffrennou, N. Gregersen, C. Sauvan, P. Lalanne, and J.-M. Gérard, "A highly efficient single-photon source based on a quantum dot in a photonic nanowire," Nature Photonics 4, 174–177 (2010).
9. A. Laucht, S. Pütz, T. Günthner, N. Hauke, R. Saive, S. Frédérick, M. Bichler, M. C. Amann, A.
Holleitner, M. Kaniber, and J. Finley, "A Waveguide-Coupled On-Chip Single-Photon Source," Phys. Rev. X 2, 011014 (2012).
photons," Nature Communications (2013).
11. K. H. Madsen, S. Ates, J. Liu, A. Javadi, S. M. Albrecht, I. Yeo, S. Stobbe, and P. Lodahl, "Efficient out-coupling of high-purity single photons from a coherent quantum dot in a photonic-crystal cavity," Phys. Rev. B 90, 155303 (2014).
12. L. Sapienza, M. Davanço, A. Badolato, and K. Srinivasan, "Nanoscale optical positioning of single quantum dots for bright and pure single-photon emission," Nature Communications 6, 7833– (2015). 13. P. Lodahl, S. Mahmoodian, and S. Stobbe, "Interfacing single photons and single quantum dots with
photonic nanostructures," Rev. Mod. Phys. 87, 347–400 (2015).
14. S. Unsleber, C. Schneider, S. Maier, Y.-M. He, S. Gerhardt, C.-Y. Lu, J.-W. Pan, M. Kamp, and S. Höfling, "Deterministic generation of bright single resonance fluorescence photons from a Purcell-enhanced quantum dot-micropillar system," Optics Express 23, 32977 (2015).
15. M. Gschrey, A. Thoma, P. Schnauber, M. Seifried, R. Schmidt, B. Wohlfeil, L. K. U. ger, J. H. Schulze, T. Heindel, S. Burger, F. Schmidt, A. Strittmatter, S. Rodt, and S. Reitzenstein, "Highly indistinguishable photons from deterministic quantum-dot microlenses utilizing three- dimensional in situ electron-beam lithography," Nature Communications 6, 1–8 (2015).
16. X. Ding, Y. He, Z. C. Duan, N. Gregersen, M. C. Chen, S. Unsleber, S. Maier, C. Schneider, M. Kamp, S. Höfling, C.-Y. Lu, and J.-W. Pan, "On-Demand Single Photons with High Extraction Efficiency and Near-Unity Indistinguishability from a Resonantly Driven Quantum Dot in a Micropillar," Phys. Rev. Lett. 116, 020401 (2016).
17. N. Somaschi, V. Giesz, L. De Santis, L. J. C, A. M. P, G. Hornecker, P. S. L, T. Grange, C. Antón, J. Demory, C. Gomez, I. Sagnes, L.-K. N. D, A. Lemaître, A. Auffèves, W. A. G, L. Lanco, and P. Senellart, "Near-optimal single-photon sources in the solid state," Nature Photonics 10, 340–345 (2016).
18. J. L. O'Brien, A. Furusawa, and J. Vučković, "Photonic quantum technologies," Nature Photonics 3, 687– 695 (2009).
19. M. Davanço, M. T. Rakher, W. Wegscheider, D. Schuh, A. Badolato, and K. Srinivasan, "Efficient quantum dot single photon extraction into an optical fiber using a nanophotonic directional coupler," Appl. Phys. Lett. 99, 121101 (2011).
20. M. Fujiwara, K. Toubaru, T. Noda, H.-Q. Zhao, and S. Takeuchi, "Highly Efficient Coupling of Photons from Nanoemitters into Single-Mode Optical Fibers," Nano Lett. 11, 4362–4365 (2011).
21. L. Liebermeister, F. Petersen, A. von Münchow, D. Burchardt, J. Hermelbracht, T. Tashima, A. W. Schell, O. Benson, T. Meinhardt, A. Krueger, A. Stiebeiner, A. Rauschenbeutel, H. Weinfurter, and M. Weber, "Tapered fiber coupling of single photons emitted by a deterministically positioned single nitrogen vacancy center," Appl. Phys. Lett. 104, 031101 (2014).
22. S. Ates, I. Agha, A. Gulinatti, I. Rech, A. Badolato, and K. Srinivasan, "Improving the performance of bright quantum dot single photon sources using temporal filtering via amplitude modulation," Sci. Rep. 3, 1397 (2013).
23. B.-H. Ahn, C.-M. Lee, H.-J. Lim, T. W. Schlereth, M. Kamp, S. Höfling, and Y.-H. Lee, "Direct fiber-coupled single photon source based on a photonic crystal waveguide," Appl. Phys. Lett. 107, 081113 (2015).
24. C.-M. Lee, H.-J. Lim, C. Schneider, S. Maier, S. Höfling, M. Kamp, and Y.-H. Lee, "Efficient single photon source based on μ-fibre-coupled tunable microcavity," Sci. Rep. 5, 14309 (2015).
25. J. Johansen, S. Stobbe, I. Nikolaev, T. Lund-Hansen, P. Kristensen, J. Hvam, W. Vos, and P. Lodahl, "Size dependence of the wavefunction of self-assembled InAs quantum dots from time-resolved optical measurements," Phys. Rev. B 77, 073303 (2008).
26. M. Davanço, C. S. Hellberg, S. Ates, A. Badolato, and K. Srinivasan, "Multiple time scale blinking in InAs quantum dot single-photon sources," Phys. Rev. B 89, 161303 (2014).
27. M. Arcari, I. Söllner, A. Javadi, S. Lindskov Hansen, S. Mahmoodian, J. Liu, H. Thyrrestrup, E. H. Lee, J. D. Song, S. Stobbe, and P. Lodahl, "Near-Unity Coupling Efficiency of a Quantum Emitter to a Photonic Crystal Waveguide," Phys. Rev. Lett. 113, 093603 (2014).
28. D. Englund, D. Fattal, E. Waks, G. Solomon, B. Zhang, T. Nakaoka, Y. Arakawa, Y. Yamamoto, and J. Vučković, "Controlling the Spontaneous Emission Rate of Single Quantum Dots in a Two-Dimensional Photonic Crystal," Phys. Rev. Lett. 95, 013904 (2005).
29. S.-H. Kim, G.-H. Kim, S.-K. Kim, H.-G. Park, Y.-H. Lee, and S.-B. Kim, "Characteristics of a stick waveguide resonator in a two-dimensional photonic crystal slab," J. Appl. Phys. 95, 411 (2004). 30. R. Nagai and T. Aoki, "Ultra-low-loss tapered optical fibers with minimal lengths," Opt. Express 22,
28427–28436 (2014).
31. H. A. Haus, "Waves and Fields in Optoelectronics," Prentice Hall (1984).
32. J. D. Joannopoulos, S. G. Johnson, J. N. Winn, and R. D. Meade, Photonic Crystals (Princeton University Press, 2011).
33. H.-J. Lim, H. J. Lim, C. M. Lee, C.-M. Lee, B.-H. Ahn, B. H. Ahn, Y. H. Lee, and Y.-H. Lee, "Dual-rail nanobeam microfiber-coupled resonator," Optics Express 21, 6724 (2013).
34. M. W. Lee, C. Grillet, C. G. Poulton, C. Monat, C. L. C. Smith, E. Maegi, D. Freeman, S. Madden, B. Luther-Davies, and B. J. Eggleton, "Characterizing photonic crystal waveguides with an expanded k-space evanescent coupling technique," Optics Express 16, 13800–13808 (2008).
Savona, and A. Imamoğlu, "Explanation of Photon Correlations in the Far-Off-Resonance Optical Emission from a Quantum-Dot–Cavity System," Phys. Rev. Lett. 103, 207403 (2009).
36. A. Laucht, M. Kaniber, A. Mohtashami, N. Hauke, M. Bichler, and J. J. Finley, "Temporal monitoring of nonresonant feeding of semiconductor nanocavity modes by quantum dot multiexciton transitions," Phys. Rev. B 81, 241302 (2010).
37. E. Peter, S. Laurent, J. Bloch, J. Hours, S. Varoutsis, I. Robert-Philip, A. Beveratos, A. Lemaı̂tre, A. Cavanna, G. Patriarche, P. Senellart, and D. Martrou, "Fast radiative quantum dots: From single to multiple photon emission," Appl. Phys. Lett. 90, 223118 (2007).
38. E. Stock, W. Unrau, A. Lochmann, J. A. Töfflinger, M. Öztürk, A. I. Toropov, A. K. Bakarov, V. A. Haisler, and D. Bimberg, "High-speed single-photon source based on self-organized quantum dots," Semicond. Sci. Technol. 26, 014003 (2010).
39. S. Mosor, J. Hendrickson, B. C. Richards, J. Sweet, G. Khitrova, H. M. Gibbs, T. Yoshie, A. Scherer, O. B. Shchekin, and D. G. Deppe, "Scanning a photonic crystal slab nanocavity by condensation of xenon," Appl. Phys. Lett. 87, 141105 (2005).
40. A. Rastelli, F. Ding, J. D. Plumhof, S. Kumar, R. Trotta, C. Deneke, A. Malachias, P. Atkinson, E. Zallo, T. Zander, A. Herklotz, R. Singh, V. Křápek, J. R. Schröter, S. Kiravittaya, M. Benyoucef, R. Hafenbrak, K. D. Jöns, D. J. Thurmer, D. Grimm, G. Bester, K. Dörr, P. Michler, and O. G. Schmidt, "Controlling quantum dot emission by integration of semiconductor nanomembranes onto piezoelectric actuators," Phys. Status Solidi B 249, 687–696 (2012).
41. J. Beetz, T. Braun, C. Schneider, S. Höfling, and M. Kamp, "Anisotropic strain-tuning of quantum dots inside a photonic crystal cavity," Semicond. Sci. Technol. 28, 122002–6 (2013).
42. S. Sun, H. Kim, G. S. Solomon, and E. Waks, "Strain tuning of a quantum dot strongly coupled to a photonic crystal cavity," Appl. Phys. Lett. 103, 151102 (2013).
43. C. Schneider, T. Heindel, A. Huggenberger, P. Weinmann, C. Kistner, M. Kamp, S. Reitzenstein, S. Höfling, and A. Forchel, "Single photon emission from a site-controlled quantum dot-micropillar cavity system," Appl. Phys. Lett. 94, 111111 (2009).
44. K. Hennessy, A. Badolato, P. M. Petroff, and E. Hu, "Positioning photonic crystal cavities to single InAs quantum dots," Photonics and Nanostructures - Fundamentals and Applications 2, 65–72 (2004).
1. Introduction
Triggered single photon sources (SPSs) have been actively pursued over the past two decades, motivated by quantum information processing such as quantum key distribution [1] and quantum computing [2]. The triggered SPSs are required to have brightness, low error rate, and fast emission rate, which are of different importance depending on target applications [3]. Brightness, defined as a mean single photon number per pulse, is a crucial parameter for a deterministic SPS. The triggered SPSs are typically realized based on spontaneous emission of quantum emitters. Semiconductor quantum dots (QDs) have drawn considerable interest as solid-state quantum emitters owing to their high quantum efficiency and optical stability. However, it’s challenging to funnel the photons out of the semiconductor material due to total internal reflection. Various kinds of nanostructures have been engineered around a QD to efficiently collect single photons and/or increase the source speed via Purcell effect [4-17]. Nanowires and micropillars have been commonly applied, and over 70% brightness was obtained from a few of those structures [8,10,16,17].
Here we present bright fiber-coupled SPSs based on a QD embedded in a microfiber-microcavity system. The phase-matched coupling between a linear photonic crystal (PhC) cavity mode and a microfiber mode elevates the fiber coupling efficiency. Single photons from the QD are collected through the microfiber via the phase-matched cavity mode. High single photon count rate and brightness are achieved based on the efficient phase-matched fiber coupling. Significant Purcell enhancement is also confirmed from lifetime measurement. A series of data with different fibers and different QD-cavity systems supported consistency of the scheme.
2. Microfiber-microcavity system
The brightness of a fiber-coupled SPS is defined as the mean number of single photons per pulse and expressed as B = qβη, where q is internal quantum efficiency of the QD state, β is single mode coupling efficiency, and η is fiber coupling efficiency of the cavity mode. The internal quantum efficiency q typically ranges between 60
–
90% for InAs QDs [25,26]. The spontaneous emission factor β is expressed asb = g
cav(
g
cav+ g
other)
, where theg
cav (g
other) is the spontaneous emission rate into the cavity mode of interest (the other modes). The β factors of PhC cavity modes or waveguide modes are usually high [6,24,27] owing to the Purcell effect and the suppressedg
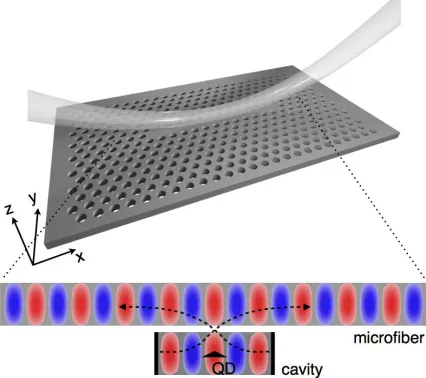
other by the bandgap [28]. On the other hand, the fiber coupling efficiency η was less than 50% and it was a main limiting factor of brightness in our previous fiber-coupled SPSs [23,24]. Therefore, we concentrated on finding a structure to maximize the η and consequently elevate the brightness B.Fig. 1. A schematic diagram of fiber-coupled linear photonic crystal cavity. The bottom schematic explains the phase-matched coupling between microfiber and cavity. A quantum dot is embedded inside the cavity.
The fiber coupling efficiency η is closely related to the loss channels of the structure. In this system, the total quality factor Q is decomposed into three terms as
1/ Q
=
1/ Q
fiber+
1/ Q
air+
1/ Q
slab. Accordingly the fiber coupling efficiency η is expressed ash=
Q Q
fiber=
1
- h
air- h
slab. Here, Qi is a quality factor associated with each loss channel (i =fiber, air, slab). To maximize the η, the coupling into the fiber (
1 Q
fiber; fiber coupling rate) [image:4.612.199.412.354.543.2]PhC cavity is designed to be a stick-shape linear cavity which is 13a long (a : lattice constant of the PhC), namely L13 cavity. The bottom schematic of the Fig. 1 describes a phase-matched coupling between the cavity and the microfiber, which is a key concept of this SPS. Resonant modes of the fiber-coupled L13 cavity were investigated by finite-difference time-domain (FDTD) simulations (Fig. 2). The resonant modes were located along a dispersion curve of a PhC waveguide [29] and labeled as M1-M8 from the lowest frequency (Fig. 2(a)). For each mode, quality factors into each loss channel (Qfiber, Qslab, Qair) and fiber
coupling efficiencies were calculated and are shown in Fig. 2(b,c). The fiber coupling rate
(1/Qfiber) is high when the k-vector of a cavity mode is close to the phase-matching region
(blue shaded circle in Fig. 2(a)). Qair is smaller than Qslab by 1-2 orders of magnitude, which
means that radiation to the air is the dominant loss channel. The loss to the air (1/Qair) keep
increasing as the k-vector approaches the radiation zone. As a result, the fiber coupling efficiencies of the M3 and M4 modes in the vicinity of the phase-matching region are high (> 80%) (Fig. 2(c)). The fiber coupling efficiencies of the M1 and M2 modes could also be large if the Qloss remains high enough after fabrication. Our experimental Qloss stays order of 104
owing to imperfect fabrication (shown in Fig. 4(a)).
Fig. 2. (a) k-space distribution of the resonant modes of L13 cavity (red circles) and dispersion relations of a microfiber (dashed line) and a photonic crystal waveguide (green solid line). k-vector of each mode is located having equal spacing with adjacent modes. Resonant modes are marked M1-M8 from the lowest frequency. The black (gray) shaded area represents radiation modes to the air (transverse-magnetic modes leaking through the slab). (b) Qfiber (red dots), Qair (blue diamonds), and Qslab (green squares) of
[image:5.612.141.472.292.574.2]3. Sample fabrication and measurement setup
The InAs/GaAs QD wafer was grown by molecular beam epitaxy (MBE). Density of the InAs QDs was about 1×108 cm-2. Our PhC cavities were fabricated by e-beam lithography using
positive e-beam resist (ZEP-520A, ZEON chemicals). After development, chlorine-assisted argon beam etching drilled the PhC holes in the wafer. Selective wet etching with hydrofluoric acid undercut the AlxGa1-xAs sacrificial layer to make the structure
free-standing. Lattice constant, hole radius, and slab thickness were a = 253 nm, 0.33 a, and 125 nm, respectively.
A conventional single-mode optical fiber was tapered with flame-brush techniques to fabricate the microfibers. Compared to our previous microfibers [24], we reduced the pulling speed to approach the adiabatic condition [30] and decreased the flame oscillation speed to suppress the flame fluctuations. We achieved a high transmission of 93% with a short taper length of 16 mm. After the tapering, the microfiber was delicately curved and shaped with translational stages. The curved microfiber was fixed at an aluminum unit, and the unit was loaded inside the cryostat. Diameter of the taper waist was 0.8 μm, and the radius of curvature was 100 μm.
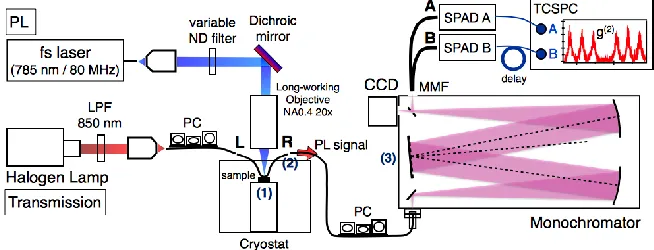
Fig. 3. Fiber-coupled optical measurement setup. PL: Photoluminescence, LPF: long-pass filter, PC: polarization controller, ND: neutral-density, CCD: charge coupled device, MMF: multi-mode fiber, SPAD: single-photon avalanche diode, TCSPC: time-correlated single-photon counter.
The measurement setup is shown in Fig. 3. A 780-nm femtosecond laser with repetition rate of 80 MHz was used as a pump source. The pump laser was incident by an objective lens, and the signal was collected through the microfiber. A halogen lamp was incident to one arm of the fiber as a broad-band light source for the transmission measurement. The PhC sample and the microfiber were loaded inside a closed cycle cryostat. Collected signals were spectrally filtered with 0.1-nm window by a monochromator and measured by a charge coupled device (CCD) or a Hanbury Brown and Twiss (HBT) setup. Single-photon avalanche diodes (SPADs) which have detection efficiencies of 12.3% and 13.1% and response time of 400 ps were used to measure single photon count rates as well as second-order autocorrelations. Another SPAD which has faster response time of 40 ps and a lower detection efficiency was used to measure time-resolved PLs of the QDs inside cavities. Total transmission of the setup is calibrated with a tunable laser tuned near the QD emission wavelength. Transmission of the curved microfiber, FC-type fiber connector, and the monochromator (denoted as (1), (2), (3) in Fig. 3) are 0.93, 0.95, 0.36, respectively.
[image:6.612.140.467.307.432.2]4. Bright fiber-coupled single photon sources
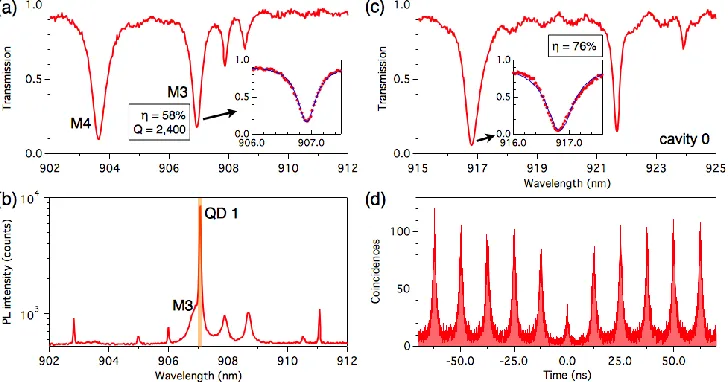
We measured resonant transmission spectra to characterize the fiber-coupled PhC cavities. The fiber coupling of the cavity modes induces transmission dips, which are fitted and analyzed by the coupled mode theory [31-33]. The fiber coupling efficiencies and the quality factors are obtained from the fitting. The PhC L13 cavity of interest (cavity 1) had several resonant modes in its transmission spectrum (Fig. 4(a)). The spectral separation between adjacent modes decreases as it approaches the bandedge (~ 909 nm), which is a characteristic behavior of waveguide-like PhC cavities [29,34]. As one can observe in Fig. 4(a) and 4(b), the M3 cavity mode at 906.9 nm showed a strong photoluminescence (PL) peak which is from a spectral overlap with a QD. So the M3 mode was investigated in detail and it showed fiber coupling efficiency η of 58% and quality factor of 2,400. We utilized the M3 mode instead of M4 mode because we couldn’t find a QD that was spectrally and spatially coupled to the M4 mode due to the low QD density. The transmission dip of M4 mode was deeper, which means its η is larger as 67%. Since the M4 and M3 are two deepest cavity modes, the phase matching point to a microfiber mode is expected to lie between M4 and M3 modes. We confirmed that the highest η from the fabricated samples was 76% (cavity 0, Fig. 4(c)), which is comparable to the calculated η of 89%. However, since it is difficult to locate the cavity mode satisfying the ideal phase-matching conditions, the highest η for each cavity typically varied in the range of 60-76%. Besides, finding the high–η cavity mode which was spatially and spectrally coupled to a QD perfectly was hindered by the low QD density.
Fig. 4. (a) Transmission spectrum of the cavity 1. Inset: The M3 mode is fitted to obtain the fiber coupling efficiency of 58%. (b) Photoluminescence spectrum of the cavity 1. The QD signal at 907 nm (QD 1) is spectrally filtered. The orange bar indicates the spectral window of 0.1 nm. (c) Transmission spectrum of cavity 0.Inset: The cavity mode near 917 nm is fitted to obtain the fiber coupling efficiency of 76%. (d) Second-order autocorrelation histogram of the QD 1 peak in (b) measured with the HBT setup. Pump power was 0.7 μW and integration time was 100 s. It shows clear antibunching with g(2)(0) = 0.28.
[image:7.612.124.488.354.545.2]setup with SPADs. Second-order autocorrelation histogram of the QD 1 peak manifests single photon nature with g(2)(0) of 0.28 (Fig. 4(d)). The nonzero g(2)(0) value mainly stems from the
[image:8.612.190.419.143.310.2]recapture process [5,37] and cavity-enhanced QD continuum states [35,36]. It can be significantly suppressed by (quasi-) resonant pumping scheme [5].
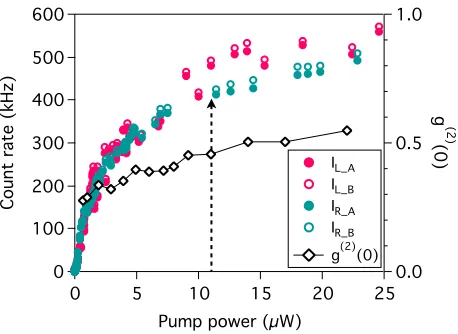
Fig. 5. Pump power dependence of the single photon count rate and g(2)(0). Red and green dots represent detected photon count rates at
the pump power. Here, the subscript L (R) indicates the detected count rate from the left (right) arm of the fiber, and A (B) denotes the count rate measured at the detector A (B). g(2)(0) is marked with
black diamond. Dashed arrow indicate the maximum pump power of 11 μW in the limit of g(2)(0) < 0.5.
Next, the pump power dependence of single photon count rates and g(2)(0) were studied
(Fig. 5). Here the single photons from both left and right arms of the fiber were detected. The single photon count rates showed saturation behaviors, which is a typical characteristic of a two-level system. When the pump power was 11 μW, the detected single photon count rates were IL_A = 480 kHz, IL_B = 492 kHz, IR_A = 413 kHz, IR_B = 424 kHz, with the g(2)(0) value of
0.46. Here, the subscript L (R) indicates the detected count rate from the left (right) arm of the fiber, and A (B) denotes the count rate measured at the detector A (B). The overall raw count rate was IL_A + IL_B + IR_A + IR_B = 1.81 MHz. After excluding the unwanted background
signal [4] by multiplying 1-g(2) 0
( )
, the total estimated single photon count rate was 1.33 MHz. Taking into account the setup transmission of 0.33 and the detection efficiencies of 12.3% and 13.1% for the respective detectors in the HBT setup, the collected single photon count rate was estimated to be 32 MHz, and the corresponding brightness B = 40%. We underline that the microfiber has high transmission of 93% by optimizing the fiber tapering processes. The corresponding transmission from the taper waist to the one end of the fiber is 96%. The relatively high g(2)(0) value is attributed to cavity-enhanced background signal[35,36] and carrier recapture process [37]. The g(2)(0) value should be suppressed further for
Fig. 6. (a) Time-resolved PL measurement of the on-resonance QD (QD 1) and the off-resonance QD (QD 2). The histogram of the QD 1 is fitted using a bi-exponential decay function (red line), and the fast (slow) component is 390 ps (1.77 ns). The histogram of the QD 2 is fitted using a mono-exponential decay function (black line), and the lifetime is 5.3 ns. The exponential fits of the decay curves are marked with dashed lines. (b) Transmission spectrum of the cavity containing the QD 2. Spectral positions of the resonant modes are denoted as the transmission dips. (c) Photoluminescence spectrum of the QD-cavity system. A quantum dot signal located at 895.9 nm (QD 2, indicated by a black arrow) is spectrally far from any cavity mode.
Time-resolved PLs of the QD signal was also measured to confirm the Purcell effect (Fig. 6(a)). The Purcell effect is known to be advantageous for fast SPSs [38] and high β factors [6]. The spectrally filtered QD signal was measured with a fast SPAD which was triggered by pump pulses (red line in Fig. 6(a)). The histogram shows a bi-exponential decay and the fast (slow) component is associated with the radiative decay (background emission or spin-flip transition). The fast radiative component was 390 ps. Compared to the lifetime of QD ensemble in unpatterned GaAs of 1.23 ns [24], the enhanced spontaneous emission was manifested with the Purcell factor of 3. We also measured the lifetime of another QD (QD 2) spectrally far from the cavity mode and located inside the bandgap (Fig. 6(b,c)), which was
t
off = 5.3 ns (black line in Fig. 6(a)). The long lifetime of 5.3 ns is attributed to the [image:9.612.154.459.98.226.2]diminished density of states by the PhC bandgap [28].
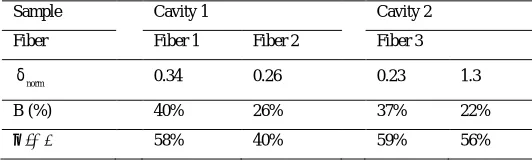
Table 1. Brightness and fiber coupling efficiencies with different QD-cavity system, microfiber, and detuning between QD and cavity mode.
Sample Cavity 1 Cavity 2
Fiber Fiber 1 Fiber 2 Fiber 3
dnorm 0.34 0.26 0.23 1.3
B (%) 40% 26% 37% 22%
η (%) 58% 40% 59% 56%
[image:9.612.172.438.507.588.2]brightness of 37% based on the fiber coupling efficiency of 59%, which are comparable values with those of the cavity 1 with the fiber 1. When we detuned the cavity resonance to
d
norm=
1.3
( dnorm= lQD- lcav Dlcav ,Dl
cavis linewidth of the cavity mode) by gasdeposition techniques [39], B was reduced to 22% with similar η of 56%. In this case, the β factor is expected to decrease due to the large detuning. As a result, we could collect consistent results and analyses for the different QD-cavity systems and microfibers.
5. Conclusion
Although we succeeded to transform 40% of the pump pulses into fiber-coupled single photons, there is still considerable room for improvement. First, the η of the SPS can be raised. There was some discrepancy between the highest η of the fabricated cavities (cavity 0) and the η of the bright SPS (cavity 1) due to the fluctuation of the η and the randomness of the QD-cavity coupling. For example, if we introduce strain tuning of the QD [40-42] for better spectral matching or site-controlled QDs [43] for deterministic spatial matching, the efficiency of QD-cavity coupling can be made higher and a QD can be coupled to a cavity with higher η. Second, the quasi-resonant excitation can selectively pump a p-shell of a single QD, which significantly decreases the off-resonant cavity feeding [5]. Accordingly, higher-density QD wafers can be utilized to increase the probability of a cavity having a bright QD inside. It will also greatly decrease the multiphoton probability due to suppression of unwanted excess carriers originating from above-band pump. Besides, if we adopt the deterministic positioning of photonic crystal cavity to a QD [44], we could obtain higher Purcell factor.
We emphasize that mean photon number of 0.4 was obtained directly into an optical fiber. Although the brightness of 40% is less than those of current bright SPSs, still it is competitive because our single photons are already coupled into an optical fiber and ready for long haul transmission. Furthermore, we could transfer 96% of the collected single photons to the single-mode optical fiber. Compared to the free-space SPSs which have subsequent losses of around 30% from the collection optics and fiber coupling, the practical brightness of this fiber-coupled SPS can be comparable to the bright free-space SPSs.
In summary, a bright fiber-coupled SPS based on a QD embedded in a PhC cavity was demonstrated with a high brightness of 40%. Exploiting the Fabry-Perot-like higher-order mode of the L13 PhC cavity, we achieved the phase-matched fiber coupling. As a result, a fiber coupling efficiency η of 89% was obtained from calculation. Experimentally, the η of the SPS was determined to be 58% by transmission measurements. We claim that the brightness of 40% could be achieved based on the elevated fiber coupling efficiency η. The Purcell enhancement was also verified by measuring the reduced lifetime of the QD exciton. Besides, we measured the brightness and η as we change the microfiber, the cavity, and the detuning between QD and cavity mode to check the consistency of our model.
Funding
This work was supported by the National Research Foundation of Korea (NRF) grant funded by the Korea government (MSIP) (NRF-2007-341-C00018, NRF-2014M3C1A3052567). Part of the work was supported by the State of Bavaria.
Acknowledgements