Water Technology Research Group
Trinity College, University of Dublin, Dublin 2 Ire land
AN EVALUATION OF THE FISHERIES POTENTIAL OF THE
AVOCA CATCHMENT
M
. S
ullivan
a
nd N.F.
G
ray
Water Technology Research
Technical Report: 9
Acknowledgement: The authors would like to thank the Central and Eastern
Fisheries Boards for their assistance during this study
© Water Techno logy Research
The information in this document may be freely disseminated on all media on
condition that copyright of the material is acknowledged and the source is fully
referenced and a link to the publication given.
First published September, 1992(1SBN 1-872220-10-X)
This e-version: Published by Tigroney Press on behalf of t he Water Technology
Research Group, Trinity College, University of Dublin.
August, 2017
INTRODUCTION
The distribution of trout in a rivers' course is primarily related to the obvious
topographical factors of gradient, width and in particular the nature-e of the river bed.
In the Avonmore-Avoca Catclunent most of the rivers are predominantly upland
erosional with the exception of the lower section of the Avoca River which is lowland
depositional. The geology and soils are major factors influencing the surface water
chemistry in the catchment. With regard to the mineralogy and geochemistry of the
rocks in the area, the dominating influence on the water chemistry and acidity is the
content of carbonates and weatherable silicates. Hormrng et al. (1990) developed a
simple classification of rocks based on a combination of earlier classifications produced
by Norton (1980) and Kimrit1burgh & Edtmrnds (1986) (Table 1). This classification, applied to the solid geology of the Avoca catchment indicates that large areas of the
north, central and south west areas of the catclunent are imderlain by granite rocks and
so have little or no neutralizing capacity. The surrmmding Ordovician slates, shales and
volcanics have a low to medium buffering capacity. Thus, on the basis of bedrock
geology, naturally-weakly acidic, low conductivity waters, sensitive to acidification, are
predicted to occur over much of the catclm1ent. Since predictions based solely on
bedrock geology have limitations, it would be more reliable if a consideration of soils
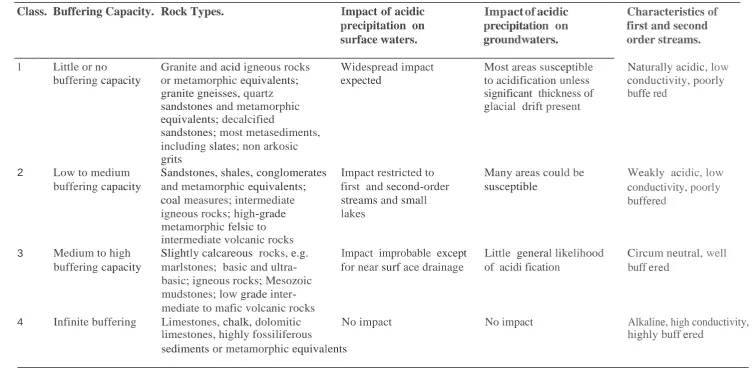
TABLE 1. The impact of acidic deposition on surface and groundwaters of areas underlain by rocks with different buffering capacities. (Hornung et al.,, 1990)
Class. Buffering Capacity. Rock Types. Impact of acidic precipitation on surface waters.
Imp act of acidic precipitation on groundwaters.
Characteristics of first and second order streams.
1 Little or no Granite and acid igneous rocks Widespread impact Most areas susceptible Naturally acidic, low
buffering capacity or metamorphic equivalents; expected to acidification unless conductivity, poorly
granite gneisses, quartz significant thickness of buffe red
sandstones and metamorphic glacial drift present
equivalents; decalcified
sandstones; most metasediments, including slates; non arkosic grits
2 Low to medium Sandstones, shales, conglomerates Impact restricted to Many areas could be Weakly acidic, low
buffering capacity and metamorphic equivalents; coal measures; intermediate
first and second-order streams and small
susceptible conductivity, poorly buffered
igneous rocks; high-grade lakes metamorphic felsic to
intermediate volcanic rocks
3 Medium to high Slightly calcareous rocks, e.g. Impact improbable except Little general likelihood Circum neutral, well
buffering capacity marlstones; basic and ultra -basic; igneous rocks; Mesozoic
for near surf ace drainage of acidi fication buff ered
mudstones; low grade inter- mediate to mafic volcanic rocks
4 Infinite buffering Limestones, chalk, dolomitic No impact No impact Alkaline, high conductivity,
limestones, highly fossiliferous highly buff ered
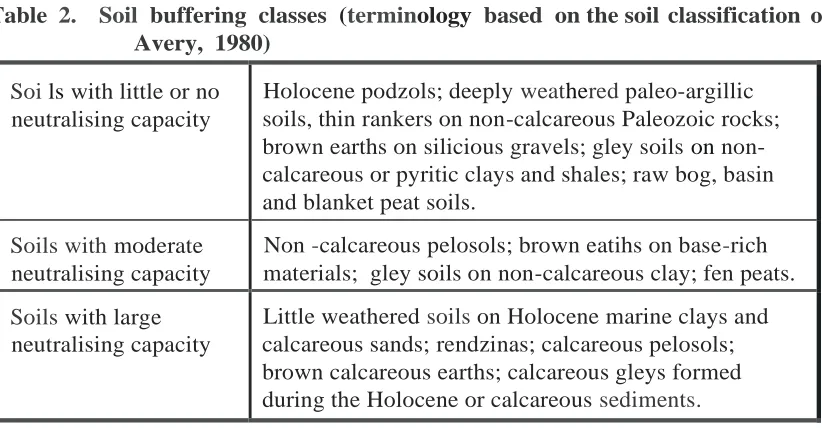
The acid neutralising capacity of soils is also large ly detennined by their content
of carbonate and weatherable silicate minerals, cation exchange capacity and base
saturation. These propetiies are dependant on the nature of the parent mate rial, age, and
weathering and leaching of the soil.
A number of classifications of soils have also been published. Avery (1980)
used the base status of subsoil horizons to classify soils on the basis of neutralizing
capacity.
Table 2. Soil buffering classes (terminology based on the soil classification of Avery, 1980)
Soi ls with little or no neutralising capacity
Holocene podzols; deeply weathered paleo-argillic soils, thin rankers on non-calcareous Paleozoic rocks; brown earths on silicious gravels; gley soils on non- calcareous or pyritic clays and shales; raw bog, basin and blanket peat soils.
Soils with moderate neutralising capacity
Non -calcareous pelosols; brown eatihs on base-rich materials; gley soils on non-calcareous clay; fen peats.
Soils with large neutralising capacity
Little weathered soils on Holocene marine clays and calcareous sands; rendzinas; calcareous pelosols; brown calcareous earths; calcareous gleys formed during the Holocene or calcareous sediments.
A broadly similar approach has been taken for the Avoca region but has been
simplified to give two classes of soils: acid soils with little or no neutralising capacity
and non-acid to weakly acidic soils with moderate to large neutralising capacity.
The soils associations which dominate the catchment and classified as acid, with
low neutralising capacity are the peaty podzols, brown podzolic soils and acid brown
[image:5.596.124.535.325.539.2]FIG.1
GEOLOGY OF THE AVOCA CATCHMENT
LJGranite Ordivician
. Diorite E2lQuartzite
FIG.1a SOIL ASSOCIATION OF CO. WICKLOW
of the base poor soil fanning materials derived fonn the acidic granite rocks, slates and
volcanics and the humid, cool climate.
These soil-rock combinations (Figs. 1 and la) predict the likely occurrence of
acidic, sensitive waters and possible changes in stream acidity with flow. Variations in
the stream water acidity may occur as a result of small scale variations in soils and
bedrock geology, these however are not shown on the scale of the maps here.
With the predominance of upland, high rainfall and thin low base status soils
based on granite bedrock, much of the catchment (approx. 16,455 ha.) is under
forestation. Coillte, a State forestry company owns the majority of the coniferous
forestry (Fig. 2).
Afforestation - Impact on Fisheries
There is strong evidence of links between fishery decline and afforestation. This
may be due to a combination of direct and indirect effects. Of these, increased acidity
of drainage waters together with elevation of toxic trace metal levels appear to be the
limiting factor on fisheries since acutely lethal toxic conditions have been shown to exist
(Conference on forests and Surface Water Acidification, Darlington, U.K. 1990).
Coniferous trees reach the banks of all the main tributaries at various locations
and enclose many of the minor rivers. Streams draining coniferous forests tend to be
more acidic and may have other effects upon fisheries unassociated with acidity.
F
I
G.2
FORESTRY OF THE AVOCA CATC
HM
ENT
• Planting to be felled by 2010
- Catchment boundary
...
...
lowering of the water table through evapo-transpiration and increased soil erosion due
to drainage practices. The latter can lead to stream bed sedimentation, and thus limit
benthic productivity and spawning areas. Trees filter out from the atmosphere increased
amow1ts of pollution - derived anions. These then drain through the soil and, if the soil
is rich in hydrogen and aluminium, will enter the stream accompanied by the latter
cations. High concentrations of aluminium in appropriate forms can damage the gills
and breathing apparatus of fish.
Since genuine concern exists in relation to the impact of forestry on fisheries,
including water acidification, guidelines have been laid down on aspects of forestry
practice which may impinge upon the physical quality of the water. For example, deep
ploughing must not take place within ten metres of any stream or watercourse or within
fifty metres in designated sensitive areas. Fertilizer must not be spread mechanically
within ten metres of any stream. No trees may be planted within five metres of any
stream and no conifers within ten metres in designated areas (Forest1y and Fisheries
Guidelines, 1991). These guidelines have not been strictly adhered to within the
catchment.
Economic Value
The net economic value of a fishery is taken to represent the loss in benefit to
society which would result if the fishery ceased to exist. There are many components
of net economic value including the value of a fishery to the owner, to the anglers and
to the local economy, as well as more intangible benefits to the well being of the
The fis heries industry in Ireland is projected to expand to net many lumdreds of
millions of potmds per year in revenue and in a much shorter time-frame than for
forestry.
OBJECTIVES
The aim of this study is to assess the overall potential of the catchment by:
a) Electrofishing discrete sites within the catchment (quantitatively and
qualitatively),
b) detem1ining the water quality at the respective sites in order to provide
infonnation on the physio-chemical suitability of the waterways to fish,
c) identifying, measuring, weighing, sexing and scaling of the fish to assess their
growth rates and condition,
MATERIALS AND METHODS
Survey sites were chosen on the basis of location within the catchment area to
provide an overview of the physical attributes, floral and famrnl spec ies present at each
site. A code number was assi gned to each site commencing at S1, the upland
Glenmalure River, to S11 in the low lying reaches of the Aughrim (Fig. 3). Due to an
appa rent pollution problem at one location, no electrofishing was carried out.
Physical survey data together with floral and fmmal observations were recorded
at each site. Macrophyte identification was carried out in situ, while water analysis and
invertebrate identification were carried out on rettm1 to the laboratory. A total of
thirteen parameters are used to assess the water quality. This wide variety of parameters
ensures that the water is assessed from many different perspectives. Photographs were
taken of several sites.
The time allocated to this survey was brief so quantitative electrofishing was
carried out at only two sites which reflected the norn1 for long chaimel sections.
Salmonid stocks within these zones were quantified using a depletion technique (Zippin,
1959). Nets were used to enclose the section while the estimate was in progress.
A semi-quantitative approach was also adopted to detennine fish composition.
A portable land-based 220V generator, with a converter tmit, was used as a power
source. The cathode, a metal plate was placed upstream and the anode, a metal framed
FIG. 3 The Avoca-Avonmore catchment showing site locations (Sl-Sll).
S1: Glenmalure (Grid Ref. T067 940) ; S2 : Goldmine Tributary (Grid Ref. T187 760)
S3: Moyne Tributary (Grid Ref . T031 802) ; S4: Moyne River - Sandyford Bridge (Grid Re f. T035 790) S5: East Avoca Tributary (Grid Ref. T208 814); S6: East Avoca Tributary - Handweavers (Grid Ref. T211 802) S7: East Avoca Tributary (Grid Ref. T212 788); S8: West Avoca Tributary (Grid Re f. T218 739)
S9: Avoca River - Upstream of 1.F.I. (Grid Ref. T219 748);
Sl 0: Avoca River - Downstream of I.F .I. (Grid Ref. T299 745) Sl 1 : Aughrim River (Grid Ref. Tl 72 781)
L. Ouler
L Nahanagan
CO. WICKLO W /
\
/ CO. WEXFO RD 5 KM
S1 Glenmalure (Grid Ref. T067 940)
The Glenmalure River is a fast-flowing upland stream which rises in Table
Mow1tain, at 2,302 feet. It feeds into the Avonbeg River.
The site chosen was a 25m stretch which originated at a natural barrier of a riffle
sloping into a pool, under a wooden fo otbridge, width 6.7111. The substrate was strewn
with granite rocks, with sparse cover of aquatic mosses and algae. This upland section
of the river was in fact quite deficient in aquatic plant life. The centre stretch measured
8.8m wide and the final width where the stop net was set, broadened to 10.7m.
Shelter on both banks was provided by overhanging trees, furze and grass. The
in-egular hydrology at this upper catchment site is augmented by the tmderlying
imperious rocks and is prone to flash floods or spates. See Plates 1 and 2.
S2 Goldmine Tributary
(Grid Ref. T187 760)
A comparable low lying
stretch of 25111 was fished from Sm
upstream of the bridge at Valley
Hotel. This site provided a soft
riffle with sheltered pools tmder a
double-arched bridge. Flow was
moderate. Eroding stones and
gravel formed the principle substrate
components with Apium being the
dominant macrophyte and aquatic
mosses present instream. Dense over
-hanging bank vegetation was
prominent on the north-east bank
PLATE 4. Moyne Tributary
S 3 Moyne Tributary
(Grid Ref. T031 802)
Stop nets were used to qualitatively electrofish a 60111 stretch of this narrow chatmel, having a
maximum width of 6111. Flow rate was slow over
a partially silted sub- stratum, with 30% cover
of Ranunculus. The
marginal flora was typical
of lowland streams with
Apium, Oenanthe, Berula,
Caltha, Juneus, Carex,
and various grasses.
PLAT E 5. Moyne River
S4 Moyne River - Sandyford
Bridge (Grid Ref. T035 790)
As with S3, the main
chaimel of the Mayne River had a
slow to moderate flow rate.
Approximately 50% of the silty-
stony substrate supported dense
beds of flowering Ranunculus.
Similar diversity of bank cover but
with plenty of mature over-hanging
S5 - East Avoca Tributary (Grid Ref T 208 814)
This small stony tributary on the east bank of the Avoca River reaches back into
the mines. It proved to be devoid of instream vegetation, invertebrates or fish life.
S6 Avoca Tributary - Avoca Hand-
weavers (Grid Ref. T211 802)
Due south, but also on the east
bank of the Avoca River, this
short tributary is more
productive. Aquatic mosses
were present instream with
some filamentous algae also
present. Bank cover was
relatively extensive but not
excluding a significant level of
light from the stream bed as
evidenced by the dense mats of
aquatic mosses on the
substrate. Bushes and fems
aided in providing shade,
shelter and ' good lies' along
this stretch.
PLATE 6. East Avoca Tributary
PLATE 7. East Avoca Tributary
S7 Avoca Tributary, East Bank
(Grid Ref. T212 788)
This narrow small tributary
flows north westerly through
productive agticultural land into the
Avoca River. A good gradient
generates a moderate to fast flow over
a vatied substrate of rocks, stones,
gravel and silt. Bank cover is
extensive forming a canopy over the
PLATE 8. West Avoca Tributary
S8 West Avoca Tributary
(Grid Ref. T218 739)
A low lying shallow stream on the west bank of the Avoca River opposite Irish Fertilizer Industries Ltd. Gravel and loose stones were the main substrate types in the riffle areas. Silt and sand tended to dominate the glides and pools. The low flow regime of this stream would probably render it tmsuitable for salmonids
during a hot summer period.
Aquatic mosses present on a small percentage of the permanent substratum. Bank cover is extensive but not obtrusive with some
filamentous algae and in-
frequent clumps of Callitriche.
S9 Avoca River at Shelton Abbey, Upstream of I.F.I. (Grid Ref. T219 748)
This broad section of the Avoca River is lowland depositional with a
S 10 Avoca River, Downstream of I.F.I. (Grid Ref T229 745)
Optimum low flow conditions again allowed restricted elect rofishing along the
east bank of the river. The loose gravel substrate extends to this site and remains
extensively coated with algae, holding no other mac ro-flora. Bank vegetation comprised
of grasses with some semi-mature trees.
Su Aughrim River (Grid Ref. 172 781)
The Aughrim River flows east-south-eastwards before converging with the Avoca
River at Woodenbridge (Grid Ref. T191 770). It is the life source of established fish
farms located along its banks. Its cha,rnel width is on average 10m, with riffles, glides
and pools. The composition of the substrate varied from boulders to fine gravels. The
river carried a vigorous submerged flora dominated by flowering Ranunculus,
Potamogeton and Callitriche sp. The degree of instream cover afforded by the
encroachment of the bank vegetation and the significant level of submerged aquatic
)
Results are expressed as minimum densities (Crisp et al., 1974). The minimum
density represents the total number of fish captured divided by the area (m 2 sampled.
It is likely that 50% of the total fish numbers in any given stretch are captured using the
techniques outlin ed abo ve. Therefore, a minimum density in this survey under-es timates
actual fish densities but does provide an excellent relative meas urement.
The condition factor, K, is calculated from a formula derived from the length-
weight relationship thus:
K = approx. 1.0 = 100 x ·weight in grams
Length3 in centimetres
The average trout has K equal to 1; if K is less than 1, the fish is in poor
condition since it weighs less than expected; if the fish is fat, its weight will be more
than expected and K will be more than 1. Thus, K , the condition factor, is a
measurement of the individual fish's well-being, its fatness and the state of its gonads,
K is high in mature fish with ripe gonads and low in spent fish.
A sample of scales were removed from a representative selection of measured
brown trout (Salmo trutta L.) and a proportion of fish taken for the examination of
stomach contents and weight. Age calculations were made and when combined with
length frequency disttibution data provided an overview of the stmcture in the individual
subcatchments.
Populations of eels , loach or gudgeon were non-existent throughout the survey,
•
The Glenmalure River, S1
RESULTS
This river, sampled during spate and low flow conditions showed a pH range of
5.7 to 5.0 respectively. It had very little calcium in solution (5.0 mg/1 CaCO), was of
low conductivity (mean 34.4 µS/cm) and had an average total alkalinity of -0.02 milli
equiv/I (Table 3). Nutrients levels recorded were low; total phosphate 0.02 mg/1 P and
Nitrate + Nitrate 0.26 mg/1 N. The water colour was high (120 Hazen wuts) in tlus
upland region of peaty podzols. Invertebrate life was reasonably diverse but overall had
a low productivity, with Tricopteran larvae being particularly scarce (Table 4).
The brown trout at tlus location were generally small, slow growing fish in good
condition (mean K = 1.42). Tables 5 and 7 display growth rates and condition factor
data. Trout stock density was 0.16/m2
Goldmine River S,
The pH of the low lying Goldmine River contrasted with the acidic nature of the
Glemnalure waters in that it had a more neutral pH of 6.9. The conductivity was
elevated to 146.0 µS/cm and there was a slight increase of 2.0mg/1 in the concentration
of calcium present. The nutrient levels indicated some degree of enrichment with an
increased nitrate+ 1utrite reading of 4.75mg/1 N and total phosphate of 0.03mg/l P. The
invertebrate life was diverse and quite abw1dant.
The fish captured had the slowest growth rates witnessed within the catchment,
with three year olds on average reading only 13.7cm. Trout stock density in the river
was 0.54/m2 (Table 6).
Length frequency distributions of the fish from sites S1 and S2 show in figures
4 and 5 that 60 and 45% of the fish caught in the respective rivers were three years of
TABLE 3. Water Chemistry of the Avoca Catchment, June 1991
S1 S2 S3
s4
Sss6
S1 Ss S9 S10 SnLow Flow
Flood
Conductivity (uS/cm) at 20°c 36.1 32.6 146 94.1 95.3 199
0
165.9 290 296 129.5 254.6 120
Colour (Hazen units) 120 140 40 20 20 15 15 40 45 25 30 45
Turbidity N.T.U. 6.0 8.7 3.8 4.3 4.5 46.0 4.5 8.0 14.2 4.3 4.3 3.8
Total Hardness (mg/I CaC0 3) 14.0 14 .0 16.0 22.0 22.0 - 46.0 90.0 102.0 24.0 24.0 42.0
Alkalinity (milli equiv/I) -0.022 -0.014 0.10 .093 .098 - 0.5 2.1 1.8 - - 1.1
Total Phosphorus (mg/I P) .019 .026 .030 .018 .026 - .056 .739 .096 .059 .034 .011
Molybdate Reactive P. .001 .002 .029 .012 .013 - .050 .227 .091 .043 .029 .008
Total Kjeldahl Nitrogen (mg/I N) .603 .585 .438 .936 .924 - 1.365 3.296 .804 .462 42.994 .632
Nitrite + Nitrate (mg/I N) .256 .212 4.746 .898 1.016 - 4.718 <0.001 4.821 2.800 <0.001 2.890
Temperature °C 14.4 14.7 14.0 14.9 14.8 14.6 14.4 14.4 14.5 14.2 14.2 14.0
Dissolved Oxygen (mg/I 02) 1 0.6 10.8 10.7 11.3 11.2 10.5 9.5 3.8 9.3 10.6 10.1 10.5
Calcium (mg/I CaC0 3) 5.0 5.0 7.0 12.0 12.0 - 55.0 55.0 66.0 7.0 7.0 60.0
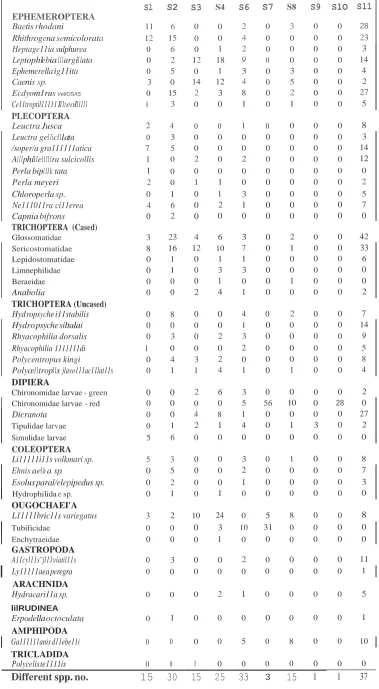
TABLE 4. Invertebrate analysis of the Avoca catchment, June 1992. Sl
EPHEMEROPTERA
Baetis rhodani 11 S2 6 S3 0 S4 0 S6 2 S7 0 S8 3 S9 0 SlO 0 Sll 28 Rhithrogena semicolorata 12 15 0 0 4 0 0 0 0 23 Heptage11ia sulphurea 0 6 0 1 2 0 0 0 0 3
Leptophlebia111argi11ata 0 2 12 18 9 0 0 0 0 14
Ephemerella ig11ita 0 5 0 1 3 0 3 0 0 4
Caenis sp. 3 0 14 12 4 0 5 0 0 2
Ecdyom1rus VellOSIIS 0 15 2 3 8 0 2 0 0 27
Ce11troptil11111 l11teol11111 0 3 0 0 1 0 1 0 0 5 PLECOPTERA
Leuctra Jusca 2 4 0 0 1 0 0 0 0 8
Leuctra ge11ic11lata 0 3 0 0 0 0 0 0 0 3
/soper/a gra111111atica 7 5 0 0 0 0 0 0 0 14
A111phi11e11111ra sulcicollis 1 0 2 0 2 0 0 0 0 12
Perla bip1111c tata 1 0 0 0 0 0 0 0 0 0
Perla meyeri 2 0 1 1 0 0 0 0 0 2
Chloroperla sp. 0 1 0 1 3 0 0 0 0 5
Ne111011ra ci11erea 4 6 0 2 1 0 0 0 0 7
Capnia bifrons 0 2 0 0 0 0 0 0 0 0
TRICHOPTERA (Cased)
Glossomatidae 3 23 4 6 3 0 2 0 0 42 Sericostomatidae 8 16 12 10 7 0 1 0 0 33
Lepidostomatidae 0 1 0 1 1 0 0 0 0 6
Limnephilidae 0 1 0 3 3 0 0 0 0 0
Beraeidae 0 0 0 1 0 0 1 0 0 0
Anabolia 0 0 2 4 1 0 0 0 0 2
TRICHOPTERA (Uncased)
Hyd ropsyche i11stabilis 0 8 0 0 4 0 2 0 0 7
Hydro psyche siltalai 0 0 0 0 1 0 0 0 0 14
Rhyacophilia dorsalis 0 3 0 2 3 0 0 0 0 9
Rhyacophilia 1111111di 1 0 0 0 2 0 0 0 0 5
Polycentropus kingi 0 4 3 2 0 0 0 0 0 8
Polyce11trop11s jlavo111ac11lat11s 0 1 1 4 1 0 1 0 0 4
DIPIERA
Chironomidae larvae - green 0 0 2 6 3 0 0 0 0 2 Chironomidae larvae - red 0 0 0 0 5 56 10 0 28 0
Dicranota 0 0 4 8 1 0 0 0 0 27
Tipulidae larvae 0 1 2 1 4 0 1 3 0 2
Simulidae larvae 5 6 0 0 0 0 0 0 0 0
COLEOPTERA
Li11111i11s volkmari sp. 5 3 0 0 3 0 1 0 0 8
Ehnis ae11e a sp. 0 5 0 0 2 0 0 0 0 7
Esolus paral/elepipedus sp. 0 2 0 0 1 0 0 0 0 3
Hydrophilida e sp. 0 1 0 1 0 0 0 0 0 0 OUGOCHAEI'A
L11111bric11s variegatus 3 2 10 24 0 5 8 0 0 8
Tubificidae 0 0 0 3 10 31 0 0 0 0
Enchytraeidae 0 0 0 1 0 0 0 0 0 0 GASTROPODA
A11cyl11s"jl11viatil11s 0 3 0 0 2 0 0 0 0 11
Ly11111aea peregra 0 0 0 0 0 0 0 0 0 1
ARACHNIDA
Hydracari11a sp. 0 0 0 2 1 0 0 0 0 5
lilRUDINEA
Erpodella octoculata 0 1 0 0 0 0 0 0 0 1 AMPHIPODA
Ga111111anis d11ebe11i 0 0 0 0 5 0 8 0 0 10
TRICLADIDA
Polycelis te1111is 0 0 1 0 0 0 0 0 0 0
[image:23.596.134.513.67.756.2]!Length (cm) n
(Range) TABLE 5. Backcalculated growth rates of brown trout (Sal.mo trutta L.), June 1991.
SITE GRID REF. LI l2 L3 IA LS
Sl : Glenrnalure T067 940 5.3 20 11.2 20 13.3 18 17.1 6
(4.0-6.3) (9.2-13.0) (13.0-16.7) (15.0-18.5)
S2 : Goldmine T187 760 4.9
(4.3-6 .1)
20 9.8
(8.1-12.4)
20 13.7 19
(11.7-16.7)
16.4 12 (15.1 -18 .5)
19.1 3 (18.4-19.8)
S3: Moyne T031 802 6.7 5 13.4 5 18.8 5 21.3 1
(6.0-7.1) (12.2-14.4) (17.6-19.6) (21.3)
S4 : Sandyfor d T035 790 7.0 7 14.3 7 19.5 7 23.1 4
(6.3 -7.4) (12.9-15.6) (16.5 -20.5) (21. 2-25.2)
S6 : Handweavers T211 802 5.8 3
(5.5-6.1)
11.5
(11.1-12.0)
3 15.0
(14.7-17.5)
3 17.0 3
(17.1-17.5)
18.8 1 (18.8)
S8 : West Avoca trib. T218 739 5.1 8 11.7 8 15.2 2 17.2 1
(4.0-5.9) (10.6-12.7) (15.0-15.3) (17.2)
S ll :Aughrim T172 781 7.2
(6.4 -8.0)
20 15.2
(12.3 -17. 1)
19 19.5
(17.0-22.0)
11 23.8 1
(23 .8)
26.5 1
[image:24.842.110.699.132.361.2](26.5)
TABLE 6. Brown trout population estimates and densities.
SITE DATE AREA F1SHED (m1. ) POP. ESTIMATE 95%C.I. MIN. DENSITY
PER mz.
S l : Glenrnalure 25-06-91 218.3 35 5 0.16
S2 : Goldmine 26-06-91 151.7 81 5 0.54
S3 : Moyne 26-06-91 180.0 One fishing only 0.04
[image:24.842.118.701.430.498.2]TABLE 7. Stomach contents of fish in the Glenmalure River, June 1991.
Length (cm)
Wt.
(gr.)
Sex % Stomach
Full
K Chief Food Other Food
10.6 16.9 F 25 1.42 - Coleoptera, Ephemeroptean larvae
10.7 20.0 M 25 1.64 - Trichopteran larvae, 1 ant
11.0 20.5 F 25 1.54 - Ephemeropte ran larvae
11.4 23.2 F 100 1.57 Terrstrial flies
-12.2 26.3 F 25 1.45 - Terrestrial flies, Trichopteran larvae
12.3 25.3 M 50 1.36 Coleopteran larvae Coleoptera-adult, Trichopteran larvae
12.4 29.3 F 25 1.54 - Terrestrial fly, Ephemeropteran larvae
12.6 28.9 F 100 1.44 Terrestrial flies Ephemeropteran larvae, Coleopteran adult
12.8 29.6 M 100 1.41 Winged insects Trichopteran larvae
13.1 30.4 F 50 1.35 - Winged insects, Ephemeropteran larvae
13.2 31.9 M 25 1.39 - Winged Ephemeropterans, Plecopteran
13.4 34.9 F 50 1.45 Winged insects
-13.6 37.8 M 25 1.50 - Ephemeropteran larvae, Simulium larvae
14.8 43.4 M 100 1.34 Coleopteran larvae Coleopteran-adult, Trichopterans,
Ephemeropterans, Terrestrial flies
14.9 45.1 F 0 1.36 - -
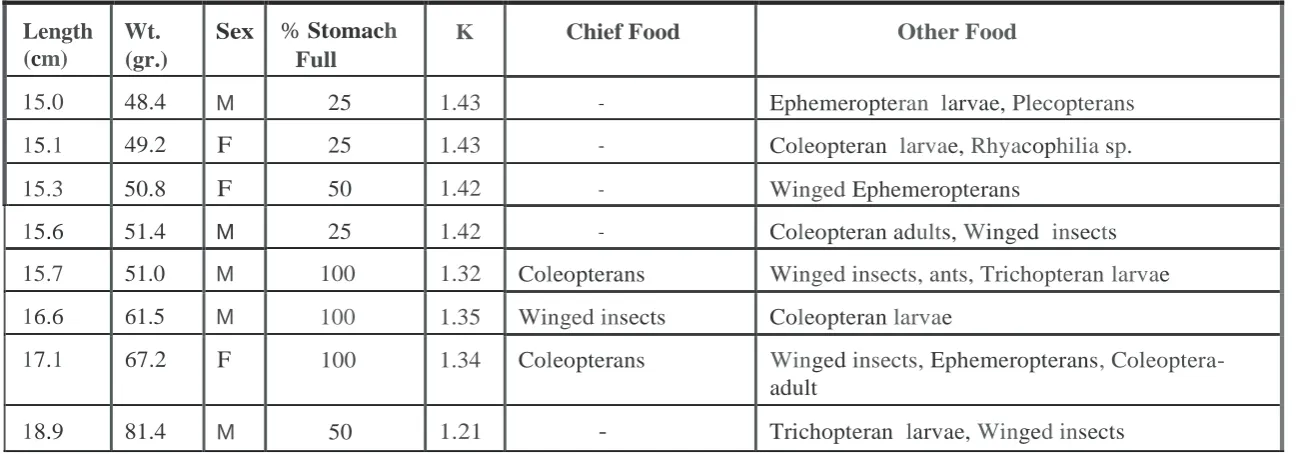
[image:25.842.93.746.123.511.2]Table 7. Contd.
Length (cm)
Wt. (gr.)
Sex % Stomach
Full
K Chief Food Other Food
15.0 48.4 M 25 1.43 - Ephemeropteran larvae, Plecopterans
15.1 49.2 F 25 1.43 - Coleopteran larvae, Rhyacophilia sp.
15.3 50.8 F 50 1.42 - Winged Ephemeropterans
15.6 51.4 M 25 1.42 - Coleopteran adults, Winged insects
15.7 51.0 M 100 1.32 Coleopterans Winged insects, ants, Trichopteran larvae
16.6 61.5 M 100 1.35 Winged insects Coleopteran larvae
17.1 67.2 F 100 1.34 Coleopterans Winged insects, Ephemeropterans, Coleoptera-
adult
The Moyne Subcatchment, S 3 and S,1
The general water chemistry of this low lying system also indicated less acidic
conditions with pH values averaging 6.7, alkalinity 0.10 milli equiv/I, and having a
mean conductivity of 94.7 µS/cm. The calcium levels in this locality were 12.0 mg/1
Ca, with the water hardness increasing to 22.0 mg/1 CaC03• Water colour was greatly
reduced to 20 Hazen units and nutrient levels were low.
Both low grade channels fis hed were of poor gradient with the absence of
instream diversity and suitable substrate.
Invertebrate life was restricted principally to btur owers and species adapted to
slow-flow conditions. The dominant Ephemeropterans present generally being
recognised as sluggish movers and poor swimmers. The caenidae nymphs present were
burrowers and common in silty conditions, and the Leptophlebildae species present were
typical of slow-flowing, less productive waters. Lumbricus vargiatus which lives in soft
substrate conditions was also abtmdant. A low fish stock density of 0.039/m 2 was
recorded with no fry observed. The brown trout captured had reasonable good growth
rates (Table 5).
Tigroney Stream, S5
This tmproductive stream which nms directly tlu·oug h the mines, was devoid of
visible floral fatmal or fish life, and had extreme pH of 3.16. Other conspicuous
parameter values included a conductivity of 1990 µS/cm and excessively turbid
conditions of 46.0 NTU which arose from the accumulation of suspended solids after
the recent rainfall.
East Avoca Tributary, S7
A clu·onic agricultural pollution problem in this short tributary also ensured that
no fish were present. The invertebrate fauna/pollution relationship manifested itself b y
poor species diversity and the dominance of the least sensitive invertebrates, red
chironomids and tubificids. Greyish coloured slimy colonies of micro-organisms
collectively called 'sewage ftm gus' were prevalent downstream from the entry of what
The stream was highly enriched with a total phosphonis loading of 0.74 mg/1 P and total
kjeldahl nitrogen of 3.93 mg/1 N, in a partially deoxygenated state of 3.8 mg/1 02• The
calcium levels which increased to 55 mg/1 Ca con-elate with a hardness increase to 90.0
mg/1 CaC03 making this mode rately soft water.
East Avoca tributary at Avoca Handweavers, S6
This intervening stream between the latter two inanimate veins contained fish
life. Very slow-growing, four year old trout at this site measured on average 17.0 cm.
Some enrichment was evident from the algae encroaching the stones but it appeared to
be tmder control. Total phosphate culminated 0.06 mg/I P and Nitrate + Nitrite 4.72
mg/1 N. Both colour and turbidity readings were low. Tolerant invertebrate species
were present including Tubificidae, but both sensitive ephemeropterans and plecopterans
were also noted. The introduction of Gammarus duebeni was accompanied by an
increase in hardness and calcium.
West Avoca Tributary, opposite I.F.I., S8
Gammarus deubeni was also present in this alkaline Ordovician stream, flowing
eastwardly into the Avoca River. Calcium and hardness values were 66.0 mg/1 and
102.0 mg/I CaC03 respectively. An unstable substrate which was primarily composed
of gravel over a soft silty bed, accompanied elevated tmbidity readings (14.2 NTU). A
total phosphate reading of 0.10 mg/I P and Nitrate + Nitrite of 4.82 indicated some
enrichment in thE: system. It is therefore not surprising that the Plecopterans were
eliminated and many other sensitive invertebrates being poorly represented, i.e.
Ephemeropterans and the Trichopterans. In fact the dominant species were the much
more tolerant Chironomids. Despite the enrichment, some fish were captured at this site
and through back-calculation again proved to be slow-growing fish, with a four year old
reaching 17.2cm.
Avoca River, S9 and S10
No fish were captured at either of these locations sited downstream of the mines.
The invertebrate life along this stretch was totally restricted to the more tolerant
Site S10 , downstream of I.F.I., is also subject to the ammonia loading from the
industry's disc harge . This ab m ptly elevates the pH from being acidic to extremely
alkaline (5.9 - 8.6). T he Total Kjeldahl Nitrogen goes from being 0.46 mg/1 N upstream
to 42.99 mg/1 N downstream.
Aughrim River, S11
T his alk alin e river held quite a diversity of life. Nutrient levels were low; Total
phosphate 0.01 mg/1 P and Nitrate+ Nitrite 2.89 mg/1 N. Calcium values of 60.0 mg/1
Ca accompanied the introduction of Gastropods, both Ancylus ftuviatilus and Lymnaea
peregra. Overall the invertebrates were found to be the most abtmdant and diverse in
this subcatchment (Tabl e 4).
The fish caught were all in good condition (mean K = 1.48) and had the fastest
growth rate witnessed in the catchment. Four year old trout grew to 23.8 cm.
FIS H STOMAC H CONTENTS
The distinguishing characteristic of the food of the Glenmalure trout was the
dominance of winged insects. Very few of these were of aquatic origin. They were
practically all terrestrial insects which had blown on to the water from the bushes
bordering the river, and had greatly augmented the food supply of the trout. This high
incidence of terrestrial insects ensured that deficiencies in the stream bed fauna were
offset by allochthonous inputs. Insect larvae were also important, belonging mostly to
the orders Ephemeroptera, Coleoptera and Trichoptera (Table 7).
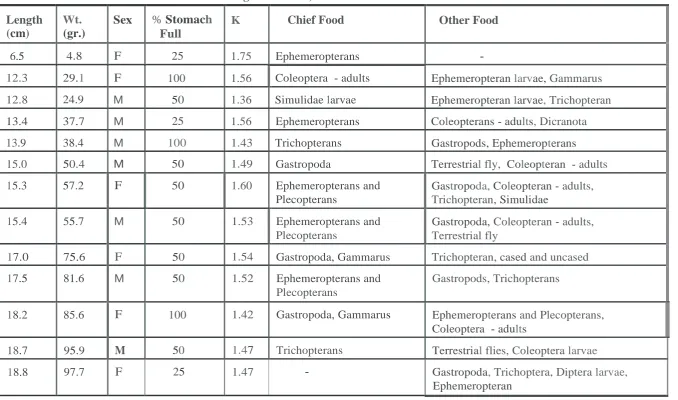
In contrast, there was a relative insignificance of winged insects in the stomach
contents of the Aughrim fish. In no instance did winged insects form the main
constituent of the food, which was composed almost entirely of bottom-living organisms.
These consisted mainly of various kinds of insect larvae, adult Coleopterans, together
with Gastropods and the amphipod, Gammarus. The larvae of caddis flies were the
most impotiant food constituent of 20% of the fish captured. The ephemeropteran and
TABLE 8. Stomach contents of fish in the Aughrim River, June 1991.
Length
(cm)
Wt.
(gr.)
Sex % Stomach
Full
K Chief Food Other Food
6.5 4.8 F 25 1.75 Ephemeropterans
-12.3 29.1 F 100 1.56 Coleoptera - adults Ephemeropteran larvae, Gammarus
12.8 24.9 M 50 1.36 Simulidae larvae Ephemeropteran larvae, Trichopteran
13.4 37.7 M 25 1.56 Ephemeropterans Coleopterans - adults, Dicranota
13.9 38.4 M 100 1.43 Trichopterans Gastropods, Ephemeropterans
15.0 50.4 M 50 1.49 Gastropoda Terrestrial fly, Coleopteran - adults
15.3 57.2 F 50 1.60 Ephemeropterans and
Plecopterans
Gastropoda, Coleopteran - adults, Trichopteran, Simulidae
15.4 55.7 M 50 1.53 Ephemeropterans and
Plecopterans
Gastropoda, Coleopteran - adults, Terrestrial fly
17.0 75.6 F 50 1.54 Gastropoda, Gammarus Trichopteran, cased and uncased
17.5 81.6 M 50 1.52 Ephemeropterans and
Plecopterans
Gastropods, Trichopterans
18.2 85.6 F 100 1.42 Gastropoda, Gammarus Ephemeropterans and Plecopterans,
Coleoptera - adults
18.7 95.9 M 50 1.47 Trichopterans Terrestrial flies, Coleoptera larvae
18.8 97.7 F 25 1.47 - Gastropoda, Trichoptera, Diptera larvae,
[image:30.842.83.762.124.524.2]Table 8 Contd.
Length (cm)
Wt. (gr.)
Sex % Stomach
Full
K Chief Food Other Food
19.6 100.7 F 100 1.34 Coleoptera and
Ephemeropteran adults
Gastropods, Trichoptera,
Coleoptera - adults
19.9 115.7 F 100 1.47 Trichopterans Terrestrial flies, Coleopteran-larvae,
Winged and larvae, Diptera
19.9 112.3 M 50 1.43 Gastropods and Simulium Trichopterans, Ephemeropterans and
Plecopterans, Terrestrial fly
20.6 129.7 F 100 1.48 Trichopterans Trichopterans, Simulidae
20.9 133.8 M 100 1.47 Fish fry Coleopterans - adult, Ephemeropterans
and Plecopterans, Terrestrial fly,
Simulidae, Gastropoda
21.3 137.8 M 50 1.43 Gastropoda, Trichopterans Ephemeropterans and Plecopterans
DISCUSSION
The late Dr. Went in his essay "A Lost Irish Salmon River" (1979) has
chronicled the demise of the Ovoca (Avoca) River as a salmon fishery. He quotes
Mason who wrote, between 1814 and 1819, that "About thirty years ago the Avoca was
remarkable for the great quantity of salmon it produced ... the mines situated on its
banks have entirely destroyed the fish from thence to the sea, a distance of eight miles,
and the salmon which attempt to nm up in the spawning season are frequently taken out
dead or almost in a torpid state".
This remains the status quo with brown trout (Salmo trutta L.) the only species
recorded from the electrofished sites within the catchment. No salmon were captured
during this brief survey, through a qualitative study of the catchment in 1988 confinned
the successful numing of salmon to at least one of the tributaries (E.R.F.B., 1988). A
fomock (2 year+ old sea trout) measm-ing 25cm was also captured upstream of
Woodenbridge in 1988, and since then a number of mature salmon have been recovered
dead from the lower section of the river between sites S9 and S10 •
The acidic waters of the Glenmalure River, de1ived from granitic rock produce
small, very slow-growing fish. The largest fish taken was a mature four year old male,
weighing 81.4 grams and measuring only 18.9cm in length. The same aged fish in the
Aughrim River, at S9, flowing over Ordovician rock, showed reasonable growth at
23.8cm. From a carboniferous limestone region, in n01ih Co. Wicklow, a fast-growing
four year old brown trout, taken from the River Liffey, at Straffan, measured 29.7cm
(Fig. 7), (Went and Frost, 1942).
Similarly, the limestone waters of the Little Brosna River, in Co. Offaly
produced very fast growing trout measuring 38.7cm in their fornth year. Between the
two extremes of very slow (Glenmalure River L4 = 18.9cm) and very fast (Little Brosna
River, L4 = 38.7cm) growth rates, it is evident that fish from limestone rich waters can
have a 50% better growth rate in four years than fish from limestone deficient waters.
,
than fish from more productive limestone rivers.
Upstream of Straffan in the River Liffey, at Ballysmuttan, where the river is
tmderlain by granite, the slow growth pattern of brown trout is simila r to that fmmd in the Avonbeg and Goldmine Rivers (Fig. 8).
This range of growth rates can be attributed to not only the geological influences, but also to the speed of the current, the depth of the water, the presence or absence of pools, the amotmt of shade and shelter provided by weeds in the water, vegetation on the bank, and also variations in the level of the water.
These factors are diverse throughout the Avoca catchment, and hence the varied growth patterns (Table 5). Looking closer at the growth rates of the quantitatively fished rivers, S1 and S2, (Figs. 8 and 9), it is apparent that the fish grew best during their
first two years. The rates fall markedly in their third year perhaps due to the onset of
maturity and continue to be very low thereafter. Comparing specific growth rates of
brown trout from four different locations (Fig. 7), the rates generally decrease as the fish grow older, so that the fish grow at the highest rate dttring the first or second year of
life and after that they grow less rapidly with each year, but this decrease in growth rate becomes less marked as the fish grow older.
The attainment of maturity tends to retard growth (Southern, 1952). The decrease in the average annual rate of growth of the fish which are spawning can be explained since the increase in the size of the gonads uses up food material which might otherwise have been incorporated into more permanent parts of the body. Behaviour
associated with spawning, such as migration upstream and constmction of redds uses up
much energy and this must be derived from the food eaten or from food reserves in the body. This ripening of the gonads and spawning reduces the ammmt of food which is available for growth.
60
KEY ,--a 10.0 - 12.9 1111 13.0 - 15.9
D16.0 - 18.9
,...._,. . L2
t----1<--. - -t -LJ --.u
45 .-,KE=v-,---,
a
10.o- 12.9 1111 n .o - 15 .9
0 1 6.0 -18.9
illl! 19 .0 - 21.9
River Llffi=S1raffan
River Llffey - Ballysmutlon
River Avonbeg - Glenmalure
River Goldmine
·•·
-a-*
35
RiverLlfStraffan River Llffey - Ballysmutton
30
-a-River Avonbeg- Glenmalure River
·•·
Goldmine*
25
10
LENGTH FREQUENCY DISTRIBUTION
Glenmalure river, June 1991 Goldmine river, June 1991
0
7 0
60
50
>u
-40
o>
30
20
10
10 15 20 25
>----*----<,_L2_,LJ
t---M---1 L4
01-- 50
40
10
5,_ 10, _1.5'--- - -2'0'--- - -5'2,
0
LENGTHINTERVAL(CM)
FIG/4 Length-frequency distribution of brown trout
in the Glenmalure river (20 fish).
LENGTHINTERVAL(CM)
FIG.5 Length-frequency distribution of brown trout
in the Goldmine river (20 fish).
The horizontal lines indicate length range of trout at the end of succesive growing seasons.
X = Mean length.
350
300
250
100
50
SPECIFIC GROWTH RATE
MEAN GROWTH RATE
2 3
AGE IN YEARS
LI L2 L3 YEAR
IA LS
FIG.6Annual average specific growth rates of brown trout. River Liffey data from Went, & Frost (1942) .
2 3 4 5 6 7 8 9 10 11 12 13 14 15 16 17 18 19 20 FISH NO.
FIG.8 Growth patterns of brown trout taken from the Glenmalure river, June, 1991.
KEY: • Ll II L2 II L3 Im L4 kJ LS f:fo + GROWTH
2 3 4 5 6 7 8 9 10 11 12 13 14 15 16 17 18 19 20 FISH NO.
catchment was observed in the Goldmine tributary, this may in part be due to the smallness of the stream and the high stock density witnessed therein. Plate 9 shows the
differe nce in size of 5 year old trout from the Goldmine and Aughrim River.
A low fish stock density of 0.03/m2
was recorded in the Moyne subcatchm ent
and no fry observed. Factors which may have accotmted for this include the appa rent lack of spawning gravels and the danger of the extensive growths of Ranunculus
becoming more luxuriant (during the summer months) would limit fish production and many affect oxygen levels. The silt load on the bed of the river would also be an inhibitory factor for salmonids, especially the early life stages.
Gammarus , which was absent from much of the soft water catchment were
frequently eaten , often in considerable numbers, by fish in the Aughrim River. Sutcliffe (1967) discusses the absence of Gammarus duebeni from a number of Co. Wicklow
streams of low mineral content e.g. the Avonmore, and suggests this may be due to lack
of sodium. There is also some evidence that several invertebrates are limited by
potassium or sodium rather than calcium (Sutcliffe and Hildrew, 1989). The absence
of Asellus as well as Gammarus was noted in all of the catchment rivers of very low
electrical conductivity. Lackey (1938) fotmd Gammarus species in two streams with pH
value of 2.2 and 3.2 respectively. This would indicate that the scarcity of this species within the catchment may be correlated with low nut1ient content, rather than hydrogen-
ion content. Gastropods were not to be fotmd in the stomach contents of the Avonbeg fish but were often the chief food in the diet of the brown trout caught in the Aughrim
River. Ma.can and Cooper (1949) define 15 freshwater gastropods as hard water species
ordinarily absent where there is less than approximately 20 mg/1 of calcium as Ca.
It appears then from the diet of the fish in both rivers that the brown trout is an
w1specialized carnivore feeding on what is available in the smTotmding environment, i.e.
it is very much of an opporttmistic feeder. There is a close but not exact
con-espondence between the list of invertebrates present in the stomachs and in the benthic
fauna. The differences in diet can therefore be associated with the relative abm1dance of the
different insects in the fatma at the two sites examin ed. Surface feeding on terrestrial
PLATE 9. Five year old brown trout from the Goldmine and Aughrim rivers measuring 19.6
on rivers make terrestrial animals ava ilable, these are eaten av idly by the trout regardless
of the poverty or abm1dance of the aquatic famrn (Frost and Brown, 1967).
The character of the river bed influences the kind of or ganisms which tend to be
particularly abtmdant. Various substrates are encotmtered in the Avoca catchment from
upland erosional to lowland depositional. Some idea of how the benthic mac ro-
invertebrates from stony and sandy/silty substrate differ in kind and relative abundance
is apparent from the comparison of the percentage composition of the fauna in the
Aughrim River, Sil, where the substrate is stony, to S3, and silty tributary of the Mayne
(Table 4).
Water mosses are present at several of the site locations where the flow is swift
and the substratum stony. These plants tend to hold a varied inveiiebrate famrn
including ephemeropteran, coleopteran and chironomid larvae, and Gammarus. Benda
and Ranunculus present at S3 and S4, with a moderate to slow flow rate, supported
tricopteran larvae and Simulium.
The value of aquatic vegetation to the trout is that it can provide "good lies", that
is places where, tmdisturbed by the current, hidden from enemies and on a good feeding
grotmd, they find a satisfactory microhabitat. The trees and bushes on the river bank
give shade, shelter and hiding places and thus also provide "good lies" for the trout.
The overhanging bank vegetation of many of the sites would also act as shelter for
newly emerged flies, which would not be blown away from the river to be themselves
lost as immediate trout food, or to leave no progeny to be future food. Bank vegetation
management would benefit many of the sites patiicularly S9 and S10.
Since the catchment waters ovemm varied geological fonnations, calcium levels
tend to vary. The importance of calcium in detem1ining the survival of brown trout
eggs at low pH has been demonstrated by Brown and Lynam (1981). The relationship
between the perecentage survival of freshly feiiilized eggs and a range of pH levels and
>
,
Figure. 10. The percentage survival of freshly fertilised brown trout
eggs after 8 days in a range of pH and calcium concentrations. (Brown and Lynam, 1982).
100
...J 80 > 60
c::: =>
Vl 40
0
2
0
pH CALCIUH µeq
r
1Survival after eight days is 100% at pH 5.1 irrespective of calcium
concentrations down to 12 µ equiv
r
1 and at 400 µ equivr
1 of calcium irrespective ofpH, down to 4.2, whilst at low pH (4.2) and low calcium (50 µ equiv
r
1 and less)survival is nil. This would indicate that the low pH and calcium values encountered (i.e
4.96 and 125.0 µ equiv 1-1
respectively) in the Glenmalure River during low flow
conditions are potentially threatening to the survival of freshly fertilised brown trout
eggs.
Experiments designed to measure the toxicity of low pH on older fish have been
short term bioassays at less than pH 4.0. Such extreme conditions are not likely to be
responsible for the elimination of fisheries in natural waters and only serve to indicate
the relatively high resistance of adult fish compared with the eggs. In terms of
percentage survival rates, adult salmonids are able to tolerate pH levels down to 4.3 and
4.4 for long periods even in low calcium conditions. With regard to chronic (sub lethal)·
effects of acid exposure the data is confused. Some researchers report slower growth
rates of fish around pH 5 compared with that at pH levels above 6 (Menedez, 1976;
Rogers 1984), whereas Jacobsen (1977) found no effect on brown trout growth down
[image:39.596.186.469.109.373.2]The importance of calcium in ame liorating any acid effect on growth rates is also
confusing. Rogers (1984) fotmd that both pH and calcium had significant effects on
brook trout growth (maximum 1.2% d-1), whereas Sa dler and Lynam (1984) fotmd that
brown trout could main tain a growth rate of 1.3% -d 1 down to pH 4.4 and with a
calcium concentration nearly twenty times lo wer than the minimum used by Rogers
(198 4). The difference between these studies must be attributed to species diffe re nce
unless diffe rences in experimental design produced some stress exac erbating the pH
stress effects in the study of Roger s (1984).
The pH range within the Avoca catchment (5.0 to 8.6) is quite perilous to
salm onids, taking into acc0tmt the other parameter s. Table 9 shows the effects of a
range of pH values on salmo nids.
The position in the lower Avoca catchment is further complicated in that the acid
leachate from the mines contain considerable quantities of dissolved ferric sulphate
which become hydrolysed at pH values above 3.0 to form ferric hydroxide. Larsen and
Olsen (1948), cited in Alabaster and Lloyd (1981), found that fish kills occurred in a
trout hatchery when the pH value of the water was 6.2 - 7.0 and the water contained
1.5-2.0 mg Fe/1. The cause of death was attributed to the precipitation of ferric
hydroxide on the gills, since the pH value of the water was higher than the lethal value.
The toxicity of the copper and levels of zinc downstream of the mining belt is
additive of the separate metal concentrations. Lloyd (1961) f0tmd that the effect of this
mixture of metals was additive in both soft and hard waters (Table 10).
Because of the complexity of the Avoca Mine waste and the paucity of analytical
data it is difficult to distinguish the effect attributable to each specific metal.
Only tentative water quality criteria is formulated at present because there are
virtually no field observations that indicate unequivocally the concentrations of copper
and zinc that are not inimical to fish populations. The recommended criteria (proposed
by EIFAC) for the 95 percentile and 50 percentile values of zinc are 0.1 and 0.03
0.05 of the 50-d LCS0 value. These criteria are only small fractions of the lethal
thresho ld concentrations. The toxicity of both copper and zinc is effected by increasing
water hardness (Ta ble 9).
The harmful effects of ammonia on fish are relat ed not to hardness but to the pH
value and the temperature of the water owing to the fact that only the mi-ionized
fraction of ammonia is poisonous. The tm-ionized fraction increases with rising pH
value, and with rising temperature. The lowest lethal concentration fotmd for slamonids
is 0.2 mg NH:/1 (un-ionized), but other adverse physiological and histopathological
effects are caused by prolonged exposure at conentrations of 0.025 mg NH:/1 (tm-
ionized). Concentrations of total ammonia which contain this ammmt of tm-ionized
ammonia range from 19.6 mg/1 (pH 7.0, 5°C) to 0.12 mg/1 (pH 8.5, 30°C). Ball, 1967
fotmd that for periods of up to 1 day the rainbow trout was much more susceptible to
ammonia, in terms of medium lethal concentrations than coarse fish. As forementioned,
large quantities of ammonia are discharged to the lower reaches of the Avoca River
from a fertilizer factory. A rise in temperature of 10°C would double the concentrations
of mi-ionized ammonia present in the ammonia effluent.
Despite the myriad of toxicants in the lower stretches of the Avoca, salmon and
sea trout continue to persevere and nm the river when in flood. Several do not make
it due to toxic poisoning, but also as a result of poaching, since the waiting for optimum
conditions at the mouth of the river can be a long taxing one. When conditions are
most favourable, the fish could manage to nm the toxic 10km section of the river in 24
hours or less (O ' Grady, 1992) .
The Rathdrnm anglers, on the Avonmore, consists of one hundred members.
Several salmon smolts are reported to have been taken by rod and line last year, and
good size brown trout of approximately 226 grams (Kelly, 1992). The fishing in the
TABLE 9. Summary of the effects of pH values on salmonids.
Adapted from Alabaster and Lloyd, 1981.
Range Effect
3.5 - 4.0 This range is lethal to salmonids.
4.0 - 4.5 Likely to be harmful to salmonids which have not
previously been acclimated to low pH values,
although the resistance to this pH range increases with the size and age of the fish.
4.5 - 5.0 Likely to be harmful to the eggs and fry of
salmonids, and to adults particularly in soft water
containing low concentrations of calcium, sodium and chloride.
5.0 - 6.0 Unlikely to be harmful to any species unless either
the concentration of free carbon dioxide is greater than 20 mg/1, or the water contains iron salts which are freshly precipitated as ferric hydroxide, the precise toxicity of which is not known. The
lower end of this range may be harmful to non- acclimated salmonids if the calcium, sodium and chloride concentrations, or the temperature of the water are low.
6.0 - 6.5 Unlikely to be harmful to fish unless free carbon
dioxide is present in excess of 100 mg/1.
6.5 - 9.0 Harmless to fish, although the toxicity of other
poisons may be affected by changes within this range (e.g. ammonia).
9.0 - 9.5 Likely to be harmful to salmonids if present for a
considerable length of time.
9.5 - 10.0 Lethal to salmonids over a prolonged period of
time, but can be withstood for short periods.
10.0 - 10.5 Can be withstood by salmonids for short periods
but lethal over a prolonged period.
[image:42.596.111.543.74.744.2]TABLE 10. Summary of laboratory data on the joint action of mixtures of toxicants to fish.
Toxicants Species Exposure Period Ratio of
toxicant EC 50
Joint Action
Multiple of
Additive pint
action
Reference
Copper and Zinc Rainbow
Trout
3-d LCS0
(Hard water
3-d LCS0
1 : 1
1 : 1
Additive
Additive
1.0
1.
0
Lloyd (1961)
(Soft water)
Ammonia and Copper Rainbow
Trout
48-h LCS0 1 : 1 Additive
1.
0
Herbert &Vandyke
(1964)
Ammonia and Zinc Rainbow Threshold LCS0
1.0: 0.5
Additive1.
0
Herbert &Trout (Hard water) 1:2 Additive
1.0
Shurben [image:43.842.66.776.169.477.2]TABLE 11. Maximum Annual 50 and 95 percentile concentrations of 'Soluble' copper and zinc.
(Alabaster and Lloyd, 1981).
Water Hardness
(mg/I CaC03)
Salmonids (mg/I Zn)
95 percentile
Salmonids 50 percentile
(ug/l Cu)
95 percentile
10 0.03 1.0 5.0
50 0.20
6.0
22.0100 0.30 10.0 40.0
300 28.0 112.0
[image:44.842.188.717.203.427.2]CONCLUSIONS
The catchment encompasses a range of cha1mels from small streams to the main river. These areas include many zones which are curre ntly unsutied to salmonids because of pollution, bank vegetation problems and w1suitable physical instream conditions, while other areas endowed with suitable habitat are producing reasona ble-
good numbers of slow-growing trout.
Sites 1, 9 and 10 would benefit from the creation and maintenance of bank cover. A paucity of suitable loose gravels for spawning purposes also limits the production at the latter two sites. However, the mining effluent which affects the main
cha1rnel (S9 + S10) is a more complex problem which will take longer to resolve.
The presence of sewage fw1gus, the composition of the invertebrate faw1a, the
macrophytes present and the fish stock situation were taken as pointers to the status of the streams in tenns of pollution/emichment. S2, S6 , S7 and S8 need to be monitored
closely to control the nutrient loading to the streams.
The gradient, substrate, vegetation and sinuousity of S 7 indicate that this tributary
could potentially produce significant quantities of salmonid fry and parr if the pollution
could be traced and eliminated.
The Mayne sub-catchments fish production could be enhanced by the addition of gravels and the alteration of physical instream.
This study has shown that although growth rate is generally low, due to the low productivity of the catchment, good populations of sttmted brown trout exist in
REFERENCES
Adams, J. (1924) The Angler's Guide to the Irish Fisheries, London. p. 220.
Alabaster, J.S. and Lloyd, R. (1981) Water Quality Cn'teria for Freshwater Fish,
Second Edition, Camb ridge University Press, 361pp.
Avery, B.W. (1 980) S oil classification for England and Wales. Soil Sur vey Technical Monograph No. 14. Soil Survey of England and Wales.
Brown, D.J.A. and Lynam, S. (1982) The effect of pH and calcium on fish and fisheries. Water, Air and Soil Pollution, 18, 343-51.
Crisp, D.T., Mann, R.H.K. and McCormack, J.C. (1974) The populations of fish at Cow Green, Upper Teesdale, before impoundment. Journal of Applied Ecology 11, 969-996.
Eastern Regional Fisheries Board (1 988) Survey of the Aughrim River. Unpublished
document.
Forestry and Fisheries Guidelines (1992) Forest ry Operational Porgramm e, Forest
Service, Department of Energy, Dublin 2.
Frost, W.E. and Brown, M.E. (196 7 ) The Trout. 316pp. New Naturalist Series,
Collins Clear-Type Press, London.
Herbert, D.W.M. and Shurben, D.G. (1964) The toxicity to fish of mixtures of pius
1 Salts of ammonia and zinc. Annals of Applied Biology, 53, 33-41.
Herbert, D.W.M. and Vandyke, J.M. (1964) The toxicity to fish of mixtures of
poisons. 2. Copper-ammo nia and zinc-phenol mixtures. Annals of Applied
Biology, 53, 415-421.
Hornung, M., Le-grice, S., Brown, N. and Norris, D. (1990) The role of geology and
soils in controlling surface water acidity in Wales. Acid Waters in Wales 56-66.
(Eds. Edwards, R.W. et al). Kluwer Academic Publishers, Dordrecht,
Netherlands.
Jacobsen, 0 . J. (1977) Brown trout (Salmo trutta L.) growth at reduced pH.
Aquaculture, 11, 81-4.
Kelly, J. (1992) Pers. comm.
Kinniburgh, D.G. and Edmunds, W.M. (1986) The susceptibility of U.K. groundwaters
to acid deposition. Hydrogeol. Rep. Br. Geol. Surv, No. 86/3 . British Geological
Survey.
Lackey, J.B. (1938) The flora and fauna of surface waters polluted by acid mine
drainage. Public Health Reports 53, 1499-1507.
Lloyd, R. (1961) Effect of dissolved oxygen concentrations on the toxicity of several
poisons to rainbow trout (Salmo gairdneri, Richardson). Journal of expen·mental
Biology 38, 447-55.
Macan, T.T. and Cooper, R.D. (1949) A key to the British fresh and brackish water
gastropods. Scientific Publications. Freshwater Biological Association. No. 13.
Menendez, R. (1976) Chronic effects of low reduced pH on brook trout (Salvelinus
fontinalis). Journal of Fisheries Research Board, Canada, 33, 118 -23.
Milner, N.J. and Varallo, P.V. (1990) Effects of acidification on fish and fisheries in
Wales. Acid Waters in Wales 121 -143. (Eds. Edwards, R.W. et. al). Kluwer
Academic Publishers, Dordrecht, Netherlands.
Norton, S.A. (1980) Geologic factors controlling the sensitivity of aquatic ecosystems
to acid precipitation. In : Atmospheric sulphur deposition, (edited by D.S.
Shriner, C.R. Richmond and S.E. Lindberg). Michigan , U.S.A. Ann Arbor
O' Grady, M. (1992) Pers. comm.
Rogers, D.W. (1984) Ambient pH and calcium concentration as mo difiers of growth and calcium dynamics of brook trout, Salve Linus fontinalis. Canadian Journal of Fishe·nes Aquatic Sciences, 41, 1774-80.
Sadler, K. and Lynam, S. (1 98 4) Some effects of low pH and calcium on the growth and tissue mineral content of yearling brown trout (Salmo trutta ). CERL Note TPRD/L/2789/84. Leathe rhead, Surrey, U.K.: Central Electricity Research
Laboratories.
Southern, R. (1932) The growth and food of brown trout. Salmon and Trout
Maga zine, 67, 168-76.
Sutcliffe, D.W. (1967) A re-examination of observations on the distribution of
Gammarus duebeni Lilljeborg in relation to the salt content in fresh water.
Journal of Animal Ecology , 36, 579-597.
Sutcliffe, D.W. and Hildrew, A.G. (1989) Invertebrate communities in acid streams. In : "Acid toxicity and aquatic animals" e.d. R. Morris, E.
vV
.
Taylor, DJ.A. Brown and J.A. Brown, Cambridge Univeristy Press, 279pp.Went, A.EJ. (1979) A 'lost' Irish Salmon River, Irish National Journal, Vol. 19. No. 12, 422-424.
Went, A.EJ. and Frost, W.E. (1942) River Liffey Survey .V. Growth of brown trout (Salmo trutta L.) in alkaline and acid waters. Proc. R.IA., Vol. XLVIII, Section B, 67-84.
Zippin, C. (1959) The removal method of population estimation. Journal of Wildlife