Fuzzy Controller Parameter Optimization Using
Genetic
Algorithm
for
a
Real
Time
Controlled System
Abstract—In this paper, a methodology for combining genetic algorithm (GA) and fuzzy controller (FC) to create a genetic-fuzzy approach (GA-FC) is presented. Using GA, genetic-fuzzy rules and membership functions are optimized simultaneously. A water level control process is used to test the performance of GA-FC controller. The process was first modeled using Artificial Neural Network (ANN). FC parameters were then tuned using genetic algorithm. Finally, the performance of GA-FC approach was
presented using the simulation and real time applications. The
main contribution of the study is that, the developed structure replaces the tedious process of trial and error for better combination of fuzzy parameters and can settle the problem of designing a FC without an expert’s experience.
Index Terms—Nonlinear System, Artificial Neural Network, Fuzzy Control, Genetic Algorithm, Particle Swarm Optimization
I.
I
NTRODUCTIONControl of liquid level in tanks and fluid flow between tanks is a fundamental requirement in almost all process industries. Stabilizing the water level of a plant around a predetermined level is an important problem since dynamics of those systems has nonlinear characteristics[1]. In our study, GuntRT 512, a water level control process, is used to observe trajectory tracking performance. The process is first modelled using NARX type ANN to overcome the nonlinear behaviour of the system. Controller design followed the modeling process. There have been efforts to apply various control techniques to water level control. Among such of advanced control techniques, fuzzy control technique receives many attention due to its resemblance to human-like characteristics. To tune such parameters, cumbersome trial-and-error procedures are necessary. To get rid of this necessity genetic algorithm is applied to tune the fuzzy controller action values and membership function boundary values simultaneously. In the following section water level control system and its modeling process using ANN is presented. Section III describes the steps to optimize Fuzzy controller parameters. Various real time and simulation experiments are performed in section IV and section V draws conclusion.
Manuscript sent March 15, 2013; Fuzzy Controller Parameter Optimization Using Genetic Algorithm for a Real Time Controlled System, T.T.Erguzel, Uskudar University, Uskudar, Istanbul (corresponding author to provide phone: 90-505-497-02-11; e-mail: [email protected]).
II.WATER LEVEL CONTROL PROCESS
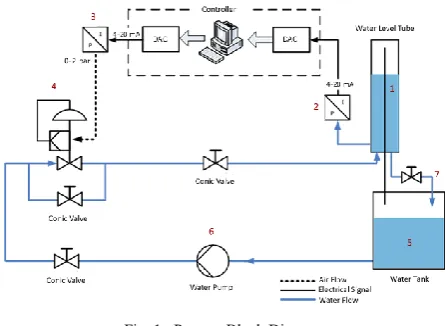
[image:1.612.327.550.455.618.2]The purpose of water level control process is to keep the water level in the tube at a desired level and track the reference trajectory. Depending on the control signal (current), pneumatic control valve allows water flow into the tube from the tank and causes level change in the tube. The operation is repeated throughout the control process till the water level in the tube is set to reference. The control process runs as shown in figure 1. A reference trajectory or level is first set to be followed by the system. Fuzzy controller reads the water level in the tube (1) from pressure/current converter (2) and compares it with the reference value. Depending on the error, the controller generates required control signal and transfers over current/pressure converter (3) to pneumatic control valve (4). Conic valve is opened in proportion to the control signal and water in the tank (5) is pumped (6) to the tube. The exhaust pipe (7) enabling continuous water flow out to the water tank is set open to be used as disturbance. Throughout the process control the aperture of pneumatic control valve changes flow and lets water flow into the tube while exhaust pipe flows out to the tank. Thus the system is able to follow the reference trajectory or level ensuring that flow disparity.
Fig. 1. Process Block Diagram
A. Structure Of Narx Type Ann
process [2]. ANNs are utilized in several areas such as controlling electric motors [3], signal and image processing [4], prediction [5], classification [6], etc.
Many of ANN applications use simple multilayer perceptron (MLP) network training back propagation algorithm. A simple way to introduce dynamics into network consists of using an input vector composed of past values of the system inputs and outputs. This is the way by which the MLP can be interpreted as a NARX model of the system. This way of introducing dynamics into a static network has the advantage of being simple to implement[7]. The NARX model can be represented as given in equation 1;
) ( )) ( ),..., 1 ( ); ( ),..., 1 ( ( ) ( k m k u k u n k y k y f k o (1)
where o(k) is predicted value, y(k) is current process output,
) (k
u is current process input, (k) is the approximation error
at time instant k, m is an input time delay, n is an output time delay and f is an activation function describing the
system behaviour. Typical MLP network is arranged in layers of neurons, where every neuron in a layer computes the sum of
its inputs T
d fr v
k [ ] and passes this sum through an activation function ( f ). The output of the network (o) is defined as a matrix form in equation 2;
of 2(W2f1(W1xb1)b2) (2) Where superscript defines the layer number, Wis weight
matrices defined as:
0 , 1 2 , 1 1 , 1 0 , 2 2 , 2 1 , 2 0 , 1 2 , 1 1 , 1 1 ... ... ... ... ... ... ... s s s s s s W W W W W W W W W W ], ... [ 1,1 1,2 1,12 s W W W W
Where S0 is input, S1 is hidden layer neuron number,
bis bias vector defined as ] [ , ] ...
[ 1 2 1 2 1
1 b b b b b
b s T and
f activation functions are defined as:
, exp exp exp exp 1 n n n n f
f2 n.
MLP networks learn by adjusting the weight and bias values using back propagation algorithm. The back propagation algorithm for the MLP is generalization of the least mean square (LMS) algorithm. The algorithm adjusts the network parameters in order to minimize the mean square error given in equation 3;
p t o
e 1 2 ) ( 2 1
(3)
Where; t is target, is MLP output, is the sample instant
in p size. The steepest descent algorithm iteratively decreases
network error during learning phase at each epoch as given in equation 4; j i w e k j i w k m j i w , ) ( , ) 1 ( , (4) i b e k i b k m i b
1) ( )
(
Where is learning rate [8]
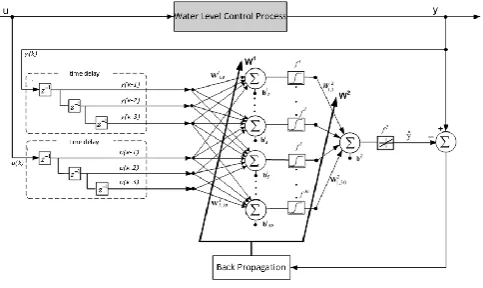
[image:2.612.320.562.300.444.2]In order to design better ANN applications, the number of hidden layer and neurons in the hidden layer(s) play important roles. Determining the parameters is another topic to work on. Although there is no theoretical basis for selecting these parameters, a few systematic approaches are reported one of which is heuristic [9]. In our work the performance of ANN with one hidden layer and 5, 10, 20, 30 and 50 neurons were tested. NARX type ANN architecture of the equation 2 for the model of the system is given in figure 2.
Fig. 2. Designed NARX Type ANN Architecture for Modelling Level Control Process
Designed ANN architecture has two inputs for water level control process output (y); input (u) and the other output for predicted value (yˆ). Hyperbolic tangent and linear activation
TABLE I
SSE and R values for different ANN models
Hidden
Layers Hidden Layer Neurons Function Training Generalization SSE Coefficient (R) Correlation
1
5 BR 4.44E-01 0.988
10 BR 4.27E-01 0.990
20 BR 4.11E-01 0.999
30 BR 3.48E-01 1.000
30 LM 3.82E-01 0.979
50 BR 3.93E-01 0.993
2
5 BR 3.77E-01 0.990
10 BR 4.02E-01 0.993
20 BR 3.84E-01 0.997
22 BR 3.55E-01 0.992
20 LM 3.95E-01 0.974
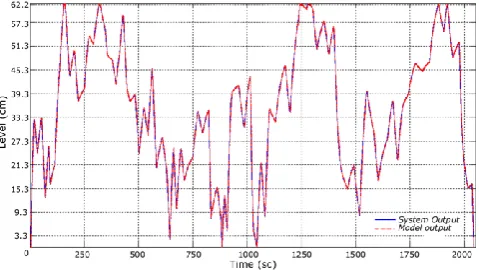
According to table 1, ANN model trained with BR with 1 hidden layer and 30 neurons in hidden layer has more satisfactory performance than the others for both learning and generalization phase. Thus ANN-30 network is preferred for modeling of water level control process. To test the model, both real time system output and model output were drawn for random generated input signals as given in figure 3. As it is seen from the open loop behaviour, ANN model and real system outputs are overlapping.
Fig. 3. ANN Model and Real System Open-Loop Outputs for Various Inputs
III.FUZZY CONTROLLER PARAMETER TUNING WITH GA At present Fuzzy logic is applied in various control areas and applied in systems such as elevators, traffic control and software: medical diagnosis, securities, data compression as well as for control of electric drives and electric networks [10– 13].
Several studies have shown FC to be an appropriate method for the control of complex or partially identified processes, many of which cannot easily be modeled in a mathematical way. Unlike a conventional controller, no rigorous mathematical model is required to design a FC and in many cases, they can be implemented easily. However, this simplicity also presents a bottleneck in their design. FC relies on heuristic knowledge that is subject to designer’s interpretation and choice. The traditional approach to fuzzy design is laborious, time consuming and in most cases specific to each application. Optimal search algorithms such as GA and ant colony optimization could solve some of these problems. Even though the choices of membership function are subjective, there are some rules for membership function
selection that can produce good results[14]. Therefore, those techniques were proposed as alternative means for tuning Fuzzy controller parameters. Besides its widespread use, simultaneous optimization of both action values and membership function boundary values of fuzzy controller is important and up-to-date for water level control process. Mamdani and Sugeno type controllers are used in design process of Fuzzy controlling. Sugeno type controller has two outstanding superiorities to Mamdani type controller. Because of the linear dependence of each rule on the input variables, the Sugeno method is ideal for acting as an interpolating supervisor of multiple linear controllers that are to be applied, respectively, to different operating conditions of a dynamic nonlinear system. Because it is a more compact and computationally efficient representation than a Mamdani system, the Sugeno system lends itself to the use of adaptive techniques for constructing fuzzy models. These adaptive techniques can be used to customize the membership functions so that the fuzzy system best models the data. So, for our model and controlling process, Sugeno type Fuzzy controller is preferred consisting of 2 inputs which are error and change in error. Boundary values of the inputs and 15 action values are also optimized so that the real system can track the trajectory.
A. GA-Fuzzy Controller
function is the link between the genetic algorithm and the problem to be solved. Most of the computer time in GAs is spent by evaluating objective functions. The initial population for traditional GAs is usually chosen randomly. We used a byte encoding scheme instead of a traditional binary one So GA is particularly presented as an alternative method to traditional optimal search approach for optimization problems enabling a substantial departure from the complexity and consequent difficulties involved in the design of Fuzzy controllers. GAs have been recognized as a powerful tool in many control applications such as parameter identification and control structure design.GAs have also found widespread use in controller optimization particularly in field of fuzzy logic and neural networks. In the early 1990s, GAs were first investigated as an alternative mean of tuning parameters of controllers. Then GAs have also been extensively applied to the off-line design of controllers, particularly as an alternative tuning technique for process which are otherwise difficult to tune. Action values, membership function shapes and their boundary values are variables of Fuzzy controllers to be optimized. So both input and output parameters are variables and can be optimized concurrently. In our study we implemented GA for tuning Fuzzy controller parameters offline and used depicted chart in figure 4.
Fig. 4. Implemented GA-FUZZY controller structure
The most important feature of GAs is the way to transform the system output to the cost functions (
). The cost function is given in equation 5. Designed trajectory has different crossing points (t1, t2, t3), and therefore fitness function has differentweight factors ( 0.1, 0.3, 0.6) for each trajectory region and is able to minimize RMS error for all trajectory regions;
3 2 2 ) ( ) ( 2 1 2 ) ( ) ( 1 0 2 ) ( ) ( ) ( ) ( ) ( 1 t t t t y t t t t y t t t t y y p y p y p T
(5)where is fitness value, T is number of sampled data,
) (t
y system output,Py(t)desired trajectory output, , β and δ are cost gain factors.
The performance of GA depends on the used parameters. Therefore those parameters, given in table 2, were decided after numerous experiments. Using GA operators, 15 action values were optimized after 100 generations and are listed in table 3. Remaining 24 boundary value parameters of input variables, error and change in error, were also optimized were also optimized and given in table 4 and table 5.
TABLE II Used GA operator values
GA parameters Type/Value
Coding type Population size Selection operator Crossover operator Crossover probability Mutation operator Elite percentage Scaling
Real code 40
Tournament (4 individuals) Scattered
80 %
Gaussian (c=1, σ=1) 10 %
Rank based
TABLE III
Optimized action values using GA
e Δe PB (Positive Big) PS (Positive Small) Z (Zero) NS (Negative Small) NB (Negative Big)
N 9.878 8.238 7.499 5.595 2.043 Z 9.951 9.951 8.434 5.342 2.014 P 9.902 8.061 8.517 5.987 2.107
TABLE IV
Optimized ”error” membership function boundary values using GA
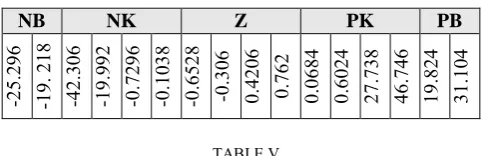
TABLE V
Optimized ”change in error” membership function boundary values
The optimized values for action values range from 2V to 10V. Controller output, the action value, is used to change the aperture of pneumatic control valve. For the system 2V closes the valve completely to cut the flow while 10V opens to let water flow into the tube. Before starting the optimization process, type of membership functions to be used is also important. Because of its flexibility ∏ type membership functions were chosen for the inputs. So, for the first controller input which is error, NB (negative big), NS (negative small), Z (zero), PS (positive small) and PB (positive big), and for the second which is change in error, negative (N), zero (Z) and positive (P) membership functions were used.
NB NK Z PK PB
-2 5. 29 6 -19. 21 8 -4 2. 30 6 -1 9. 99 2 -0 .7 29 6 -0 .1 03 8 -0 .6 52 8 -0 .3 06 0. 42 06 0. 76 2 0. 06 84 0. 60 24 27 .7 38 46 .7 46 19 .8 24 31 .1 04
N Z P
[image:4.612.49.175.632.727.2]IV. EXPERIMENTAL RESULTS
In order to verify the efficiency of GA-FC, simulations and real time experiments were conducted. For the proposed method comparative experiment results were reported. Starting with sampling time experiments, the performance of optimized controller parameters obtained using GA was observed on various levels and trajectories. The robustness of the controller with the optimized parameters was also observed under disturbance. Finally the performance of the algorithm was presented regarding its RMS error value, rise time, settling time, overshoot and steady state error values.
A. Sampling Time Experiments
[image:5.612.328.570.190.309.2]Sampling time is a serious variable affecting the performance of the controller and the system. To observe the effect of sampling time on the controller, a reference level (45 cm) and a random trajectory signal were given to the system as reference to be controlled with 0.01, 0.1, 0.25, 0.5, 1 and 2 seconds sampling times respectively. The difference between system output and reference values are calculated as RMS error values and listed in table 6. For the experiments with 0.25sc sampling time the system produced better outcomes than the others. So, throughout for the following experiments sampling time is set as 0.25sc.
TABLE VI
RMS values for various sampling times and signals
B. Step Transition Experiments
The performances of the algorithm and design were also observed on step input transition experiments. Random steps were applied to the system as reference signal and fuzzy controller forced the system to set the desired level during the run time. Real time outputs of GA-FC design for step transition reference are given in figure 5.
Fig. 5. Real time system output of GA-FC design for step transition reference
Feeding the system with transitive reference levels let the system compare how responsive and adaptive the controllers are. Mobile membership function boundary values in the course optimization process enabled a smooth transition for all step values. The performance of GA-FC design was also observed on various experiments. Real time and simulations tests performed for step input reference signals and presented with its rise time (tr), settling time (ts), overshoot (ym) and steady state error (ess) values on table 7.
TABLE VII
Algorithm comparison according to settling parameters
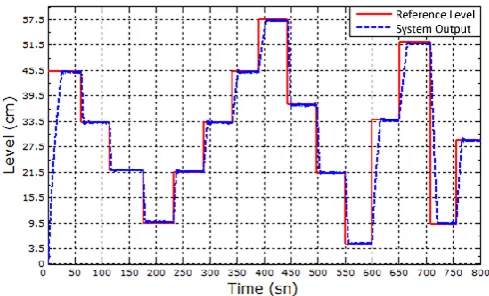
C.Trajectory Tracking Experiments
Water level control process was finally referred with a 3rd degree trajectory with different slopes to see the performance of GA-FC design. The performance of the algorithms on fuzzy controller was also presented using RMS values for each reference trajectory tracking sample and presented in table 8. The output of the system was also plotted in figure 6. The graph and the table presented that the performance of the algorithm and controller is quite efficient for real time application.
TABLE VIII
RMS error values for two trajectory references
Slope Run Time Mode RMS Value
10 Real Time 0.0057
Simulation 0.0058
20 Real Time 0.0113
[image:5.612.47.280.358.468.2]Simulation 0.0117
Fig. 6. GA-FC System output, reference trajectory for the slope value 20
Sampling time
(sc) Trajectory Signal Step Value (45cm)
0.01 0.0133 0.1757
0.1 0.0065 0.1755
0.25 0.0058 0.1746
0.5 0.0071 0.1776
1 0.0126 0.1821
2 0.0231 0.1964
Reference Level (cm)
Run Time Mode
tr (sc)
ts (sc)
ym (cm)
ess (cm)
30 Real Time 11.25 15.25 0.57 (%1.9) 0.08
Simulation 11.5 15.5 0.53 (%1.8) 0.07
45 Real Time 19.25 27.5 0.50 (%1.1) 0.06
Simulation 19.75 29 0.46 (%1.0) 0.05
60 Real Time 34.25 43.25 0.42 (%0.7) 0.03
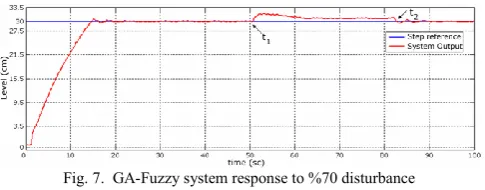
[image:5.612.50.295.554.702.2]D.Disturbance Rejection Experiments
[image:6.612.53.296.200.295.2]Finally, to test the disturbance rejection capability of designed controller, the exhaust valve was closed %70 (t1) then restored to its initial position (t2). Closing the valve causes less water flow out to the water tank from the exhaust pipe and forcing the controller to update its control signal to compensate the reference level. As it is seen from figure 7, 30 cm was set as reference level to the GA-FC system first and at t1 %70 disturbance is applied to the system for 35 seconds till t2. Although %70 closure is a quite strong disturbance for the system it could set the system to desired level with quite few overshoots.
Fig. 7. GA-Fuzzy system response to %70 disturbance
V.CONCLUSION
In this paper we proposed genetic algorithm to optimize fuzzy controller’s consequent parts and membership function boundary values simultaneously. To test the controller therefore algorithm performances, a water level control process was modeled using artificial neural network using NARX architecture. Optimization process using genetic algorithm followed modeling to design a proper fuzzy controller. Performance of the controller is then observed setting up various experiments. The results demonstrated that the application of GA-FC for fuzzy rule induction is viable approach and have quite good outcomes. The validity and versatility of the developed structure has also been demonstrated employing the controller on the real system. Designing fuzzycontroller with GA does not require any prior knowledge and yields satisfactory results. The algorithm also enhances productivity of designing fuzzy controller, makes the controller have comprehensive lookout and converges to a better solution. For process control and paramater tuning applications the proposed optimization algorithm is promising. For future study it will be worthwhile to implement that structure ranging from modeling to optimization to various realtime system controlling applications.
REFERENCES
[1] Min-Soeng K., Chang-Hyun K., Rohan M., Ju-Jang L. “Evolutionary Optimization of Fuzzy Systems for Water Level Control in the Steam Generator of Nuclear Power Plant”, IEEE International Conference on Systems, Man and Cybernetics, Vol. 3., pp.2303-2308,October, 2004
[2] Nirmaladevi M., Mohankumar N., Arumugam S., “Modeling and Analysis of Neuro–Genetic Hybrid System on FPGA”, Electronics and Electrical Engineering–Kaunas: Technologija, No. 8(96). pp. 69–74,
2009.
[3] Reyneri L. M., “Implementation Issues of Neuro–Fuzzy Hardware: Going Toward HW/SW Codesign”, IEEE Transactions on Neural Networks, Vol. 14. No. 1, 2003.
[4] Paukštaitis V., Dosinas A., “Pulsed Neural Networks for Image Processing”, Electronics and Electrical Engineering. Kaunas: Technologija, No. 7(95). pp. 15–20, 2009.
[5] Rutka G., “Prediction Accuracy of Neural Network Models”
Electronics and Electrical Engineering. Kaunas: Technologija, No.
3(83). pp. 29–32, 2008.
[6] Raudonis V., Narvydas G., Simutis R., “A Classification of Flash Evoked Potentials based on Artificial Neural Network”, Electronics and Electrical Engineering. Kaunas: Technologija, No. 1(81). pp. 31–36,
2008.
[7] Eduard P., Nomm S., “Adaptive Output Feedback Linearization for a Class of NN-based Anarx Models” International Conference on Control & Automation, Estonia, pp. 3173-3178, 2007.
[8] Hagan M., Demuth M. and Beale M., “Neural Network Design”, Boston: Thomson, 1997.
[9] Runkler T., Katz C. “Fuzzy Clustering By Swarm Particle Optimization”, IEEE International Conference on Fuzzy Systems,
Canada, pp. 601-608, 2006.
[10] Lisauskas S., Rinkevičienė R., “Model of ventilation system drive with Fuzzy controller”, Electronics and Electrical Engineering. – Kaunas:
Technologija, No. 10(106). pp. 13–16, 2010.
[11] Shafiei S. E., Sepasi S., “Incorporating sliding mode and Fuzzy controller with bounded torques for set–point tracking of robot manipulators”, Electronics and Electrical Engineering. Kaunas: Technologija, No. 8(104). pp. 3–8, 2010.
[12] Dervinienė A., Bagdonas V., Daunoras J., “Application of Fuzzy–sets integral in expert systems”, Electronics and Electrical Engineering. Kaunas: Technologija, No. 5(77).pp.45–49, 2007.
[13] Valiulis G. Skysčio “Level Control Using Fuzzy Logic”, Electronics and Electrical Engineering. Kaunas: Technologija, No. 8(64), pp. 65–
68, 2005.
[14] Bobric E. C., Cartina G., Grigoras G., “Fuzzy Technique used for Energy Loss Determination in Medium and Low Voltage Networks”,Electronics and Electrical Engineering. Kaunas: Technologija, No.2(90). pp.95-98, 2009.
[15] Toemeh R., Arumugam S.,”Breaking Transposition Cipher with Genetic Algorithm”, Electronics and Electrical Engineering. Kaunas: Technologija, No.7 (79). pp.75-78, 2007