© 2019, IRJET | Impact Factor value: 7.211 | ISO 9001:2008 Certified Journal | Page 1436
field of Biomedical Imaging. However, an MRI image produced possesses fewer artifacts and is higher in tissue contrast. Also, the various operations on an area infected with tumor, in order to accurately find out its characteristics are performed manually by radiologists, which are prone to human and environmental errors. Consequently, computer aided technologies are nowadays used to overcome human limitations. Hence, in this paper, we attempt to study different computer based approaches mentioned in literature for brain tumor detection, primarily for Astrocytoma-type of brain tumors. The detection of tumor requires several processes on an MRI output which primarily includes Image Filtering and Binarisation , Image Disintegration, Feature Selection, finally followed by its classification into Cancerous or Non-Cancerous, to further
aid his/her experience-based manual inferences.
Information about textural features in the isolated region of Interest has been derived with the help of Gray Level Co-occurrence Matrix (GLCM).
Key Words: Primary Processing, Disintegration, 2-D Median Filter, K-Means clustering
1. INTRODUCTION
Until recent, the most common procedure to analyze imaging data was visual inspection on a printed support. With technology paying more attention to detail, Magnetic Resonance Tomography has emerged as a promising tool for brain imaging, due to its increased contrast discrimination and ability to obtain images in many planes. Instead of traditionally using X-Rays, MRI makes use of a strong magnetic field, to provide a remarkably detailed picture of internal organs and tissue clusters. It is evident that the chances of survival of a tumor-infected patient can be increased multifold, if the tumor is detected accurately at an early stage [2]. Medical image analysis is an important Bio-medical application which is highly computational in nature, and requires the aid of an automated system. Automated Brain Disorder Diagnosis with the help of MR images after a highly advanced estimate of its many characteristics is one of the specific medical image analysis methodologies. The image analysis techniques include Initial processing, Image
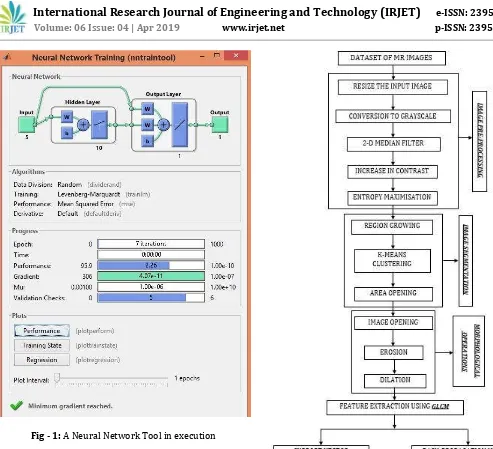
Image Pre-Processing(which includes Image Filtering and Binarisation) is required as the MR images consists of unwanted artefacts primarily because of human errors such as handling MRI Machine by operators, patient’s motion during imaging, thermal noise and existence of any metal in the imaging environment. Various types of filters such as Gaussian Filters, Unsharp filters, 2-D Median filters [3] are used for this purpose. Histogram Equalization is another preprocessing tool used for equalizing intensities in an image. This preprocessing technique is particularly useful in the detection of edges of a tumor [4]. Segmentation, as the name suggests, refers to partitioning a digital image into many segment or sets of pixels with an aim for them to be more meaningful or/and simpler to evaluate. There are many segmentation techniques which come into play such as K-NN technique, K-Means Clustering and Level set methods etc. [5]. What follows Image Disintegration/Segmentation are basic morphological operations such as erosion, dilation and using of a structural element to obtain a clear version of the isolated abnormal region of the group of cells, in some cases, a cancerous tumor. [2]
1.1 Feed-Forward Backpropagation Neural
Network Tool
© 2019, IRJET | Impact Factor value: 7.211 | ISO 9001:2008 Certified Journal | Page 1437
Fig - 1: A Neural Network Tool in execution2. PROPOSED METHOD
With reference to all the research work, the paper attempts to, apart from using a few Image Processing methods to locate the position of the tumor more accurately, provide a radiologist a reliable second and third opinion (As different classifiers have various limitations and advantages [7]) in the form of Back-Propagation Neural Network and Linear Support Vector Machine (SVM) respectively to classify the dataset more accurately into two classes namely:
a) The Benignant or No Tumor Class and, b) The Cancerous Class
25 images have been used which have been accessed by different websites which aim to assist researchers with a training dataset. Inbuilt Neural Network Tool has been used in order to facilitate backpropagation on MATLAB R2013b.
Chart -1: Proposed Method for detection and classification of MR Images
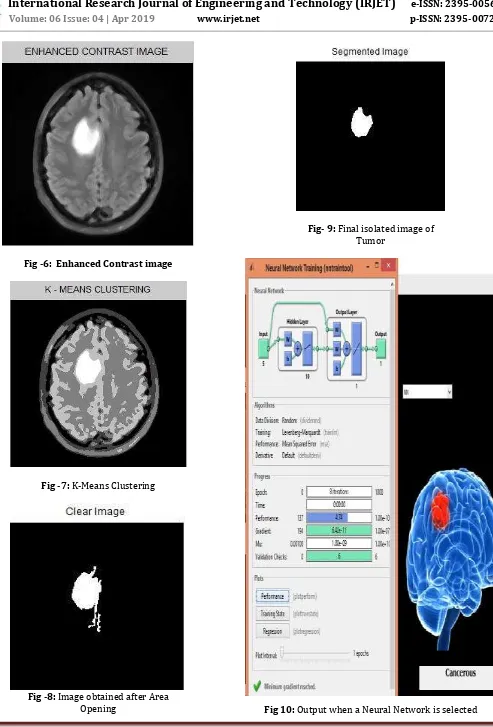
The proposed system initially includes the Pre-processing of an MR Image sample by the means of resizing the input image followed by converting it into a grayscale. What follows is the use of a 2-D Median Filter to remove ‘Salt and Pepper’ noise. Next we use a property of MATLAB which helps us to increase the contrast levels for an effective visualization of the entire structure of the brain. What follows is the process of Thresholding, which helps us divide the pixels accurately into foreground and background.
© 2019, IRJET | Impact Factor value: 7.211 | ISO 9001:2008 Certified Journal | Page 1438
element. Next, which we analyze he texture of the tumor byunderstanding the spatial dependency of pixels in an image by the means of a Gray Level Spatial dependence matrix or a Gray Level Co-Occurrence matrix.
The next step which follows re the classifiers which are extremely important for deducing whether a tumor is cancerous or not. Back-Propagation Neural Network (BPN) from the Neural Networks toolbox in MATLAB [6], and Support Vector Machine (SVM) [1] [2] are used to classify a sample undergoing the testing phase as cancerous or non-cancerous.
3. RESULTS
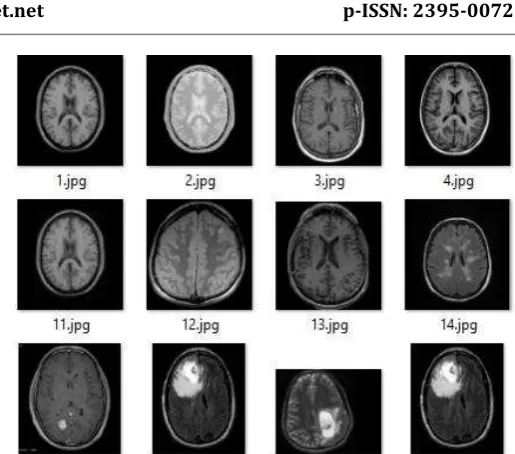
A step-by-step analysis of the entire process of tumor detection and classification has been shown in the next few pictures. The software used is MATLAB R2013b and the database consists of healthy brain images and those which are infected by Astrocytoma type of Brain tumor.
[image:3.595.301.559.66.293.2]Fig -2: Design of MATLAB GUI
[image:3.595.353.515.326.519.2]Fig -3: A portion of the dataset
Fig -4: Input Image
[image:3.595.38.287.486.681.2] [image:3.595.349.517.549.730.2]© 2019, IRJET | Impact Factor value: 7.211 | ISO 9001:2008 Certified Journal | Page 1439
Fig -6: Enhanced Contrast image [image:4.595.302.570.304.749.2]Fig -7: K-Means Clustering
Fig -8: Image obtained after Area Opening
Fig- 9: Final isolated image of Tumor
[image:4.595.70.253.334.527.2]© 2019, IRJET | Impact Factor value: 7.211 | ISO 9001:2008 Certified Journal | Page 1440
of Brain Tumor detection and treatment to provide a moreconcrete course of action for the doctors after deducing the existence and stage of the tumor. Also, the project has a lot of scope for further improvements with the use of more accurate classifiers (such as an upgrade from the conventional MATLAB Neural Network Tool and Binary SVM) and further, complex the image processing techniques which would be a part of the process.
REFERENCES
[1] “Image Analysis for MRI Based Brain Tumor Detection and Feature Extraction Using Biologically Inspired BWT and SVM” International
Journal of Biomedical Imaging
Volume 2017, Article ID 9749108, 12 pages, Nilesh Bhaskarrao Bahadure, Arun Kumar Ray,and Har Pal Thethi.
[2] “Feature Extraction and Selection with Optimization Technique for Brain Tumor Detection from MR Images” 2017 International Conference on Computational Intelligence in Data Science (ICCIDS)
[3] “A Survey Paper on Various Median Filtering Techniques for Noise Removal from Digital Images” American International Journal of Research in Formal, Applied & Natural Sciences [4] International Journal of Innovation, Management
and Technology, Vol. 4, No. 4, August 2013, “A Literature Review on Histogram Equalization and Its variations for Digital Image Enhancement” [5] “Performance Study of Image Segmentation
Techniques” 2015 IEEE.
[6] MATLAB R2013b, Neural Networks Toolbox. [7] “A Survey on Detection and Classification of Brain
Tumor from MRI Brain Images using Image Processing Techniques” International Research Journal of Engineering and Technology (IRJET). Volume: 05 Issue: 02 | Feb-2018