© 2019, IRJET | Impact Factor value: 7.34 | ISO 9001:2008 Certified Journal
| Page 367
STRENGTH STUDY OF MORTAR WITH PARTIAL REPLACEMENT
OF CEMENT WITH MICRO SILICA
Mohd Imran
1, Er. Sameer Malhotra
2, Er. Tarandeep Singh
31
M.Tech Scholar, Gurukul Vidyapeeth Institute of Engineering and Technology.
2
Assistant Professor, Gurukul Vidyapeeth Institute of Engineering and Technology.
3
Assistant Professor, Swami Vivekanand Institute of Engineering and Technology.
---***---ABSTRACT:- In this study the effect of replacement of cement with microsilica in cement paste was analyzed on the microstructure and mechanical properties of cement mortars. Microsilica content was varied as 3%, 6%, 9% and 12% by weight replacement of cement to investigate the effects on the fresh properties such as Standard Consistency, Setting Time, Flow Test and hardened properties of cement paste such as compressive Strength at primitive and advanced ages. The Specimens were evaluated at early 3rd, 7th, 28th and 56th day of curing ages. The study has revealed that the replacement of cement with microsilica leads to
sustainable construction practices.
INTRODUCTION
The production of the prime constituents of cement mortar i.e. cements and fine aggregates pose a threat to the environment and the use of enormous amount of drinking water lead to scarcity of these resources in long run. As per estimation, one ton of Portland cement clinker production yields one ton of green house gases (GHGs) such as carbon dioxide responsible for global warming. Construction technology can aid to sustainable development by using less energy and natural resources along with production of lesser waste material. The concern also focuses on the properties of the mortar in the fresh and hardened state. Thus, the paste should not only be workable, but the constructed material should be durable and of high compressive strength. The workability of mortar is controlled by particle size distribution (PSD) and the mechanical properties such as strength and durability are controlled by the mix grading and resulting particle packing. Further, the hydration behavior water, the requirement for flow depends upon the degree of dispersion of cement in water. The degree of flocculation in a cement paste is also related to water content and early hydration. The particle size distribution, particle packing and water demand in cement mortar can be controlled by using water reducing admixtures and mineral admixtures such as fly ash, ground granulated blast furnace slag, microsilica etc.
Cement mortar is the most widely used building compound made by mixing cement and fine aggregates with the required amount of water in compliance with Indian standard code, IS 2250-1981. It is basically used as a paste for binding together of various construction blocks such as bricks, stones, cinder blocks, etc and other forms of masonry such as plastering over bricks or other. The quality of cement mortar is characterized in terms of its mobility, placeability, water retention, strength and durability and depends upon its constituent materials. A good mortar should be economic, easily workable, capable of good adhesion, durable and resistant to chemical attack.
Microsilica is a grey colored powder, somewhat similar to Portland cement or some fly ashes with particle size approximately 150nm. It is defined as very fine non-crystalline silica that is produced in electric arc furnaces as a by-product during production of alloys containing silicon or elemental silicon. The production of microsilica involves the reduction of high purity quartz (SiO2) in electric arc furnaces at temperatures in excess of 2,000°C.
METHODOLOGY
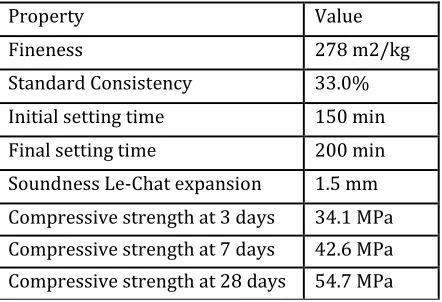
Table 1 Physical characteristics of cement
Property Value
Fineness 278 m2/kg
Standard Consistency 33.0%
Initial setting time 150 min
Final setting time 200 min
Soundness Le-Chat expansion 1.5 mm
Compressive strength at 3 days 34.1 MPa Compressive strength at 7 days 42.6 MPa Compressive strength at 28 days 54.7 MPa
Table 2 Chemical composition of cement
Oxides % by mass
3
2 2 3 2 3
CaO-0.7SO
2.8 SiO
1.2Al O
0.65Fe O
0.82 2 3 2 3
Al O
Fe O
1.26Insoluble residue 2.63
Magnesia 1.08
Sulphuric anhydride 2.60
Total Chlorides 0.010
[image:2.612.186.428.474.593.2]LOI 0.96
Table 3 Physical characteristics of microsilica
Property Value
Particle size (typical) <1 µm
Bulk density As-produced 135–475 kg/m3
Bulk density Slurry 1,420–1,540 kg/m3
Bulk density Densified 550–700 kg/m3
Specific gravity 2.22
Surface area (BET) 12,500–27,000 m2/kg
Table 4 Chemical composition of microsilica
Oxides % by mass
SiO2 98
Al2O3 0.03
Fe2O3 0.02
CaO 0.5
© 2019, IRJET | Impact Factor value: 7.34 | ISO 9001:2008 Certified Journal
| Page 369
SO3 -
[image:3.612.212.404.153.242.2]LOI 2.8
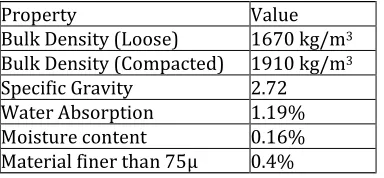
Table 5 Physical characteristics of Fine Aggregate
Property Value
Bulk Density (Loose) 1670 kg/m3
Bulk Density (Compacted) 1910 kg/m3
Specific Gravity 2.72
Water Absorption 1.19%
Moisture content 0.16%
Material finer than 75µ 0.4%
Table 6 Physical characteristics and chemical composition of water
Property Value
Volume of 0.02 N H2SO4 to neutralize 100 mL of water using mixed indicator 23.9 mL
Volume of 0.02 N NaOH to neutralize 100 mL of water using phenolphthalein 0.5 mL
Organic components 135 mg/L
Inorganic solids 465 mg/L
Sulphates 9.2 mg/L
Total Chlorides 85.6 mg/L
Suspended matter <1
pH 6.79
Table 7. Description of Mortar Mixes
Designation Microsilica (%)
NM 0%
M1 3%
M2 6%
M3 9%
M4 9%
Fine aggregate was procured from the local available source and conformed to Indian Standard Specifications, IS: 383-1970. A lump of clay and other foreign materials were separated out carefully. Sand was washed and dried before testing. It was sieved through 4.75 mm sieve and conformed to grading zone II.
The physical characteristics of Fine aggregate have been given in table 5. The water used for the cement mortar was the potable water as supplied in the structures laboratory. The physical characteristics and chemical composition of water have been given in table 6.
CASTING OF MORTAR CUBES
Mortar of one part of cement and 3 parts of sand was prepared. Quantity of material for one cube was calculated 800gm which contain 200gm of cement and 600gm of sand. Quantity of water was calculated using consistency of cement.
Water required for casting one cube of mortar = (P/4+3) % of total material
The dimensions of cubes are 70.6mmx70.6mmx70.6mm. Cement, sand and water were hand mixed and the mix was placed in the cubes in three layers in each layer 25 blows of tamping rod were given for proper compaction. The mix was prepared using different proportions of microsilica ranging from 3% to 12%. Description of Mortar Mixes was given in table 7.
RESULTS & DISCUSSION
CONSISTENCY OF MORTAR
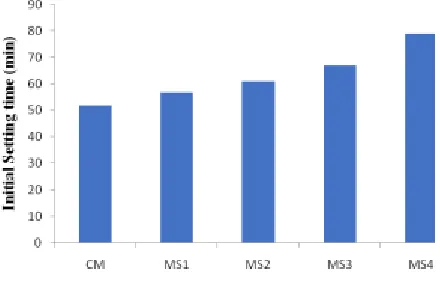
[image:4.612.194.409.256.397.2]The observed values of consistency of mortars, without and with replacement of cement with microsilica plotted in fig 1. The consistency of mortars increased with increasing percentage of microsilica from 3% to 12%. The consistency of the mortar is related to the fineness of the particles present in the mortar. The particles of microsilica has greater specific surface of the particles. As the percentage of microsilica increases, the hydration process is faster and the water required for the hydration increases, resulting in an increase in consistency of mortars.
Fig 1. Consistency of mortars
SETTING TIME OF MORTAR
[image:4.612.199.419.486.628.2]The observed values of setting time of mortars, without and with replacement of cement with microsilica have been plotted in fig 2. The setting time of mortars increased with increasing percentage of microsilica from 3% to 12%.
© 2019, IRJET | Impact Factor value: 7.34 | ISO 9001:2008 Certified Journal
| Page 371
Fig 3. Final Setting time of mortars
Fig4. Flow of mortars
The setting time of the mortar is related to the thickness of the mortars. The particles of microsilica are fines, the thickness of the mortars decreased. As the percentage of microsilica increased, the thickness of the mortars decreased further and the setting process gets decelerated, resulting in an increase in setting time of mortars.
FLOW OF MORTAR
The observed values of flow of mortars, without and with replacement of cement with microsilica have been plotted in fig 4. The flow of mortars was found to decrease with increasing percentage of microsilica from 3% to 12%. The flow of the mortar is related to the fineness of the particles and the specific surface of the particles present in the mortar. The particles of microsilica has greater specific surface of the particles and result in better packing of the cement matrix. As the percentage of microsilica increases, the packing of the cement matrix is enhanced and the empty spaces in the matrix are better filled. As a result, water cannot bleed over the surface of the matrix. This increases the stiffness of the mortars resulting in a decrease in flow of mortars.
COMPRESSIVE STRENGTH OF MORTAR
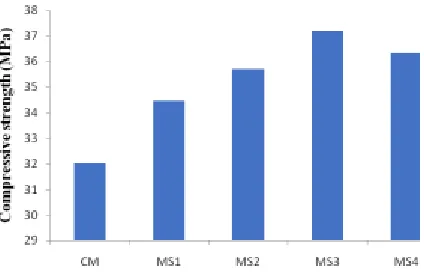
3 DAYS
Fig 5. Compressive strength of mortars at 3 days
Fig 6. Compressive strength of mortars at 7 days
The mix M1, M2 and M3 showed an increase of 5.97%, 9.17% and 13.33%, but M4 showed an increase of 12.10% as compared to MM. The maximum compressive strength was observed for M3 as 29.42 MPa.
7 DAYS
The compressive strength of control mix (MM) was found to be 32 MPA at 7 days curing age. The compressive strength of all the mortar mixes, M1, M2, M3 and M4 (with replacement of cement with microsilica) at 7 days was higher as compared to MM as plotted in fig 6.
© 2019, IRJET | Impact Factor value: 7.34 | ISO 9001:2008 Certified Journal
| Page 373
Fig 7. Compressive strength of mortars at 28 days
Fig 8. Compressive strength of mortars at 56 days
28 DAYS
The compressive strength of control mix (MM) was found to be 32 MPA at 7 days curing age. The compressive strength of all the mortar mixes, M1, M2, M3 and M4 (with replacement of cement with microsilica) at 28 days was higher as compared to MM as plotted in fig 7.
However, it was found that the compressive strength of mortars increased with increasing percentage of microsilica from 3% to 9%, but decreased at 12% percentage of microsilica. The mix M1, M2 and M3 showed an increase of 10.45%, 15.06% and 18.68%, but M4 showed an increase of 17.17% as compared to MM. Thus, the similar trend in compressive strength as that observed at 3 days of curing age was observed. Further, the maximum compressive strength was observed for M3 as 47.91 MPa.
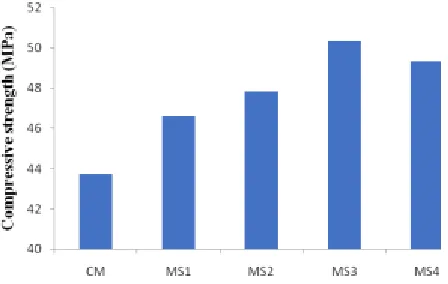
56 DAYS
The compressive strength of control mix (MM) was found to be 32 MPA at 7 days curing age. The compressive strength of all the mortar mixes, M1, M2, M3 and M4 (with replacement of cement with microsilica) at 56 days was higher as compared to MM as plotted in fig 8. However, it was found that the compressive strength of mortars increased with increasing percentage of microsilica from 3% to 9%, but decreased at 12% percentage of microsilica. The mix M1, M2 and M3 showed an increase of 6.44%, 9.28% and 15.04%, but M4 showed an increase of 12.68% as compared to MM. Thus, the similar trend in compressive strength as that observed at 3 days of curing age was observed. Further, the maximum compressive strength was observed for M3 as 50.34 MPa.
activity of microsilica, a pozzolanic material. Hydration of cement produces calcium hydroxide and results in pores in the cement matrix. Microsilica reacts with calcium hydroxide and produces calcium silicate hydrate gel and fills the pores of the cement matrix. As a result, compressive strength of the cement mortars increases.
[image:8.612.113.506.206.416.2]Further, as the percentage of microsilica in cement matrix is increased, the pozzolanic effect of microsilica is increased and compressive strength of the cement mortars is enhanced. However, the sudden decrease in compressive strength at higher percentage of microsilica can be attributed to the reason that higher percentage of microsilica can result in friction among particles leading to reduced packing and hence reduced compressibility.
Fig 9. Compressive strength of mortars as a function of curing age
EFFECT OF CURING DAYS
The data was further comparatively analyzed in terms of age of curing days at 3, 7, 28 and 56 days. The compressive strength of control mix (MM) was found to increase from 3 days to 56 days of curing as plotted in fig 9. Similar behavior was observed in all the mortar mixes with replacement of microsilica. The percentage increase in compressive strength of MM was found as 23.27%, 55.51% and 68.57% at 7 days, 28 days and 56 days of curing as compared to compressive strength at 3 days. The percentage increase in compressive strength of M1 was 25.30%, 62.09% and 69.32% at 7 days, 28 days and 56 days of curing as compared to compressive strength at 3 days. The percentage increase in compressive strength of M2 was 25.97%, 63.90% and 68.74% at 7 days, 28 days and 56 days of curing as compared to compressive strength at 3 days. The percentage increase in compressive strength of M3 was 26.41%, 62.85% and 71.11% at 7 days, 28 days and 56 days of curing as compared to compressive strength at 3 days. The percentage increase in compressive strength of M4 was 24.85%, 62.54% and 69.45% at 7 days, 28 days and 56 days of curing as compared to compressive strength at 3 days.
© 2019, IRJET | Impact Factor value: 7.34 | ISO 9001:2008 Certified Journal
| Page 375
CONCLUSIONSOn the basis of this study, the following conclusions can be stated:
1. Replacement of cement with microsilica leads to increase in consistency and delay of the setting process. This also increases the stiffness of the mortar and decrease of the flow.
2. The compressive strength of all the mortar mixtures containing microsilica from 3%, 6%, 9% and 12% was higher as compared to the mortar mixture without microsilica.
3. The compressive strength all the mortar mixes increased with increase in age. Thus, the 56 days compressive strength of all the mortar mixes were found to be higher as compared to the compressive strength at 3 days.
4. The compressive strength of the mortar mixes with replacement of cement with microsilica increased with increase in percentage of microsilica from 3% to 9%, but decreased to some extent at 12% of microsilica.
REFERENCES
1. R. Gopalakrishnan, “Compressive strength and electron microscopy studies on Nanosilica admixtured cement mortar,” vol. 7, no. 2, pp. 504–509, 2015.
2. R. E. Nuñez, “Performance of Chlorides Penetration and Corrosion Resistance of Mortars with Replacements of Rice Husk Ash and Nano-SiO2,” vol. 10, pp. 332–346, 2015.
3. N. J. Saleh, R. I. Ibrahim, and A. D. Salman, “Characterization of nano-silica prepared from local silica sand and its application in cement mortar using optimization technique,” Adv. Powder Technol., no. June, 2015.
4. P. Stynoski, P. Mondal, and C. Marsh, “Effects of silica additives on fracture properties of carbon nanotube and carbon fiber reinforced Portland cement mortar,” Cem. Concr. Compos., vol. 55, pp. 232–240, 2015.
5. S. a. Abo-El-Enein, G. El-kady, T. M. El-Sokkary, and M. Gharieb, “Physico-mechanical properties of composite cement pastes containing microsilica and fly ash,” HBRC J., 2014.
6. Lilkov, I. Rostovsky, O. Petrov, Y. Tzvetanova, and P. Savov, “Long term study of hardened cement pastes containing microsilica and fly ash,” Constr. Build. Mater., vol. 60, pp. 48–56, 2014.
7. M. Ramezanianpour and R. D. Hooton, “A study on hydration, compressive strength, and porosity of Portland-limestone cement mixes containing SMMs,” Cem. Concr. Compos., vol. 51, pp. 1–13, 2014.
8. M. E.-S. I. Saraya, “Study physico-chemical properties of blended cements containing fixed amount of microsilica, blast furnace slag, basalt and limestone, a comparative study,” Constr. Build. Mater., vol. 72, pp. 104–112, 2014.
9. Y. Deng, C. Zhang, and X. Wei, “Influence of lithium sulfate addition on the properties of Portland cement paste,” Constr. Build. Mater., vol. 50, pp. 457–462, 2014.
10. Y. Li and a. K. H. Kwan, “Ternary blending of cement with fly ash microsphere and condensed microsilica to improve the performance of mortar,” Cem. Concr. Compos., vol. 49, pp. 26–35, 2014.
11. Y. Senhadji, G. Escadeillas, M. Mouli, H. Khelafi, and Benosman, “Influence of natural pozzolan, microsilica and limestone fine on strength, acid resistance and microstructure of mortar,” Powder Technol., vol. 254, pp. 314–323, 2014.
12. S. W. M. Supit and F. U. A. Shaikh, “Effect of Nano-CaCO3 on Compressive Strength Development of High Volume Fly Ash
Mortars and Concretes,” J. Adv. Concr. Technol., vol. 12, no. 6, pp. 178–186, 2014.
13. P. Hou, X. Cheng, J. Qian, and S. P. Shah, “Effects and mechanisms of surface treatment of hardened cement-based materials with colloidal nanoSiO2 and its precursor,” Constr. Build. Mater., vol. 53, pp. 66–73, 2014.
15. R. Yu, P. Spiesz, and H. J. H. Brouwers, “Effect of nano-silica on the hydration and microstructure development of Ultra-High Performance Concrete (UHPC) with a low binder amount,” Constr. Build. Mater., vol. 65, pp. 140–150, 2014.
16. K. M. Kim, Y. S. Heo, S. P. Kang, and J. Lee, “Effect of sodium silicate- and ethyl silicate-based nano-silica on pore structure of cement composites,” Cem. Concr. Compos., vol. 49, pp. 84–91, 2014.
17. F. U. a Shaikh, S. W. M. Supit, and P. K. Sarker, “A study on the effect of nano silica on compressive strength of high volume fly ash mortars and concretes,” Mater. Des., vol. 60, pp. 433–442, 2014.
18. T. Bahaa, “Effect of Utilizing Nano and Micro Silica on Early Properties of Cement Mortar,” vol. 29, no. 3, pp. 370–382, 2014.
19. S. Abd.el.aleem, M. Heikal, and W. M. Morsi, “Hydration characteristic, thermal expansion and microstructure of cement containing nano-silica,” Constr. Build. Mater., vol. 59, pp. 151–160, 2014.
20. H. Biricik and N. Sarier, “Comparative study of the characteristics of nano silica - , microsilica - and fly ash - incorporated cement mortars,” Mater. Res., vol. 2, no. ahead, pp. 15–26, 2014.
21. S. Gupta, “Application of Microsilica and Nanosilica in Cement and Concrete – A Review,” pp. 85–98, 2014.
22. N. Conference, E. Trends, and M. Engineering, “National Conference on Emerging Trends in Civil and Mechanical Engineering, CDGI, Indore, India, Oct. 11, 2014 1,” 2014.
23. M. Rashad, “A comprehensive overview about the effect of nano-SiO2 on some properties of traditional cementitious
materials and alkali-activated fly ash,” Constr. Build. Mater., vol. 52, pp. 437–464, 2014.
24. S. Haruehansapong, T. Pulngern, and S. Chucheepsakul, “Effect of the particle size of nanosilica on the compressive strength and the optimum replacement content of cement mortar containing nano-SiO2,” Constr. Build. Mater., vol. 50, pp.
471–477, 2014.