For the future, it is important to further under-stand the influence of fertilization on the dynamics of plant nutrients in the soil as well as its influence on the plant growth. The content of bioavailable nutrients in soils varies not only depending on the fertilizer used, but also on the seasonal influence, soil properties and many other factors. Therefore, the data of the long-term field experiments pro-vide valuable information for optimizing fertiliza-tion applicafertiliza-tions (Johnston 1997, Scherer 2001, Hejcman et al. 2012, Neugschwandtner et al. 2014).
Mineral sulfur (S) deficiency is an actual problem in many sites (Eriksen 2005, Lehmann et al. 2008, Balík et al. 2009, Scherer 2009 and others). The content of mineral sulfur forms in soil rapidly decreased in last 25 years (Balík et al. 2009, Scherer 2009). Although sulfur has been known as an essential element for plant growth for over two centuries, intentionally
S fertilizing was not realized before 1980’s. At that time the most of the cultivated plants did not show evidence of S deficiency, because of air pollution from industry, intensive application of mineral fertilizers containing S as the ballast substance, application of manure and cropping of plant cultivars with lower S uptake in crop rotation (Zhao et al. 1999, Scherer 2001, Blair 2002).
From the mentioned reasons it may be expected that sulfur becomes a limiting factor for yield for-mation and product quality (Eriksen et al. 2004). Therefore, it is necessary to pay attention to the sulfur fertilization possibilities under different soil-climatic conditions.
The total soil sulfur appears in two basic forms: (i) organic and (ii) inorganic. Inorganic sulfur, on which is mainly focused this manuscript, represents usually less than 10% from total S (Tisdale et al.
Evaluating of soil sulfur forms changes under different
fertilizing systems during long-term field experiments
M. Kulhánek, J. Balík, J. Černý, O. Sedlář, F. Vašák
Department of Agro-Environmental Chemistry and Plant Nutrition, Faculty
of Agrobiology, Food and Natural Resources, Czech University of Life Sciences
in Prague, Prague, Czech Republic
ABSTRACT
The aim of this work was to evaluate the changes of different soil sulfur forms during long-term field experiments supplied with sewage sludge (SS), farmyard manure (FYM) or mineral fertilizers. The experiment was established at three different sites with the crop rotation of potatoes, wheat and barley. Fertilizing system was based on the same nitrogen dose per the whole crop rotation. Soil samples from the beginning of the experiment (1996) and at the end of each crop rotation were analysed after all three crops harvest. Similar tendencies of changes in water extractable (Sw), adsorbed (Sads), 1 mol/L HCl estimated (SHCL) sulfur and their sum of (∑S) related to the fertilizing systems were observed among all studied sites. A decreasing tendency of ∑S in soil was observed during the experiment (ex-cept for the year 2005). The biggest decrease was always visible compared to control treatment. Mineral fertilizers (S added with superphosphate) appeared to be the best source of SHCL. Application of SS increased the Sw content in soil samples after potatoes harvest, whereas a decreasing tendency among the following crops was visible. Con-tents of other S forms (Sw at control, FYM and mineral fertilizers included) were usually balanced during the crop rotation.
Keywords: plant nutrient; fertilization; sulfur fractions; sulfur deficiency; essential element
1993, Wang et al. 2006, Förster et al. 2012) and ap-pears in different forms. The most important form for S uptake by plants is bioavailable sulfate (SO42–) in the soil solution. This form represents usually only about 1% of total S (Knauff 2000). Another form is sulfate adsorbed to weak binding sites on the surface of soil particles. It directly influences the perseveration of the sulfate balance with the soil solu-tion (McLaren and Cameron 1996). The most stable mineral S form represents sulfur co-precipitated with calcium and magnesium carbonates (Tisdale et al. 1993, Chen et al. 1997). Mentioned forms are possible to estimate using different sequential extrac-tion methods, for example after Shan et al. (1992).
Therefore, the aim of this work is to evaluate the changes of water extractable (Sw), adsorbed (Sads) and 1 mol/L HCl estimated (SHCL) sulfur forms under different fertilizing systems (sewage sludge (SS), farmyard manure (FYM) and mineral fertilizer) compared to the zero control during the long-term field experiments.
MATERIAL AND METHODS
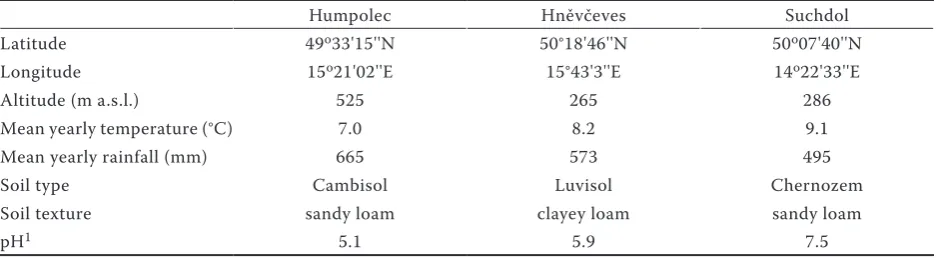
The long-term field experiment was established at experimental fields of the Czech University of Life Sciences in Prague and Crop Research Institute in Prague-Ruzyně (Czech Republic). The basic characteristics of the sites are given in Table 1.
Potatoes, winter wheat and spring barley were cropped in crop rotation on small plots (60 m2). All three crops were cropped parallel each year of the experiment. Organic fertilizers were applied only to the potatoes in crop rotation. The total amounts of N, P, K, Ca, Mg and S added per one
crop rotation in different fertilizing treatments are summarized in Table 2.
For this experiment, SS from a wastewater treat-ment plant in Prague-Troja was used. The whole system of fertilizing is based on the uniform amount of 330 kg N/ha per 3 years (expect of unfertilized control).
Archive air-dried soil samples (< 2 mm) from the beginning (year 1996) of the experiment and from the end of each crop rotation (years 1999, 2002, 2005, 2008, 2011 and 2014) were chosen for analysis. All samples were taken after harvest of each single crop in crop rotation and before fertiliz-ers application. Each sample was analysed in two replications. The samples were extracted to obtain water extractable, 0.032 mol/L NaH2PO4 extract-able adsorbed and 1 mol/L HCl extractextract-able sulfur fractions (Morche 2008, Kulhánek et al. 2011). All extracts were measured using inductively coupled plasma-optical emission spectroscopy (ICP-OES, Varian VistaPro, Mulgrave, Australia). The content of total estimated sulfur (∑S) was calculated like a sum of Sw, Sads and SHCL.
For the basic statistical evaluation and excluding the outlaying observations, Statistica software was used (StatSoft Inc. 2015). Thereafter, the tenden-cies in sulfur fractions changes were evaluated in Microsoft Office Excel (Excel 2007).
RESULTS AND DISCUSSION
[image:2.595.64.535.611.740.2]The contents of different sulfur forms at the beginning of the experiment (year 1996) are men-tioned in Table 3. The values of Sw were very similar among the studied sites (about 11 mg Sw/kg). The amounts of Sads ranged between 5.97 and 9.44 mg
Table 1. Characteristics of experimental fields
Humpolec Hněvčeves Suchdol
Latitude 49o33'15''N 50°18'46''N 50o07'40''N
Longitude 15o21'02''E 15°43'3''E 14o22'33''E
Altitude (m a.s.l.) 525 265 286
Mean yearly temperature (°C) 7.0 8.2 9.1
Mean yearly rainfall (mm) 665 573 495
Soil type Cambisol Luvisol Chernozem
Soil texture sandy loam clayey loam sandy loam
pH1 5.1 5.9 7.5
1Estimated in 0.01 mol/L CaCl
Sads/kg. The biggest differences were found in the SHCL contents, where the values reached from 5.35–22.8 mg SHCL/kg. The highest SHCL contents (Suchdol and Hněvčeves sites) are also reflected in the differences among the ∑S contents. Due to the used ICP-OES method to estimate different sulfur forms, it has to be taken into account that not only inorganic sulfur forms, but also some organic S compounds were estimated (Kowalenko and Grimmett 2007). For this reason, the better way is to use ion chromatography like e.g. in Förster et al. (2012). Anyway, the ICP-OES method was used, because for our purposes it can be success-fully used as well (Kowalenko and Grimmett 2007, Morche 2008, Kulhánek et al. 2011).
In the further evaluation of the experiment (in order to eliminate the plots variability) the data from the year 1996 (before fertilizing) were converted to 100%. The data from the following years were then compared with the year 1996. For the better transparency, the average contents of studied sulfur forms were calculated for each evaluated year. The changes of estimated soil sulfur forms related to different crops in crop rotation and terms of the fertilizers application are mentioned further.
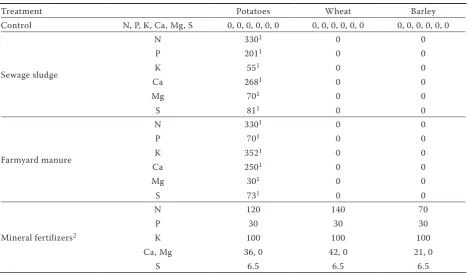
[image:3.595.64.533.110.383.2]Figure 1 shows the changes in estimated sulfur fractions at Suchdol site. The Sw content was always the highest in the SS treatment. This treatment is followed by fertilizing with FYM. It was probably Table 2. Application rates of macronutrients (kg/ha) – 3-year cycle
Treatment Potatoes Wheat Barley
Control N, P, K, Ca, Mg, S 0, 0, 0, 0, 0, 0 0, 0, 0, 0, 0, 0 0, 0, 0, 0, 0, 0
Sewage sludge
N 3301 0 0
P 2011 0 0
K 551 0 0
Ca 2681 0 0
Mg 701 0 0
S 811 0 0
Farmyard manure
N 3301 0 0
P 701 0 0
K 3521 0 0
Ca 2501 0 0
Mg 301 0 0
S 731 0 0
Mineral fertilizers2
N 120 140 70
P 30 30 30
K 100 100 100
Ca, Mg 36, 0 42, 0 21, 0
S 6.5 6.5 6.5
1P, K, Ca, Mg and S dose was calculated based on the average nutrient content in organic fertilizers. N application
rate was based on the fertilizers analyses. 2Mineral fertilizers used: N – calcium ammonium nitrate (27% N); P – triple
superphosphate (21% P, 3% S); K – potassium chloride (50% K)
Table 3. The contents of estimated sulfur forms in the year 1996 (mg S/kg soil)
Sw Sads SHCL ∑S
Suchdol 10.40 ± 0.98 7.46 ± 0.72 22.8 ± 4.64 40.7 ± 5.00 Humpolec 12.3 ± 0.77 9.44 ± 0.72 15.6 ± 1.03 37.3 ± 1.75 Hněvčeves 10.5 ± 0.76 5.97 ± 0.38 5.35 ± 0.54 21.8 ± 1.19
[image:3.595.68.531.670.741.2]due to the slightly higher S dose applied using SS and better SS mineralization described further.
The lowest contents of Sw were always found in the treatment fertilized with mineral fertilizers. It is the treatment where the highest yields of all studied crops were reported (Černý et al. 2010). Therefore, the higher yields probably resulted in the higher sulfur uptake by plants and lower con-tents of Sw in comparison to the control treatment. Furthermore it is possible to assume that sulfate applied with mineral fertilizers is more prone to leaching and that S sequestration depends on both the fertilizer type and S application rate (Förster et al. 2012). This was confirmed at Hněvčeves site as well, but not at Humpolec site. The Sw and Sads contents estimated at Humpolec site were almost always higher compared to Suchdol and Hněvčeves. Therefore the bioavailable sulfur con-tent at Humpolec site was probably more sufficient to cover the plant uptake and unused sulfur added with mineral fertilizers caused the higher values of Sw compared to control.
The contents of Sads were relatively low and ranged between 3.80 and 10.6 mg Sads/kg. There
were no big differences between the studied fer-tilizing treatments. The lowest Sads contents were always found in the control treatment without fertilizing. The rest of the studied treatments showed almost the same tendencies. It can be par-tially explained due to the fact, that SO42– adsorp-tion is strongly pH-dependent and increases with decreasing pH (Förster et al. 2012). In our case, the lowest pH after 14 years of experiment was measured in the control treatment at Suchdol site. Similar results were observed at Lukavec site (soil-climatic conditions are comparable with Humpolec site) where the lowest pH values were measured at mineral fertilizers and control treatment. Only at Hněvčeves site, the highest pH decrease was observed at mineral fertilizers treatment followed by SS and control (Vašák et al. 2015). The second reason for the lowest Sads contents in the control could be the lowest S input at this treatment. Location and climatic conditions of different sites play important role as well (Förster et al. 2012).
The SHCL form in soil showed interesting ten-dencies. The amounts of SHCL among the FYM, SS and control treatment were very similar dur-20
40 60 80 100 120 140 160
Control SS FYM
Mineral fertilizers Sw
20 40 60 80 100 120 140
160 Sads
20 40 60 80 100 120 140
160 SHCL
20 40 60 80 100 120 140 160
1996 1999 2002 2005 2008 2011 2014
[image:4.595.64.516.92.392.2]∑S
Figure 1. Changes of sulfur contents (%) at Suchdol site between 1996 and 2014. Sw – water extractable; Sads – adsorbed; SHCL – 1 mol/L HCl estimated; ∑S – total estimated sulfur
(a) (b)
(c) (d)
20 40 60 80 100 120 140 160 Control SS FYM Mineral fertilizers Sw 20 40 60 80 100 120 140 160 S HCL 20 40 60 80 100 120 140 160 Sads 20 40 60 80 100 120 140 160
1996 1999 2002 2005 2008 2011 2014
∑S
ing the studied period, but the highest content was always found in the treatment fertilized with mineral fertilizers. This is probably due to the fact that almost whole sulfur added in the form of superphosphate (6.5 kg S/ha/year) was in the calcium sulfate form. This tendency was confirmed at all studied sites. Suchdol site has about 2.5% of carbonates; sulfur estimated using 1 mol/L HCl was probably mostly in Ca and Mg coprecipitated form. However, the results of Morche (2008) show that soils with less than 1% CaCO3 provide evidence that most of the S extracted with 1 mol/L HCl is organically bound sulfur. Moreover, some other HCl soluble minerals (e.g. Fe and Al oxides and sulfates), mainly in non-calcareous, acidic soils can contribute to this S fraction as indicated by Chen et al. (1997).
The sum of estimated sulfur forms was influ-enced by the high amount of SHCL in the mineral fertilizers treatment. There is a visible decreasing tendency of ∑S content in soil during the experi-ment, especially in the control treatment. It can be explained by the fact that the sulfur inputs to the soil strongly decreased at the end of 20th century (Balík et al. 2009, Scherer 2009).
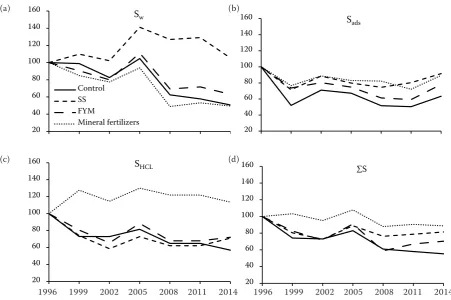
Figure 2 shows the tendencies in mineral soil sulfur changes at Humpolec site during the experi-ment. The highest Sw contents were found in the SS treatment. This treatment was again followed by FYM. Compared to Suchdol site, the lowest Sw content was always obtained in the control treatment; probable reasons are discussed above.
SS also appeared as a good source of Sads. Only in this treatment, the level of Sads was higher in the end of the experiment compared to its beginning. The differences among following fertilizing treat-ments (control, FYM and mineral fertilizers) were not clearly visible during the whole experiment.
The average content of SHCL (calculated for con-trol) during the whole experiment was 10.5 mg SHCL/kg. It is the value about 7.5 mg SHCL/kg lower compared to Suchdol site. The soil from Humpolec site contains less than 0.35% of carbonates. As dis-cussed before, estimated sulfur was probably mainly in organic form (Morche 2008). Nevertheless, the SHCL contents were always the highest in mineral fertilizers treatment in each studied site and year. Therefore, it is assumed that the differences be-tween this treatment and others were mainly caused
20 40 60 80 100 120 140 160 Control SS FYM Mineral fertilizers Sw 20 40 60 80 100 120 140 160 S HCL 20 40 60 80 100 120 140 160 S ads 20 40 60 80 100 120 140 160
1996 1999 2002 2005 2008 2011 2014
∑S
[image:5.595.64.531.424.729.2]1996 1999 2002 2005 2008 2011 2014 1996 1999 2002 2005 2008 2011 2014
Figure 2. Changes of sulfur contents (%) at Humpolec site between 1996 and 2014. Sw – water extractable; Sads – adsorbed; SHCL – 1 mol/L HCl estimated; ∑S – total estimated sulfur
(a)
(c)
(b)
20 40 60 80 100 120 140 160
Control SS
FYM Mineral fertilizers Sw
60 110 160 210
SHCL
20 40 60 80 100 120 140
160 Sads
20 40 60 80 100 120 140 160
1996 1999 2002 2005 2008 2011 2014 ∑S
due to the calcium-bound sulfates contained in superphosphate estimated with 1 mol/L HCl as well. This was also confirmed at Hněvčeves site, which has about 0.7% of carbonates. This fact par-tially prove the statement of Kulhánek et al. (2011) who estimated the increasing content of occluded sulfur in soil after calcium sulfate S application at three different sites in three year experiment.
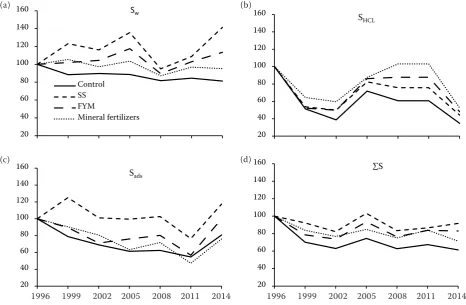
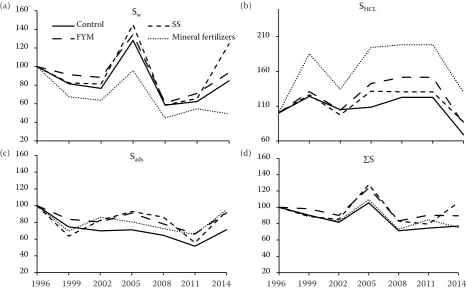
Figure 3 shows the results from Hněvčeves site. The differences between studied years are the most visible here. Especially the contents of Sw sulfur in the year 2005 are higher compared to other years. In spite of this fact, the differences among the fertilizing treatments are clearly visible as well as on the other sites. The lowest contents of Sw, like at Suchdol site, were always found in the mineral fertilizers treatment. Thereafter follows the control treatment. Treatments fertilized with SS and FYM showed quite similar results, which were higher than mineral fertilizers and control. Control treatment showed usually the lowest values of Sads. Differences between other fertiliz-ing systems were not clearly visible. Curtin et al. (2007) studied the influence of long-term
applica-tion of S in the form of single superphosphate on the content of Sads in long-term experiment. They found the significantly increasing tendency with both superphosphate doses (7 and 14 kg S/ha/year) against zero control. In our experiments, only 6.5 kg S/ha/year was added as superphosphate. Therefore, the differences between control and mineral fertilizers were not so clearly visible, but the Sads contents in the mineral fertilizers treat-ment were almost always higher in comparison to control among all three studied sites and seasons.
The studied S forms content increase is typical for all three sites in the year 2005. It was prob-ably caused due to the weather conditions in this year, which were optimal for the mineralization of the organic sulfur sources (higher rainfall in July and August together with higher temperatures in September) (CHMI 2016). It confirms the role of climatic conditions on the soil S fractions contents mentioned in Förster et al. (2012).
The differences between soil sulfur contents related to the crops in crop rotation were also evaluated. Almost in all cases, the highest con-tents of Sw were clearly visible in samples taken 20
40 60 80 100 120 140 160
Control SS
FYM Mineral fertilizers Sw
60 110 160 210
SHCL
20 40 60 80 100 120 140
160 Sads
20 40 60 80 100 120 140 160
[image:6.595.64.531.95.385.2]1996 1999 2002 2005 2008 2011 2014 ∑S
Figure 3. Changes of sulfur contents (%) at Hněvčeves site between 1996 and 2014. Sw – water extractable; Sads – adsorbed; SHCL – 1 mol/L HCl estimated; ∑S – total estimated sulfur
1996 1999 2002 2005 2008 2011 2014 1996 1999 2002 2005 2008 2011 2014
(b) (a)
up in the SS treatment after potatoes harvest. At the next crops in crop rotation (wheat and barley) a decreasing tendency follows. This was caused because SS was always applied only before the po-tatoes for the whole crop rotation. This tendency appeared in a lesser extent among the Sads and ∑S as well, but not among the SHCL. A similar result was expected during FYM fertilizing, but the contents of three measured S forms did not change during the crop rotation. It is probably due to the fact that in the FYM sulfur is in more stable organic forms compared to SS. That confirms the study of Lima et al. (2009), who estimated the long-term influence of SS or FYM application and found significantly higher organic matter (especially lignin and lignin-like products) accumulation in the FYM treatment. The second reason of lower Sw content among the FYM treatment can be the fact that its long-term application led to the S accumulation in the dry soil aggregates (Yang et al. 2007) whose size increased with the increasing organic fertilizers rate (Scherer et al. 2012). After Scherer et al. (2012) the soil particle size plays the key role in the S availability, where the content of plant available S decreases with the increasing soil particle size, while the influence of the kind and amount of used organic fertilizers (FYM, SS and composts) is negligible. The above-mentioned fact also partially confirms the results of Odlare et al. (2008) who compared the microbial activity in soil after SS or cattle manure application. They found slightly higher microbial activity in soil after SS application. Based on the results of Sastre et al. (1996), SS had a positive influence on microbial activity in soil and due to this process on the or-ganic matter decomposition as well. According to Tabatabai and Chae (1991) SS has also more optimal C:S ratio for organic compounds miner-alization compared to FYM. This confirmed also Förster et al. (2012) who stated that SS has a large pool of potentially mineralizable S. It was prob-ably the reason for Sw content increase in the SS treatment after potatoes harvest. As expected, the content of studied S forms did not change among control and mineral fertilizers treatments during the crop rotations.
Based on the results of our three long-term field experiments it can be concluded that a decreasing tendency of ∑S content is visible in the period from 1996 to 2014 (except for the year 2005). The biggest decrease is always visible in the control
treatment. SS application led to the highest Sw contents compared to the other fertilization treat-ments. Mineral fertilizers treatments appeared to be the best source of SHCL. The contents of studied sulfur forms in soil were (especially in the year 2005) influenced by the local climatic conditions as well.
REFERENCES
Balík J., Kulhánek M., Černý J., Száková J., Pavlíková D., Čermák P. (2009): Differences in soil sulphur fractions due to limita-tion of atmospheric deposilimita-tion. Plant, Soil and Environment, 55: 344–352.
Blair G.J. (2002): Sulphur fertilizers: A global perspective. Inter-national Fertiliser Society Proceedings, 498: 1–36.
Černý J., Balík J., Kulhánek M., Čásová K., Nedvěd V. (2010): Mineral and organic fertilization efficiency in long-term sta-tionary experiments. Plant, Soil and Environment, 56: 28–36. Chen B., Shan X.Q., Shen D.Q., Mou S.F. (1997): Nature of the
HCl-soluble sulfate in the sequential extraction for sulfur speciation in soils. Fresenius’ Journal of Analytical Chemistry, 357: 941–945. CHMI (2016): Czech Hydrometeorological Institute [online].
Available at: www: <portal.chmi.cz/historicka-data/pocasi/ zakladni-informace?l=en> (access 14.02.2016)
Curtin D., Beare M.H., McCallum F.M. (2007): Sulphur in soil and light fraction organic matter as influenced by long-term application of superphosphate. Soil Biology and Biochemistry, 39: 2547–2554.
Eriksen J. (2005): Gross sulphur mineralisation-immobilisation turnover in soil amended with plant residues. Soil Biology and Biochemistry, 37: 2216–2224.
Eriksen J., Thorup-Kristensen K., Askegaard M. (2004): Plant availability of catch crop sulfur following spring incorpora-tion. Journal of Plant Nutrition and Soil Science, 167: 609–615. Excel (2007): Microsoft Office Excel. Microsoft Office Enterprise
2007, USA.
Förster S., Welp G., Scherer H.W. (2012): Sulfur specification in bulk soil as influenced by long-term application of mineral and organic fertilizers. Plant, Soil and Environment, 58: 316–321. Hejcman M., Kunzová E., Šrek P. (2012): Sustainability of winter
wheat production over 50 years of crop rotation and N, P and K fertilizer application on illimerized luvisol in the Czech Republic. Field Crops Research, 139: 30–38.
Johnston A.E. (1997): The value of long-term field experiments in agricultural, ecological, and environmental research. Advances in Agronomy, 59: 291–333.
Kowalenko C.G., Grimmett M. (2007): Chapter 23: Chemical characterization of soil sulfur. In: Carter M.R., Gregorich E.G. (eds): Soil Sampling and Methods of Analysis. Boca Raton, CRC Press, 1224.
Kulhánek M., Černý J., Balík J., Vaněk V., Sedlář O. (2011): In-fluence of the nitrogen-sulfur fertilizing on the content of different sulfur fractions in soil. Plant, Soil and Environment, 57: 553–558.
Lehmann J., Solomon D., Zhao F.J., McGrath S.P. (2008): Atmos-pheric SO2 emissions since the late 1800s change organic sulfur forms in humic substance extracts of soils. Environmental Science and Technology, 42: 3550–3555.
Lima D.L.D., Santos S.M., Scherer H.W., Schneider R.J., Duarte A.C., Santos E.B.H., Esteves V.I. (2009): Effects of organic and inorganic amendments on soil organic matter properties. Geoderma, 150: 38–45.
McLaren R.G., Cameron K.C. (1996): Soil, plant and fertilizer sulphur. In: McLaren R.G., Cameron K.C. (eds): Soil Science. Auckland, Oxford University Press, 221–228.
Morche L. (2008): S-fluxes and spatial alterations of inorganic and organic sulphur fractions in soil as well as their accumu-lation and depletion in the rhizosphere of agricultural crops by partial use of the radioisotope 35S. [Ph.D. Thesis.] Bonn, University of Bonn, 322. (In German).
Neugschwandtner R.W., Liebhard P., Kaul H.-P., Wagentristl H. (2014): Soil chemical properties as affected by tillage and crop rotation in a long-term field experiment. Plant, Soil and Environment, 60: 57–62.
Odlare M., Pell M., Svensson K. (2008): Changes in soil chemical and microbiological properties during 4 years of application of various organic residues. Waste Management, 28: 1246–1253. Scherer H.W. (2001): Sulphur in crop production – Invited paper.
European Journal of Agronomy, 14: 81–111.
Scherer H.W. (2009): Sulfur in soils. Journal of Plant Nutrition and Soil Science, 172: 326–335.
Scherer H.W., Welp G., Förster S. (2012): Sulfur fractions in particle-size separates as influenced by long-term application of mineral and organic fertilizers. Plant, Soil and Environment, 58: 242–248.
Sastre I., Vicente M.A., Lobo M.C. (1996): Influence of the ap-plication of the sewage sludges on soil microbial activity. Bi-oresource Technology, 57: 19–23.
Shan X.Q., Bin C., Jin L.Z., Zheng Y., Hou X.P., Mou S.F. (1992): Determination of sulfur fractions in soils by sequential extrac-tion, inductively coupled plasma-optical emission spectroscopy and ion chromatography. Chemical Speciation and Bioavail-ability, 4: 97–103.
StatSoft Inc. (2015): Statistica (data analysis software system). ver. 12. Available at: www.statsoft.com
Tabatabai M.A., Chae Y.M. (1991): Mineralization of sulfur in soils amended with organic wastes. Journal of Environmental Quality, 20: 684–690.
Tisdale S.L., Nelson W.L., Beaton J.D., Havlin J.L. (1993): Soil Fertility and Fertilizers. New York, Macmillan Publishing Company, 634.
Vašák F., Černý J., Buráňová Š., Kulhánek M., Balík J. (2015): Soil pH changes in long-term field experiments with different fertilizing systems. Soil and Water Research, 10: 19–23. Wang J.K., Solomon D., Lehmann J., Zhang X.D., Amelung W.
(2006): Soil organic sulfur forms and dynamics in the Great Plains of North America as influenced by long-term cultivation and climate. Geoderma, 133: 160–172.
Yang Z.H., Singh B.R., Hansen S. (2007): Aggregate associated carbon, nitrogen and sulfur and their ratios in long-term fer-tilized soils. Soil and Tillage Research, 95: 161–171. Zhao F.J., Hawkesford M.J., McGrath S.P. (1999): Sulphur
as-similation and effects on yield and quality of wheat. Journal of Cereal Science, 30: 1–17.
Received on March 24, 2016 Accepted on August 8, 2016
Corresponding author: