1
Screening tests for detecting open angle glaucoma:
systematic review and meta-analysis
Graham Mowatt,1 Jennifer M. Burr,1,2 Jonathan A. Cook,1 M.A. Rehman Siddiqui,2
Craig Ramsay,1Cynthia Fraser,1 Augusto Azuara-Blanco,2 Jonathan J Deeks,3for the
OAG Screening Project Group
1Health Services Research Unit, Institute of Applied Health Sciences, College of Life
Sciences and Medicine, University of Aberdeen
2Eye Clinic, Aberdeen Royal Infirmary
3Department of Public Health and Epidemiology, University of Birmingham
Corresponding author: Graham Mowatt, Health Services Research Unit, 3rd Floor,
University of Aberdeen, Health Sciences Building, Foresterhill, Aberdeen AB25 2ZD,
UK; [email protected].
Funding
This paper was developed from a Health Technology Assessment on the clinical and
cost-effectiveness of screening for OAG, and funded by the UK National Institute for
Health Research Health Technology Assessment programme (project number
04/08/02). The authors’ work was independent of the funding source.
Word count: abstract, 250; main text excluding title page, abstract, tables, figures and
Purpose
To assess the comparative accuracy of potential screening tests for open angle
glaucoma (OAG).
Methods
Medline, Embase, Biosis (to November 2005), Science Citation Index (to December
2005) and The Cochrane Library (Issue 4 2005) were searched. Studies assessing
candidate screening tests for detecting OAG in people over 40 years of age that
reported true and false positives and negatives were included. Meta-analysis was
undertaken using the hierarchical summary receiver operating characteristic model.
Results
Forty studies enrolling over 48,000 people reported nine tests. Most tests were
reported by only a few studies. Frequency Doubling Technology (FDT) (C-20-1) was
significantly more sensitive than ophthalmoscopy (30, 95% credible interval (CrI) 0 to
62) and Goldmann applanation tonometry, (GAT), (45, 95% CrI 17 to 68), while
threshold standard automated perimetry (SAP) and Heidelberg Retinal Tomograph
(HRT II) were both more sensitive than GAT (41, 95% CrI 14 to 64 and 39, 95% CrI 3
to 64 respectively). GAT was more specific than both FDT C-20-5 (19, 95% CrI 0 to
53) and threshold SAP (14, 95% CrI 1 to 37). Judging performance by diagnostic odds
ratio, FDT, Oculokinetic perimetry and HRT II are promising tests. Ophthalmoscopy,
SAP, retinal photography and GAT had relatively poor performance as single tests.
These findings are based on heterogeneous data of limited quality and as such
Conclusions
No test or group of tests were clearly superior as glaucoma screening tests. Further
research is required to evaluate the comparative accuracy of the most promising
tests.
Introduction
Glaucoma describes a group of eye diseases in which there is progressive damage to
the optic nerve, leading to impaired vision and in some cases blindness if untreated.
Glaucoma is the leading cause of irreversible blindness worldwide,1,2 with open
angle glaucoma (OAG) the most common form.1 Late detection is a major risk factor
for blindness;1,3-5 it is estimated from population surveys that in developed countries,
more than 50% of prevalent OAG is undetected,6 and this estimate is likely to be
higher in developing countries. Recent evidence suggests that treatment is effective
at delaying progression,7,8 thus population based screening of OAG is under
consideration.6,9-11 For screening to be considered several criteria need to be met
regarding the condition, the test and the screening programme.9
Tests for glaucoma involve an assessment of structural changes at the optic
nerve head, functional visual loss by visual field testing, and the level of the
intraocular pressure (IOP). There are many potential tests or combinations of tests
for detecting glaucoma, however to date no single test or combination of tests has
been identified as an optimal screening ‘test’ for glaucoma.
The aim of this study was to assess the comparative accuracy of candidate
Methods
Search Strategy
Highly sensitive electronic searches, using both controlled vocabulary and free text
terms, were undertaken. We searched the following electronic databases: Medline
(1966 – November Week 3 2005), Medline In Process (23 February and 6 December
2005), Embase (1980 – 2005 Week 49), Science Citation Index (1981 – 3 December
2005), Biosis (1985 – 30 November 2005) and Cochrane Central Register of Controlled
Trials (CENTRAL) (The Cochrane Library, Issue 4 2005). In addition full text
electronic searches of the American Journal of Ophthalmology (1998 – November
2005), Ophthalmology (1998 – November 2005), British Journal of Ophthalmology
(1998 – November 2005), Investigative Ophthalmology & Visual Science (1998 –
November 2005) and the Journal of Glaucoma (2001 – November 2005) were
undertaken. Searches were restricted to English language publications. The
reference lists of included studies were scanned to identify additional potentially
relevant reports. Full details of the sources searched and search strategies used are
available elsewhere6or can be obtained by contacting the authors.
Inclusion and Exclusion Criteria
We included studies that assessed the accuracy of tests for detecting OAG in people
over 40 years of age who were likely to be representative of a screening situation (i.e.
no selection and no previous tests have been done) or of a glaucoma suspect
population (i.e. patients identified from prior testing as possibly having glaucoma or
having e.g., high IOP, or another risk factor for glaucoma but with an unconfirmed
diagnosis) Both randomised (where participants were randomised to one or more
reference standard was either confirmed OAG on follow-up or
ophthalmologist-diagnosed OAG as reported by the study. This latter reference standard required a
clinical judgement by an ophthalmologist including an evaluation of the optic nerve
and a measure of visual function. In addition the study had to either report or allow
the calculation of true and false positives and negatives.
Non-English language reports were excluded, as were conference abstracts.
Case reports and studies investigating technical aspects of a test were excluded.
Case-control studies where the control group consisted of people with no ocular
disease or specifically excluded people with other ocular disease, so that the
spectrum of disease and non-disease was unlike that to be encountered in a screening
situation, were also excluded. The spectrum of disease expected would be similar to
the spectrum of the disease of the general population (e.g., more patients with mild
glaucoma, less patients with severe glaucoma).
The candidate tests fell within the three broad categories of (a) structure
(ophthalmoscopy; optic disc photography; retinal nerve fibre layer (RNFL)
photography; Heidelberg retinal tomography (HRT) version II; GDx VCC retinal
nerve fibre layer (RNFL) analyser; optical coherence tomography (OCT); retinal
thickness analyser (RTA)), (b) function (oculokinetic perimetry (OKP);
white-on-white standard automated perimetry (SAP) including suprathreshold and threshold;
short wave-length automated perimetry (SWAP); frequency doubling technology
(FDT); motion detection perimetry (MDP)) and (c) IOP (Goldmann applanation
tonometry (GAT); non contact tonometry (NCT); Tonopen).
Two reviewers undertook single data extraction of the included studies. In the event
of any uncertainty, the other reviewer provided advice and validated the data
extraction.
Two reviewers independently assessed the quality of the included studies
using a version of QUADAS adapted for assessing reports of the accuracy of
screening tests for OAG. QUADAS is a quality assessment tool for use in systematic
reviews of diagnostic studies.12 Disagreements were resolved by consensus or
arbitration by a third reviewer. A ‘higher quality study’ was considered to be one
that was checked ‘yes’ to questions 1 (patient spectrum representative), 3 and 4
(partial and differential verification bias avoided) and 6 and 7 (test review bias and
diagnostic review bias avoided) of the adapted QUADAS checklist.
Statistical Methods
After data extraction a ‘common’ (most frequently reported) cutoff for each test was
selected following discussion by two ophthalmologists (JB, RS). Summary receiver
operating characteristic (SROC) curves were produced for each test where two or
more studies reported estimates of sensitivity and specificity at the common cutoff.
Meta-analysis models were fitted using the hierarchical summary receiver operating
characteristic (HSROC) model13 in WinBUGS 1.4.14 Normally distributed random
effects were assumed with non-informative uniform priors. No adjustment was
made for the correlation between results from paired studies, as the level of
information required is rarely reported. Summary sensitivity, specificity and
diagnostic odds ratios (DORs) at the operating point were reported for each model as
median and 95% credible interval (CrI). A DOR is a single indicator of test
relative to the odds of testing positive in those without the disease.15 It can be
calculated from the sensitivity and specificity:
DOR = (sensitivity /(1-sensitvity))/((1-specificity)/specificity)
Credible intervals are the Bayesian equivalent of confidence intervals. A
simplified model, which assumed a symmetrical ROC shape, was used where limited
data caused convergence problems under the full model. Sensitivity analysis was
undertaken by examining separately the results of the higher quality studies, using
HSROC analysis where more than one higher quality study reported the same test.
Comparisons between tests were made in two ways. First, studies which
directly compared participants who either received all tests or were randomised to
different tests were identified, and the direct comparisons inspected. Secondly, an
indirect comparison between tests, for all tests reported by two or more studies were
modelled together in a single HSROC model to formally compare test performance.
Pair-wise differences in sensitivity and specificity between tests were assessed from
the median difference and corresponding 95% CrI.
Results
Trial Flow
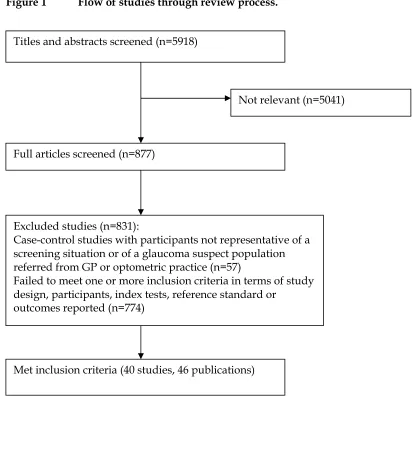
Figure 1 shows the flow of studies through the review. Out of a total of 5918
titles/abstracts screened, 877 potentially relevant full text articles were obtained,
with 40 studies, published in 46 reports, meeting the inclusion criteria.
Study Characteristics and Methodological Quality
The characteristics of the included studies are shown in Table 1. Twenty studies
were considered representative of a glaucoma-suspect population referred from
primary care, of which eight were cohort studies40-47 and 12 were case-control
studies.48-61 Seven studies18,34,40,43,44,48,58 used the first and best reference standard of
OAG confirmed on longitudinal follow-up while the remainder used
ophthalmologist-diagnosed OAG.
The 40 studies enrolled over 48,000 people, with over 39,000 included in the
analysis. The studies took place from 1963 to 2004. In 26 studies reporting
participant gender, 51% were women. The median (range) age of participants across
studies was 60.5 years (13 to 97 years). The reports included a number of major
population-based prevalence surveys, such as the Baltimore Eye Survey,25,31 the Blue
Mountains Eye Study,23 the Crete, Greece Glaucoma Study,27 the Dalby Population
Survey,17 the Egna-Neumarkt Study,18 the Framingham Eye Study,43 the Glaucoma
Screening Study (GLASS),24,26 the Groningen Longitudinal Glaucoma Study,53,54,59 the
Rhondda Valley Study,22 the Rotterdam Study,38 the Segovia Study16 and the Visual
Impairment Project.37
The included studies reported the following tests: ophthalmoscopy (seven
studies); optic disc photography (six studies); retinal nerve fibre layer (RNFL)
photography (four studies); Heidelberg retinal tomograph (HRT) II (three studies);
oculokinetic perimetry (OKP) (four studies); standard automated perimetry (SAP)
(14 studies); frequency doubling technology (FDT) (eight studies); Goldmann
applanation tonometry (GAT) (nine studies); non contact tonometry (NCT) (one
study). No reports of GDx VCC, OCT, RTA, SWAP, MDP or Tonopen were
identified that met our inclusion criteria.
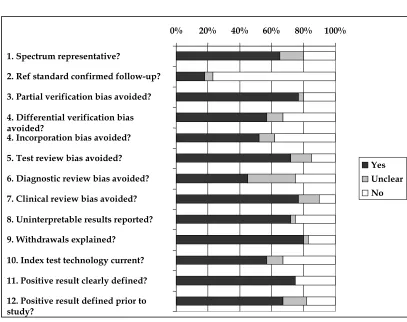
Figure 2 summarises the results of the quality assessment for the 40 included
studies. Study quality was variable, only eight studies20,21,30,34,38,39,45,46 met the
Quantitative Data Synthesis
• Individual tests
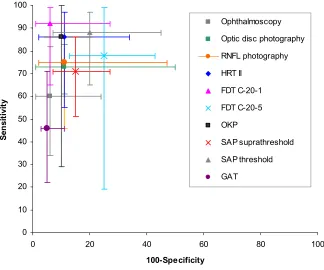
The sensitivity and specificity of the individual tests included in the HSROC
meta-analysis models are shown in Figure 3 and Appendix 1, which also includes DORs.
DORs ranged from 10 for FDT C-20-5 to 181 for FDT C-20-1, with higher DORs
indicating a better ability to differentiate between disease and non-diseased. There
was statistical heterogeneity (variability in outcome beyond what would be expected
by chance) across studies for most tests. Ophthalmoscopy, retinal photography
(optic disc photography and RNFL photography), GAT, standard automated
perimetry (threshold and suprathreshold) and FDT C20-5 were all relatively poorly
performing tests based on lower DORs (range 10-30).
Eight studies met the criteria for higher quality studies, including six
population-based studies and two cohort studies, and test accuracy data are detailed in Table 2.
For both SAP threshold and FDT C-20-5, higher quality studies reported lower
values for both sensitivity and specificity when compared with all studies, while two
FDT C-20-5 studies not meeting the criteria for higher quality reported very high
sensitivity values (98% and 100% respectively). For optic disc photography,
compared with all studies, the higher quality studies reported similar sensitivity
(74% versus 73%) but lower specificity (82% versus 89%). For HRT II, compared with
all studies, the higher quality studies reported higher sensitivity (93% versus 86%)
but slightly lower specificity (85% versus 89%).
Seven studies reported test accuracy in different stages of glaucoma.24,51,52,54,55,60,61
Of those reporting the same tests for different stages of glaucoma, Ieong and
glaucoma while Enger and colleagues51 and Katz and colleagues24 both reported a
sensitivity of 97% for SAP (threshold) for early/moderate stage glaucoma.
• Studies directly comparing tests
Six studies directly compared two or more of the following tests for detection of
OAG: optic disc photography, HRT II, SAP, FDT, GAT.23,30,34,36,46,55 Table 3 shows the
common cut-off selected, sensitivity, specificity, DORs and relative DORs for these
studies. In each study SAP (either suprathreshold or threshold) was included as a
comparator. DORs for the tests ranged from 4 for SAP threshold46 to 75 for HRT II30
(Table 3). In terms of relative DORs, compared with SAP, GAT performed better in
one study36 but worse in another23(statistically significant), HRT II performed better
than SAP in one study30 (statistically significant) but worse in another,55 FDT C-20-530
and FDT C-20 matrix46 performed better than SAP, while optic disc photography34
showed a broadly similar performance.
• Indirect comparisons in a single HSROC model
The results of the indirect comparisons in a single HSROC model are shown in Table
4. From the large number of comparisons undertaken, six showed a statistically
significant difference between tests (four in terms of sensitivity and two in terms of
specificity). There was evidence that, at the common cut-off, FDT C-20-1 was
significantly more sensitive than both ophthalmoscopy (30, 95% CrI 0 to 62) and GAT
(45, 95% CrI 17 to 68), and that both SAP threshold (41, 95% CrI 14 to 64) and HRT II
(39, 95% CrI 3 to 64) were significantly more sensitive than GAT. There was also
evidence that GAT was significantly more specific than both FDT C-20-5 (19, 95% CrI
between tests may well exist which could not be detected due to the high level of
uncertainty. The wide credible intervals reflected the small number of studies
reporting each test and the generally high level of heterogeneity. Due to the
imprecision in the estimates, no test (or even a group of tests) was clearly more
accurate, based upon a 5% significance level. Further analysis, at 10% and 20% levels
of significance, identified additional statistically significant comparisons (Table 4).
For example, in terms of sensitivity, at a 10% significance level FDT C-20-1 was better
than SAP suprathreshold and at a 20% level better than optic disc photography,
RNFL photography and FDT C-20-5. OKP was better than GAT at a 10% level and
HRT II better than ophthalmoscopy at a 20% level. In terms of specificity, at a 20%
level FDT C-20-1 was better than SAP threshold and FDT C-20-5.
Discussion
To our knowledge, this is the first systematic review of screening and diagnostic tests
in glaucoma and includes 40 studies enrolling over 48,000 people and reporting nine
tests. Most tests were reported by only a few, mostly heterogeneous, studies. The
included studies reported tests of structure (ophthalmoscopy; optic disc
photography, RNFL photography, HRT II), visual function (FDT, OKP, SAP) and
IOP (GAT, NCT). Other tests were considered, including those of structure (GDx
VCC, OCT, RTA), visual function (SWAP; MDP), or using Tonopen to measure IOP.
However, no studies using these tests met our inclusion criteria in terms of reporting
of test accuracy outcomes.
A systematic review of test accuracy is unlikely to identify the best test but
can identify more promising tests. It is difficult to rank tests on paired values of
sensitivity and specificity, as a highly specific test may be associated with a low
off between missed cases, and false positives. OAG affects an estimated 2% of the
adult population; a test of low specificity would be likely to overburden a health
service with people who do not have glaucoma and cause unnecessary anxiety for a
many individuals, equally a test of low sensitivity would miss treatable disease
which might be unacceptable to society. The DOR, a single measure of test accuracy,
is a useful measure for comparing accuracy of several tests in a meta-analysis.15
Based on a DOR M50, FDT C-20-1 and OKP (both tests of visual function) and HRT II
(a test of glaucomatous optic neuropathy) merit further evaluation as to their
performance as screening tests for glaucoma. It should be noted that these findings
are relevant to the common cutoff point selected for each test; selection was based on
the most frequently reported off and when several offs were reported the
cut-off most likely to represent early glaucoma. Furthermore these findings are based on
heterogeneous data of limited quality and as such are associated with considerable
uncertainty.
Methods of meta-analysis of diagnostic accuracy which combine studies
where both sensitivity and specificity vary have been available since 1990 and are
continuing to evolve.13,62-66 These methods are based on the idea of a trade-off
relationship between sensitivity and specificity, as occurs when studies vary in
threshold, and aim to estimate the shape and position of the underlying Receiver
Operating Curve. From the estimate of this curve it is possible to identify “operating
points”. The approach adopted in our review identifies the average operating point
for each test, and makes comparisons between them, based upon those studies
reporting each test that share a common cut point. The Cochrane Collaboration are
commencing publication of systematic reviews of diagnostic test accuracy and the
analytical approach we have followed is the one that they are recommending.67
obtains the best estimate of test accuracy in parameters that are clinically meaningful.
The trade-off between sensitivity and specificity is important in judging the
performance of a test and is best depicted by a ROC curve across different cutoff
points. However, the included studies did not usually provide information across
the whole range of cutoff points to allow such analyses to be undertaken.
We used a Bayesian Hierarchical SROC model as standard methods for
meta-analysis do not address the issue of threshold effect and are therefore not
appropriate.68 A number of different levels of analyses were undertaken, including
an analysis where all tests were modelled simultaneously using this Bayesian
approach. This allowed indirect comparison of sensitivities and specificities to be
made, in addition to allowing DORs to be calculated, which is one of the advantages
of the Bayesian method adopted. To produce results that are comparable to those
from standard methods of meta-analysis we did not use informative priors.
In addition to providing sensitivity and specificity estimates we also reported
the DOR results. Some meta-analysis models can only provide the DOR estimate
and therefore we included this measure for comparability. A strength of the DOR is
that it is a mathematically robust measure, (like the standard odds ratio) and
represents diagnostic accuracy as a single value. However, a disadvantage is that
different combinations of sensitivity and specificity values can lead to the same DOR
value.
To be included studies had to meet specific inclusion criteria. The validity of
indirect comparisons does depend upon assumptions regarding the characteristics of
the included studies; however the indirect method is formally performing the
comparison that users of the report are likely to make when assessing the pooled
an important purpose and reaffirms the lack of certainty about which test is indeed
the best.
There are many potential sources of bias in primary diagnostic accuracy
studies. Despite the huge volume of literature, no good quality studies were found
providing a positive response to all questions on the modified QUADAS checklist.
Based on limited evidence, of tests reported by higher quality studies, including the
three tests that were considered to merit further evaluation, estimates of sensitivity
and specificity varied according to study quality.
There is no universally agreed optimal reference standard for the diagnosis of
OAG, although progressive structural optic neuropathy has been proposed as the
best possible reference standard.69,70 In this review either of two reference standards
were considered. There was no obvious pattern in terms of the sensitivity and
specificity of the tests in the seven studies18,34,40,43,44,48,58 that used the first and best
reference standard of OAG confirmed on longitudinal follow-up compared with the
remainder that used ophthalmologist-diagnosed OAG. Although the latter is
suboptimal compared with the former, it is the accepted reference standard in
clinical practice. However establishing a reference standard in glaucoma is
problematic, as in some people optic disc damage precedes visual field loss while in
others the reverse is the case.
The accuracy of a test may vary according to the population in which it is
performed. Samples with higher prevalence often arise through preferential
inclusion of suspect cases, which shifts the disease severity to include more moderate
and severe disease, and since it is easier to differentiate between severely diseased
and non-diseased people, a test would be expected to report improved (apparent)
sensitivity and specificity. Therefore studies with a significantly higher prevalence
mind.21,28-30,36,39 These studies, including two that met the criteria for higher quality
studies,30,39 tended to recruit their participants through media advertising rather than
contacting individuals in a predefined population and can be considered to be more
representative of screening in higher-risk populations.
Twenty of the 40 studies included were hospital-based, which by nature, an
enriched population, and likely to include a disproportionate number of participants
with high IOP, and with previous experience of tests, potentially leading to over
optimistic performance estimates.71-74 The majority of the case-control studies
identified applied stringent criteria for inclusion such as visual acuity of 6/9, or no
other ocular disease and as such were highly prone to bias.75 To minimise this
spectrum bias, case-control studies (n=57) where the participants were considered
unrepresentative of a case-mix found in a general population where OAG screening
would be carried out were excluded from the review.
In the meta-analysis models for the individual tests, statistical heterogeneity
was evident across most studies. Empirically, there was no obvious single cause for
the heterogeneity, but potential contributory factors include differences in
populations, study design, setting, prevalence and severity of glaucoma within
studies. Other factors include differences in reference standard, and in tests included
within the same category (e.g. different types of perimetry and ophthalmoscopy have
a large number of variants, potentially leading to heterogeneity in discriminatory
power across studies reporting those tests), and the extent to which studies were
affected by other potential biases (e.g. partial and differential verification bias,
incorporation bias, test and diagnostic review bias).
Relatively few studies were identified for each test and it was not possible to perform
sensitivity analysis based on study design. The common cutoff chosen for each test
was the one most frequently reported across the included studies for that test,
although this may not be the most appropriate. The majority of the studies were
poorly reported, an issue that has been highlighted in recent literature.76-79 Only six
of the 40 studies directly compared two or more tests. It was not possible to provide
summary results of studies that directly compared tests because of small numbers.
Studies not providing sufficient information to allow the calculation of 2 x 2 tables
were excluded, although they may have contributed information in terms of
sensitivity and specificity.
Systematic reviews provide a robust and rigorous evaluation of the available
evidence, but by their nature as new studies are published the review requires
updating. Since the completion of our meta-analysis further studies have been
published on the performance of the tests included in this review. These include
population-based studies in the USA, UK, Hungary, Japan and China. These studies
provide additional information on the performance of FDT perimetry alone;80-82 in
combination with GDx VCC,83 and combined with an IOP measurement84 and data
on the performance of HRT II in an elderly population in the UK85 and in a
community screening programme in Japan,86 comparing HRT II with non-mydriatic
fundus photography. Although systematic reviews rapidly become out of date,
which is a limitation, a strength of a systematic review is that the methods are
transparent and reproducible such that the review can be updated as further data
become available in the future. Priorities for future research and optimal study
designs can also be identified.
Ideally, a screening test for OAG should be safe, easy to administer and interpret,
portable, quick, and acceptable to the people who are to be tested, and sufficiently
valid to distinguish between those who do and do not have OAG. Many potential
screening tests for glaucoma are available. Of the many candidate tests, no one test or
group of tests was clearly more accurate. Based on limited data, relatively poorly
performing tests, ophthalmoscopy, standard automated perimetry, retinal
photography, and Goldmann applanation tonometry, were identified.
Frequency doubling technology, (C 20-1), Heidelberg Retinal Tomography
and oculokinetic perimetry were identified as having better diagnostic performance
than other candidate tests, although these findings were based on poor quality
evidence. Further studies should evaluate the most promising tests in directly
comparative studies in a relevant population.
Acknowledgements
This paper was developed from a Health Technology Assessment on the clinical and
cost-effectiveness of screening for OAG, and funded by the UK National Institute for
Health Research Health Technology Assessment programme (project number
04/08/02). The Health Services Research Unit and the Health Economics Research
Unit are both core funded by the Chief Scientist Office of the Scottish Government
Health Directorates. The views expressed in this report are those of the authors and
not necessarily those of the funders. The authors are grateful to members of the
OAG project group for assistance and comments on all stages of the review. Other
members of the OAG Screening Project Group were: Rodolfo Hernandez, Luke Vale,
Tania Lourenco, Cynthia Fraser, John Cairns, Richard Wormald, Stephen McPherson,
David Wright, Kannaiyan Rabindranath, Rod Taylor, Norman Waugh and Adrian
References
1 Quigley HA, Broman AT. The number of people with glaucoma worldwide in 2010 and 2020. Br J Ophthalmol 2006;90:262-7.
2 Resnikoff S, Pascolini D, Etya'ale D, Kocur I, Pararajasegaram R, Pokharel GP et al. Global data on visual impairment in the year 2002. Bull World Health Organ
2004;82:844-51.
3 Grant WM, Burke JF, Jr. Why do some people go blind from glaucoma?
Ophthalmology 1982;89:991-8.
4 Leske MC, Heijl A, Hussein M, Bengtsson B, Hyman L, Komaroff E. Factors for glaucoma progression and the effect of treatment: The Early Manifest
Glaucoma Trial. Arch Ophthalmol 2003;121:48-56.
5 Wilson R, Walker AM, Dueker DK, Crick RP. Risk factors for rate of
progression of glaucomatous visual field loss: a computer-based analysis. Arch Ophthalmol 1982;100:737-41.
6 Burr JM, Mowatt G, Hernandez R, Siddiqui MA, Cook J, Lourenco T et al. The clinical effectiveness and cost-effectiveness of screening for open angle
glaucoma: a systematic review and economic evaluation. Health Technol Assess
2007;11:1-190.
7 Fleming C, Whitlock,E, Biel,T, Smit,B. Primary care screening for ocular
hypertension and primary open-angle glaucoma: Evidence Synthesis No 34 [document on the Internet]. Agency for Healthcare Research & Quality, US Preventive Services Task Force; 2005 [accessed April 2008] Available from: URL: http://www.ahrq.gov/clinic/uspstf05/glaucoma/glaucsyn.pdf.
8 Maier PC, Funk J, Schwarzer G, Antes G, Falck-Ytter YT. Treatment of ocular hypertension and open angle glaucoma: meta-analysis of randomised
controlled trials. Br Med J 2005;331:134-6.
9 Spry PG, Sparrow,JM. An evaluation of open-angle glaucoma against the NSC criteria for screening viability, effectiveness and appropriateness [document on the Internet}. UK National Screening Committee; 2005 [accessed April 2008] Available from: URL:
http://rms.nelh.nhs.uk/screening/viewResource.asp?categoryID=1352&dg=1 07&uri=http://libraries.nelh.nhs.uk/common/resources/?id=61002.
10 FinOHTA. Cost-effectiveness of glaucoma screening (project). Finish Office for Health Technology Assessment; 2005 [accessed April 2008} Available from: URL: http://finohta.stakes.fi/EN/research/index.htm.
11 Screening for glaucoma: an update - non-systematic review (project). Agence
2007 [accessed April 2008] Available from: URL: http://www.aetmis.gouv.qc.ca.
12 Whiting P, Rutjes AW, Reitsma JB, Bossuyt PM, Kleijnen J. The development of QUADAS: a tool for the quality assessment of studies of diagnostic accuracy included in systematic reviews. BMC Med Res Methodol 2003;3:Nov 10.
13 Rutter CM, Gatsonis CA. A hierarchical regression approach to meta-analysis of diagnostic test accuracy evaluations. Stat Med 2001;20:2865-84.
14 Spiegelhalter D, Thomas A, Best N. WinBUGS: Bayesian inference using Gibbs sampling. User manual, version 1.4. Cambridge: MRC Biostatistics Unit; 2003.
15 Glas AS, Lijmer JG, Prins MH, Bonsel GJ, Bossuyt PM. The diagnostic odds ratio: a single indicator of test performance. J Clin Epidemiol 2003;56:1129-35.
16 Anton A, Andrada MT, Mujica V, Calle MA, Portela J, Mayo A. Prevalence of primary open-angle glaucoma in a Spanish population: the Segovia study. J Glaucoma 2004;13:371-6.
17 Bengtsson B. Findings associated with glaucomatous visual field defects. Acta Ophthalmol (Copenh) 1980;58:20-32.
18 Bonomi L, Marchini G, Marraffa M, Morbio R. The relationship between intraocular pressure and glaucoma in a defined population. Data from the Egna-Neumarkt Glaucoma Study. Ophthalmologica 2001;215:34-8.
19 Christoffersen T, Fors T, Waage S, Holtedahl K. Glaucoma screening with oculokinetic perimetry in general practice: is its specificity acceptable? Eye
1995;9:36-9.
20 Detry-Morel M, Zeyen T, Kestelyn P, Collignon J, Goethals M, Belgian Glaucoma Society. Screening for glaucoma in a general population with the non-mydriatic fundus camera and the frequency doubling perimeter. Eur J Ophthalmol 2004;14:387-93.
21 Harasymowycz P, Papamatheakis D, Fansi AK, Gresset J, Lesk MR. Validity of screening for glaucomatous optic nerve damage using confocal scanning laser ophthalmoscopy (Heidelberg Retina Tomograph II) in high-risk populations: a pilot study. Ophthalmology 2005;112:2164-71.
22 Hollows FC, Graham PA. Intra-ocular pressure glaucoma and glaucoma suspects in a defined population. Br J Ophthalmol 1966;50:570-86.
23 Ivers RQ, Optom B, Macaskill P, Cumming RG, Mitchell P. Sensitivity and specificity of tests to detect eye disease in an older population. Ophthalmology
2001;108:968-75.
24 Katz J, Sommer A, Gaasterland DE, Anderson DR. Comparison of analytic algorithms for detecting glaucomatous visual field loss. Arch Ophthalmol
25 Katz J, Tielsch JM, Quigley HA, Javitt J, Witt K, Sommer A. Automated suprathreshold screening for glaucoma: the Baltimore Eye Survey. Invest Ophthalmol Vis Sci 1993;34:3271-7.
26 Katz J, Quigley HA, Sommer A. Repeatability of the Glaucoma Hemifield Test in automated perimetry. Invest Ophthalmol Vis Sci 1995;36:1658-64.
27 Kozobolis VP, Detorakis ET, Tsilimbaris M, Siganos DS, Vlachonikolis IG, Pallikaris IG. Crete, Greece glaucoma study. J Glaucoma 2000;9:143-9.
28 Mansberger SL, Johnson CA, Cioffi GA, Choi D, Krishnadas SR, Srinivasan M et al. Predictive value of frequency doubling technology perimetry for detecting glaucoma in a developing country. J Glaucoma 2005;14:128-34.
29 Mundorf TK, Zimmerman TJ, Nardin GF, Kendall KS. Automated perimetry, tonometry, and questionnaire in glaucoma screening. Am J Ophthalmol
1989;108:505-8.
30 Robin TA, Muller A, Rait J, Keeffe JE, Taylor HR. Performance of community-based glaucoma screening using frequency doubling technology and
Heidelberg retinal tomography. Ophthalmic Epidemiol 2005;12:167-78.
31 Tielsch JM, Katz J, Singh K, Quigley HA, Gottsch JD, Javitt J et al. A population-based evaluation of glaucoma screening: the Baltimore Eye Survey. Am J Epidemiol 1991;134:1102-10.
32 Vernon SA, Henry DJ, Cater L, Jones SJ. Screening for glaucoma in the community by non-ophthalmologically trained staff using semi automated equipment. Eye 1990;4:89-97.
33 Vernon SA, Jones SJ, Henry DJ. Maximising the sensitivity and specificity of non-contact tonometry in glaucoma screening. Eye 1991;5:491-3.
34 Vitale S, Smith TD, Quigley T, Kerrigan-Baumrind TA, Pease TE, Varma R et al. Screening performance of functional and structural measurements of neural damage in open-angle glaucoma: a case-control study from the Baltimore Eye Survey. J Glaucoma 2000;9:346-56.
35 Wang F, Quigley HA, Tielsch JM. Screening for glaucoma in a medical clinic with photographs of the nerve fiber layer. Arch Ophthalmol 1994;112:796-800.
36 Wang F, Tielsch JM, Ford DE, Quigley HA, Whelton PK. Evaluation of screening schemes for eye disease in a primary care setting. Ophthalmic Epidemiol 1998;5:69-82.
37 Weih LM, Nanjan M, McCarty CA, Taylor HR. Prevalence and predictors of open-angle glaucoma: results from the visual impairment project.
Ophthalmology 2001;108:1966-72.
38 Wolfs RC, Ramrattan RS, Hofman A, de Jong PT. Cup-to-disc ratio:
39 Yamada N, Chen PP, Mills RP, Leen MM, Lieberman MF, Stamper RL et al. Screening for glaucoma with frequency-doubling technology and Damato campimetry. Arch Ophthalmol 1999;117:1479-84.
40 Ekstrom C. Elevated intraocular pressure and pseudoexfoliation of the lens capsule as risk factors for chronic open angle glaucoma - a population based 5 year follow up study. Acta Ophthalmol (Copenh) 1993;71:189-95.
41 Hammond EA, Begley PK. Screening for glaucoma: a comparison of ophthalmoscopy and tonometry. Nurs Res 1979;28:371-2.
42 Khong JJ, Dimitrov PN, Rait J, McCarty CA. Can the specificity of the FDT for glaucoma be improved by confirming abnormal results? J Glaucoma
2001;10:199-202.
43 Leibowitz HM, Krueger DE, Maunder LR, Milton RC, Kini MM, Kahn HA et al. The Framingham Eye Study monograph: An ophthalmological and
epidemiological study of cataract, glaucoma, diabetic retinopathy, macular degeneration, and visual acuity in a general population of 2631 adults, 1973-1975. Surv Ophthalmol 1980;24:335-610.
44 Marraffa M, Marchini G, Albertini R, Bonomi L. Comparison of different screening methods for the detection of visual field defects in early glaucoma.
Int Ophthalmol 1989;13:43-5.
45 Schultz RO, Radius RL, Hartz AJ, Brown DB, Eytan ON, Ogawa GSH et al. Screening for glaucoma with stereo disc photography. J Glaucoma 1995;4:177-82.
46 Spry PGD, Hussin HM, Sparrow JM. Clinical evaluation of frequency doubling technology perimetry using the Humphrey Matrix 24-2 threshold strategy. Br J Ophthalmol 2005;89:1031-5.
47 Theodossiades J, Murdoch I. What optic disc parameters are most accurately assessed using the direct ophthalmoscope? Eye 2001;15:283-7.
48 Airaksinen PJ, Drance SM, Douglas GR, Mawson DK, Nieminen H. Diffuse and localized nerve fiber loss in glaucoma. Am J Ophthalmol 1984;98:566-71.
49 Anton A, Maquet JA, Mayo A, Tapia J, Pastor JC. Value of logistic discriminant analysis for interpreting initial visual field defects. Ophthalmology 1997;104:525-31.
50 Damato BE, Ahmed J, Allan D, McClure E, Jay JL. The detection of
glaucomatous visual field defects by oculo-kinetic perimetry: which points are best for screening? Eye 1989;3:727-31.
51 Enger C, Sommer A. Recognizing glaucomatous field loss with the Humphrey STATPAC. Arch Ophthalmol 1987;105:1355-7.
53 Heeg GP, Blanksma LJ, Hardus PL, Jansonius NM. The Groningen
Longitudinal Glaucoma Study. I. Baseline sensitivity and specificity of the frequency doubling perimeter and the GDx nerve fibre analyser. Acta Ophthalmol Scand 2005;83:46-52.
54 Heeg GP, Stoutenbeek R, Jansonius NM. Strategies for improving the diagnostic specificity of the frequency doubling perimeter. Acta Ophthalmol Scand 2005;83:53-6.
55 Ieong A, Murdoch I, Cousens S, Healey P, Theodossiades J. Sensitivity and specificity of two glaucoma case-finding strategies for optometrists. Ophthalmic Physiol Opt 2003;23:341-6.
56 Johnson CA, Cioffi GA, Van Buskirk EM. Evaluation of two screening tests for frequency doubling technology perimetry. 13th International Perimetric Society Meeting, Garda, Italy, September 1999. p. 103.
57 Quigley HA, Miller NR, George T. Clinical evaluation of nerve fiber layer atrophy as an indicator of glaucomatous optic nerve damage. Arch Ophthalmol
1980;98:1564-71.
58 Sommer A, Pollack I, Maumenee AE. Optic disc parameters and onset of glaucomatous field loss. II. Static screening criteria. Arch Ophthalmol
1979;97:1449-54.
59 Stoutenbeek R, Heeg GP, Jansonius NM. Frequency doubling perimetry screening mode compared to the full-threshold mode. Ophthalmic Physiol Opt
2004;24:493-7.
60 Wollstein G, Garway-Heath DF, Fontana L, Hitchings RA. Identifying early glaucomatous changes. Comparison between expert clinical assessment of optic disc photographs and confocal scanning ophthalmoscopy. Ophthalmology
2000;107:2272-7.
61 Wood CM. Limitations of direct ophthalmoscopy in screening for glaucoma. Br Med J 1987;294:1587-8.
62 Gatsonis C, Paliwal P. Meta-analysis of diagnostic and screening test accuracy evaluations: methodologic primer. Am J Roentgenol 2006;187:271-81.
63 Kardaun JW, Kardaun OJ. Comparative diagnostic performance of three radiological procedures for the detection of lumbar disk herniation. Methods Inf Med 1990;29:12-22.
64 Macaskill P. Empirical Bayes estimates generated in a hierarchical summary ROC analysis agreed closely with those of a full Bayesian analysis. J Clin Epidemiol 2004;57:925-32.
66 Reitsma JB, Glas AS, Rutjes AW, Scholten RJ, Bossuyt PM, Zwinderman AH. Bivariate analysis of sensitivity and specificity produces informative summary measures in diagnostic reviews. J Clin Epidemiol 2005;58:982-90.
67 Cochrane Diagnostic Test Accuracy Working Group [website on the Internet]. The Cochrane Collaboration; 2008 [accessed April 2008] Available from: URL: http://srdta.cochrane.org/en/index.html.
68 Cochrane Handbook for Systematic Reviews of Interventions. Version 5.0.0 (updated February 2008) [document on the Internet]. The Cochrane Library. Issue 2, 2008. Chichester, UK: John Wiley& Sons Ltd [accessed April 2008] Available from: URL: http://www.cochrane-handbook.org/.
69 Medeiros FA, Zangwill LM, Bowd C, Sample PA, Weinreb RN. Use of progressive glaucomatous optic disk change as the reference standard for evaluation of diagnostic tests in glaucoma. Am J Ophthalmol 2005;139:1010-8.
70 Weinreb RN, Khaw KT. Primary open-angle glaucoma. Lancet 2004;363:1711-20.
71 Wild JM, Kim LS, Pacey IE, Cunliffe IA. Evidence for a learning effect in short-wavelength automated perimetry. Ophthalmology 2006;113:206-15.
72 Yenice O, Temel A. Evaluation of two Humphrey perimetry programs: full threshold and SITA standard testing strategy for learning effect. Eur J Ophthalmol 2005;15:209-12.
73 Matsuo H, Tomita G, Suzuki Y, Araie M. Learning effect and measurement variability in frequency-doubling technology perimetry in chronic open-angle glaucoma. J Glaucoma 2002;11:467-73.
74 Joson PJ, Kamantigue ME, Chen PP. Learning effects among perimetric novices in frequency doubling technology perimetry. Ophthalmology 2002;109:757-60.
75 Rutjes AW, Reitsma JB, Di Nisio M, Smidt N, van Rijn JC, Bossuyt PM. Evidence of bias and variation in diagnostic accuracy studies. Can Med Assoc J
2006;174:469-76.
76 Bochmann F, Johnson Z, Azuara-Blanco A. Sample size of studies of diagnostic accuracy in ophthalmology: literature survey. Br J Ophthalmol 2007;91:898-900.
77 Johnson Z, Siddiqui MAR, Azuara-Blanco A. The quality of reporting of diagnostic accuracy studies of optical coherence tomography in glaucoma.
Ophthalmology 2007;114:1607-12.
78 Paranjothy B, Shunmugam M, Azuara-Blanco A. The quality of reporting of diagnostic accuracy studies in glaucoma using scanning laser polarimetry. J Glaucoma 2007;16:670-5.
80 Wang YX, Xu L, Zhang RX, Jonas JB. Frequency-doubling threshold perimetry in predicting glaucoma in a population-based study: The Beijing Eye Study.
Arch Ophthalmol 2007;125:1402-6.
81 Mansberger SL, Johnson CA, Cioffi GA. The results of screening frequency doubling technology perimetry in different locations of the community. J Glaucoma 2007;16:73-80.
82 Iwase A, Tomidokoro A, Araie M, Shirato S, Shimizu H, Kitazawa Y et al. Performance of frequency-doubling technology perimetry in a population-based prevalence survey of glaucoma: the Tajimi study. Ophthalmology
2007;114:27-32.
83 Toth M, Kothy P, Vargha P, Hollo G. Accuracy of combined GDx-VCC and matrix FDT in a glaucoma screening trial. J Glaucoma 2007;16:462-70.
84 Vistamehr S, Shelsta HN, Palmisano PC, Filardo G, Bashford K, Chaudhri K et al. Glaucoma screening in a high-risk population. J Glaucoma 2006;15:534-40.
85 Hawker MJ, Vernon SA, Tattersall CL, Dua HS. Linear regression modeling of rim area to discriminate between normal and glaucomatous optic nerve heads: the Bridlington Eye Assessment Project. J Glaucoma 2007;16:345-51.
Figure 1 Flow of studies through review process.
Titles and abstracts screened (n=5918)
Not relevant (n=5041)
Full articles screened (n=877)
Excluded studies (n=831):
Case-control studies with participants not representative of a screening situation or of a glaucoma suspect population referred from GP or optometric practice (n=57)
Failed to meet one or more inclusion criteria in terms of study design, participants, index tests, reference standard or
outcomes reported (n=774)
Figure 2 Results of the quality assessment of the 40 included studies.
Notes:
1. Where a study reported two or more tests and they differed in meeting any one QUADAS criterion, e.g. one test checked ‘Yes’ and one checked ‘No’, then the ‘No’ answer was taken to represent the study for that item. This applied to the following studies for the following items:
(i) Robin 2005.30 Question 5 was Yes for FDT, No for HRT II, No for SAP. (ii) Wang 1998.36 Question 5 was Yes for ophthalmoscopy, Yes for RNFL
photography, No for SAP, No for GAT. Question 9 was Yes for RNFL photography, No for ophthalmoscopy, No for SAP, No for GAT. (iii) Marraffa 1989.44 Question 11 was Yes for Henson, Unclear for the other
perimetry tests.
(iv) Spry 2005.46 Questions 5 and 7 were Yes for FDT, No for SAP. (v) Harper 1994.52 Questions 5 and 12 were Yes for OKP, No for SAP.
(vi) Quigley 1980.57 Question 5 was Yes for RNFL, No for optic disc photography. 2. Unclear means insufficient information was provided to determine whether the item should be checked Yes or No.
0% 20% 40% 60% 80% 100%
1. Spectrum representative?
2. Ref standard confirmed follow-up?
3. Partial verification bias avoided?
4. Differential verification bias avoided?
4. Incorporation bias avoided?
5. Test review bias avoided?
6. Diagnostic review bias avoided?
7. Clinical review bias avoided?
8. Uninterpretable results reported?
9. Withdrawals explained?
10. Index test technology current?
11. Positive result clearly defined?
12. Positive result defined prior to study?
Figure 3 Summary of sensitivity and specificity of tests included in the HSROC meta-analysis models.
0 10 20 30 40 50 60 70 80 90 100
0 20 40 60 80 100
100-Specificity
S
en
si
ti
vi
ty
Ophthalmoscopy
Optic disc photography
RNFL photography
HRT II
FDT C-20-1
FDT C-20-5
OKP
SAP suprathreshold
SAP threshold
GAT
Notes:
Table 1 Characteristics of the included studies.
Study id Index test(s) Test(s) carried out
and interpreted by ReferenceStandard Enrolled(people) Analysed Mean age(range) Gender Country periodTime Population-based studies (cross-sectional)
Anton 200416 GAT Ophthalmologists Ophthalmic
examination 569 510 (40 to 79) M: 232;F: 278 Spain (SegoviaStudy) N/S
Bengtsson 198017
GAT Ophthalmologists Ophthalmic
examination 1938 1511 (55 to 69) N/S Sweden(DalbyPopulation
Survey)
1977 - 1978
Bonomi 200118 GAT Ophthalmologists Follow-up
confirmation
5816 4297 eyes of 4297
people
(40 to 80+) M: 1882;
F: 2415 Italy (Egna-Neumarkt Study) N/S Detry-Morel 200420
FDT C-20-5 Residents in
training, paramedical staff
Ophthalmic examination
1802 3211 eyes of 1620
people
63 (22 to 97)
M: 680; F: 940 Belgium October 1999 Harasymowycz 200521
HRT II Ophthalmic
photographer examinationOphthalmic 303 264 right eyes, 265left eyes of 271 people
62.2
(SD 11.6) M: 90;F: 179 Canada August 2003– February 2004 Hollows 196622 GAT Ophthalmologists Ophthalmic
examination
4608 4231 55
(40 to 74)
Approx: M: 3639; F: 592 UK (Rhondda Valley Study) Summer 1963
Ivers 200123 SAP
suprathreshold; GAT N/S Ophthalmic examination 4433 3654 (both tests)
(49 to 97) M: 1582;
F: 2072
Australia (Blue Mountains Eye
Study)
1992 - 1994
Katz 199124 SAP threshold N/S Ophthalmic
examination
355 355 eyes of 355
people
Cases: 61; Controls:
53
N/S USA (Glaucoma
Screening Study)
1981 – 1992
Katz 199325 SAP
suprathreshold
N/S Ophthalmic
examination
5308 4733 (40 to 80+) M: 2109;
F: 3199
USA (Baltimore Eye Survey)
Study id Index test(s) Test(s) carried out
and interpreted by ReferenceStandard Enrolled(people) Analysed Mean age(range) Gender Country periodTime Kozobolis
200027
GAT Uncertain Ophthalmic
examination
1300 1107 (40 to 80+) M: 463;
F: 644
Greece (Crete, Greece Glaucoma
Study)
Feb 1993 – June 1998
Mansberger 200528
FDT C-20-5 N/S Ophthalmic
examination
296 251 eyes of 251
people
45 (30 to 65)
M: 117; F: 174 India N/S Mundorf 198929 SAP
suprathreshold N/S examinationOphthalmic 145 145 71 M: 40;F: 105 USA N/S
Robin 200530 Ophthalmoscopy;
HRT II; SAP threshold; FDT C-20-5 Appropriately trained staff Ophthalmic examination
704 261 eyes of 261
people (all tests)
65 M: 281;
F: 378
Australia Nov 2001
Weih 200137 Ophthalmoscopy N/S Consensus
by panel of ophthalmolo
gists, based on results of
ophthalmic examination
4744 4636 59 (SD 12) M: 2230;
F: 2514
Australia (Visual Impairment
Project)
1992 – 1996
Wolfs 199938 Optic disc
photography Technicians examinationOphthalmic 6777 5143 eyes of 5143people (55 andover) N/S Netherlands(Rotterdam Study)
N/S
Yamada 199939 OKP; FDT C-20-1 Technicians Decision of
glaucoma specialists,
based on ophthalmic
records
259 175 eyes of 175
people (OKP); 240 eyes of 240 people
Study id Index test(s) Test(s) carried out
and interpreted by ReferenceStandard Enrolled(people) Analysed Mean age(range) Gender Country periodTime Population-based studies (cohort)
Christoffersen 199519
Patient source: general practice
OKP GPs, medical
secretaries examinationOphthalmic 195 187 (40 to 84)57 M: 51;F: 136 Norway N/S
Vernon 199032
Patient source: general practice Ophthalmoscopy; SAP suprathreshold; NCT Ophthalmoscopy: experienced ophthalmologists; NCT/SAP: non-ophthalmological trained staff Ophthalmic examination 988 854(ophth); 855 (SAP); 874 (NCT)
65 M: 374;
F: 500
UK N/S
Wang 199836
Patient source: general practice Ophthalmoscopy; SAP suprathreshold; GAT [RNFL photography] N/S Ophthalmic
examination 530 (fromprimary care clinic)
400(ophth); 214 (SAP); 357 (GAT) [136 (RNFL photo)]
(40 to 65+) M: 111;
F: 294 USA Jul 1991 –Feb 1992
Population-based studies (case-control) Vitale 200034
Patient source: Cases and controls: sample of patients with and without glaucoma from the Baltimore Eye Study Follow-up Optic disc photography; SAP suprathreshold Experienced technicians Follow-up confirmation
249 182 (disc photo);
228 (SAP);
68 M: 100;
Study id Index test(s) Test(s) carried out
and interpreted by ReferenceStandard Enrolled(people) Analysed Mean age(range) Gender Country periodTime Study
Already suspect population (cohort studies) Ekstrom 199340
Patient source: people
previously examined in a population-based glaucoma survey
GAT N/S Follow-up
confirmation
760 413 (65 to 74) M: 364;
F: 396
Sweden(Tierp Glaucoma
Survey)
Mar 1984 – Mar 1986
Hammond 197941
Patient source: eye clinic
Ophthalmoscopy Nurses skilled in
use of the ophthalmoscope
Ophthalmic examination
219 188 (21 and
over)
N/S USA N/S
Khong 200142
Patient source: eye clinics
FDT C-20-5 N/S Ophthalmic
examination
228 113 68.5
(23 to 91)
M: 104; F: 119
Australia Dec 1999 –
Jan 2000 Leibowitz 198043 Patient source: Framingham Eye Study GAT Generally
performed by 2ndor 3rdyear residents in
ophthalmology
Follow-up confirmation
2631 574 (<65 to
75+) M: 272; F: 302 USA (Framingham Eye Study)
Feb 1973 – Feb 1975
Marraffa 198944
Patient source: eye clinic SAP suprathreshold Ophthalmologists Follow-up confirmation
104 182 eyes of 104
people
54.3 (18 to 76)
M:45; F: 59 Italy N/S
Schultz 199545
Patient source: clinical practices of
Optic disc
photography Carried out: N/SInterpreted: 3rd year ophthalmology
Ophthalmic
examination 258 365 eyes of ? people (<40 to>70) M: 112;F: 144; Unknown:
2
Study id Index test(s) Test(s) carried out
and interpreted by ReferenceStandard Enrolled(people) Analysed Mean age(range) Gender Country periodTime glaucoma specialist, cataract surgeon and general ophthalmologis t residents
Spry 200546
Patient source: hospital eye service
SAP threshold; FDT C-20 matrix
SAP: clinic staff trained in visual field testing;
FDT: N/S
Ophthalmic examination
48 48 (both tests) 67.3
(SD 13.5)
M: 24; F: 24
UK Oct 2003 –
Jan 2004 Theodossiades 200147 Patient source: glaucoma clinics
Ophthalmoscopy Optometrists Ophthalmic
examination 50 50 eyes of 50 people N/S N/S UK N/S
Already suspect population (case-control studies) Airaksinen
198448
Patient source: not stated
RNFL photography N/S Follow-up
confirmation
142 132 eyes of 132
people
Glaucoma: 62 (SD 20.5)
Normal: 54 (SD 16.9);
OHT: 57 (SD 12.7)
N/S Canada +
Finland
N/S
Anton 199749
Patient source: Cases and controls: glaucoma unit
SAP threshold Uncertain Ophthalmic
examination
180 180 eyes of 180
people
Glaucoma: 61 (SD 8);
Normal: 59 (SD 9)
N/S Spain N/S
Damato 198950
Patient source: OKP Staff experienced inperimetry
Ophthalmic examination
102 102 eyes of 102
people
Glaucoma: 57.3;
Study id Index test(s) Test(s) carried out
and interpreted by ReferenceStandard Enrolled(people) Analysed Mean age(range) Gender Country periodTime Cases: not stated Controls: dermatology ward, hospital staff, relatives/ friends of patients, patients with unilateral non-glaucomatous disease affecting the fellow eye Normal: 54.4
Enger 198751
Patient source: Cases and controls: nerve fibre layer study
SAP threshold N/S Ophthalmic
examination 112 170 eyes of 112people Glaucoma:61
(28 to 80); Normal: 51
(26 to 75)
N/S USA N/S
Harper 199452
Patient source: not stated
OKP; SAP
suprathreshold Uncertain examinationOphthalmic 212 193 (OKP); 212(SAP) Glaucoma:67.8
(43 to 85); Normal:
61.5 (41 to 85)
N/S UK N/S
Heeg 200553
Patient source: Cases:
glaucoma outpatient
FDT C-20-1; FDT C-20 full
threshold
N/S Ophthalmic
examination
1112 208 (FDT C-20-1);
1112 (FDT C-20 full threshold)
Glaucoma: 65 (13 to 91); Normal: 63
(33 to 94)
Eligible :Gl aucoma: M: 509; F: 542 Normal: Netherlands (Groningen Longitudinal Glaucoma Study)
Study id Index test(s) Test(s) carried out
and interpreted by ReferenceStandard Enrolled(people) Analysed Mean age(range) Gender Country periodTime department Controls: old people’s homes, blood bank, other public places M: 118; F: 119
Ieong 200355
Patient source: Cases: glaucoma subjects Controls: partners of cases, optometrist practice
HRT II; SAP
suprathreshold Optometrists examinationOphthalmic 66 66 eyes of 66 people(both tests) Glaucoma:69; Normal: 60
Glaucoma: M: 16; F: 13 Normal: M: 16; F: 21
UK N/S
Johnson 199956
Patient source: not stated
FDT C-20-1 N/S Ophthalmic
examination
108 160 eyes of 108
people
Glaucoma: 64 (35 to 85); Normal: 46
(18 to 81)
USA N/S
Quigley 198057
Patient source: Cases and controls: ophthalmologic al institute Optic disc photography; RNFL photography Ophthalmologists Ophthalmic examination
175 294 eyes of ? people
(both tests) Readable photos: Glaucoma: 52.7 (SD 2.78); Glaucoma suspect: 45.2 (SD 1.56); Normal: M: 86; F: 89
USA Jan 1978 –
Study id Index test(s) Test(s) carried out
and interpreted by ReferenceStandard Enrolled(people) Analysed Mean age(range) Gender Country periodTime 37.9 (SD 2.8) Unreadable photos: Glaucoma: 62.5 (SD 4.0); Glaucoma suspect: 59.6 (SD 6.3); Normal: 50 (SD 12.1) Sommer 197958
Patient source: Cases and controls: glaucoma clinic Optic disc photography; RNFL photography N/S Follow-up confirmation
Unclear 223 eyes of ? people (both tests)
N/S N/S USA N/S
Wollstein 200060 Patient source: Cases: glaucoma clinic and ocular hypertension clinic Controls: spouses or friends of patients, responders to Optic disc photography
Photos taken by trained technicians; assessed by glaucoma consultants, glaucoma fellow, clinical glaucoma technician Ophthalmic examination
123 123 eyes of 123
people Glaucoma: 65.1 (SD 10.06); Normal: 57.1 (SD 12.52)
Study id Index test(s) Test(s) carried out
and interpreted by ReferenceStandard Enrolled(people) Analysed Mean age(range) Gender Country periodTime an advert
Wood 198761
Patient source: not stated
Ophthalmoscopy Ophthalmologists;
junior doctors
Ophthalmic examination
22 43 eyes of 22 people (32 to 75) N/S UK N/S
Notes:
1. N/S, not stated.
2. Numbers analysed are people unless otherwise stated.
Table 2 HSROC analysis: all studies compared with higher quality studies.
Optic disc photography HRT II FDT C-20-5 SAP threshold
Sensitivity %
(95% CrI) Specificity %(95% CrI) Sensitivity %(95% CrI) Specificity %(95% CrI) Sensitivity %(95% CrI) Specificity %(95% CrI) Sensitivity %(95% CrI) Specificity %(95% CrI)
All
studies 73 (61 to 83) 89 (50 to 99) 86 (55 to 97) 89 (66 to 98) 78 (19 to 99) 75 (57 to 87) 88 (65 to 97) 80 (55 to 93) Higher
quality 74 (30 to 95) 82 (45 to 97) 93 (58 to 99) 85 (47 to 97) 72 (26 to 96) 60 (17 to 92) 73 (28 to 95) 64 (22 to 92)
Notes:
38
Table 3 Sensitivity, specificity, DOR and relative DOR at the common cutoff for studies directly comparing tests.
Study id Test Common cutoff Sens % (95% CI) Spec % (95% CI) DOR (95% CI) RDOR (95% CI)
Vitale 200034 SAP supra 3 adjacent points missed 50 (37 to 63) 83 (76 to 88) 5 (3 to 9) 1
Optic disc photo VCDR > 0.6 77 (62 to 89) 59 (50 to 67) 5 (2 to 11) 0.99 (0.36 to 2.75)
Ieong 200355 SAP supra Optometrist judgement 72 (53 to 87) 95 (82 to 99) 46 (9 to 237) 1
HRT II Global/one of six segments abnormal 69 (49 to 85) 95 (82 to 99) 39 (8 to 198) 0.85 (0.08 to 8.54)
Robin 200530 SAP threshold AGIS score 3 [common cutoff] 63 (38 to 84) 74 (68 to 80) 5 (2 to 13) 1
HRT II 1 borderline or 1 severe abnormality 95 (74 to 100) 81 (75 to 85) 75 (10 to 574) 15.01 (1.57 to 143.82)
FDT C-20-5 One abnormal point 84 (60 to 97) 55 (49 to 61) 7 (2 to 23) 1.31 (0.27 to 6.43)
Spry 200546 SAP threshold 80 (52 to 96) 52 (34 to 69) 4 (1 to 18) 1
FDT C-20 matrix
GHT outside normal limit and/or p < 0.05
with the PSD global index in one/ both eyes 100 (78 to 100) 27 (13 to 46) 12 (1 to 222) 2.83 (0.11 to 72.91)
Ivers 200123 SAP supra 3 or more points missing 89 (80 to 94) 73 (71 to 74) 20 (10 to 39) 1
GAT IOP > 22 mmHg 14 (7 to 23) 98 (97 to 98) 6 (3 to 12) 0.31 (0.12 to 0.78)
Wang 199836 SAP supra Absolute or relative defectsM17 70 (57 to 80) 67 (59 to 74) 5 (2 to 9) 1
GAT IOP > 21 mmHg 28 (17 to 40) 96 (93 to 98) 9 (4 to 19) 1.89 (0.70 to 5.13)
Notes:
1. RDOR = Relative DOR= index test DOR/ SAP DOR.
2. RDOR calculated as all direct studies had SAP as one of the tests. Values of RDOR > 1 indicate that the test performed better than SAP in the study and values < 1 indicate that the test performed worse than SAP.
Table 4 Pair-wise indirect comparisons of tests in a single HSROC model. FDT Ophthalmoscopy (60%, 94%) versus Optic disc photography (73%, 89%) versus RNFL photography (75%, 88%) versus HRT II (86%, 89%) versus OKP (86%, 90%) versus SAP supra (71%, 85%) versus SAP threshold (88%, 80%)
versus C-20-1 (92%,94%)versus C-20-5 (78%,75%)versus GAT (46%, 95%) Optic disc
photo -12 (-46 to 20)6 (-7 to 21) RNFL photo -14 (-50 to 26)
6 (-7 to 30)
-2 (-31 to 34) -0 (-17 to 24) HRT II -24 (-57 to 14)5
5 (-9 to 30)
-12 (-38 to 22) -1 (-18 to 24)
-10 (-45 to 25) -1 (-25 to 24)
OKP -20 (-54 to 19)
4 (-9 to 26)
-8 (-35 to 27) -2 (-18 to 21)
-6 (-43 to 30) -1 (-26 to 22)
4 (-29 to 38) -1 (-26 to 22) SAP supra -10 (-43 to 20)
9 (-4 to 22)5
2 (-23 to 25) 3 (-13 to 17)
4 (-31 to 29) 3 (-21 to 18)
14 (-18 to 36) 4 (-21 to 19)
10 (-24 to 34) 5 (-18 to 19) SAP threshold -26 (-58 to 2)4
14 (-2 to 37)4
-14 (-38 to 7)5 8 (-11 to 31)
-12 (-46 to 12) 8 (-17 to 32)
-2 (-34 to 18) 9 (-18 to 33)
-6 (-39 to 16) 10 (-15 to 34)
-16 (-37 to 5)5 5 (-12 to 28) C-20-1 -30 (-62 to -0)3
0 (-11 to 18)
-18 (-42 to 6)5 -6 (-21 to 12)
-16 (-50 to 10) -5 (-29 to 13)
-6 (-38 to 17)5 -4 (-29 to 14)
-10 (-42 to 14) -3 (-26 to 14)
-20 (-40 to 3)4 -8 (-22 to 9)
-4 (-23 to 18) -13 (-36 to 6)5 FDT
C-20-5 -11 (-49 to 32) 19 (-2 to 53)4
1 (-30 to 40) 12 (-10 to 47)
3 (-36 to 44) 12 (-16 to 47)
12 (-23 to 52) 13 (-16 to 49)
9 (-29 to 49) 14 (-13 to 49)
-1 (-29 to 38) 10 (-12 to 45)
15 (-11 to 53) 5 (-23 to 41)
19 (-10 to 57)5 18 (-6 to 53)5
GAT 15 (-22 to 47)
-0 (-12 to 7)
27 (-4 to 53)4 -6 (-21 to 3)5
29 (-10 to 57) -6 (-30 to 4)
39 (3 to 64)3 -5 (-30 to 5)
35 (-2 to 62)4 -4 (-26 to 5)
25 (-2 to 50)4 -9 (-22 to 0)4
41 (14 to 64)3 -14 (-37 to -1)3
45 (17 to 68)3 -0 (-18 to 8)
26 (-16 to 57) -19 (-53 to -0)3 Notes:
1. In the column headings the summary sensitivity and specificity values from the HSROC meta-analysis models are shown after the name of the test. 2. Test A (column) versus test B (row) = A – B. For each comparison, within each cell, the top row is the median difference in sensitivity (95% CrI) and the
Appendix 1 Summary of sensitivity, specificity and DOR for tests included in the HSROC meta-analysis models.
Test Number of
studies Common cutoff Sensitivity %(95% CrI) Specificity %(95% CrI) (95% CrI)DOR
Ophthalmoscopy 5 VCDRM0.7 60 (34 to 82) 94 (76 to 99) 26 (6 to 110)
Optic disc photography 6 VCDRM0.6 73 (61 to 83) 89 (50 to 99) 22 (3 to 148) RNFL photography 4 Diffuse and/or localised defect 75 (46 to 92) 88 (53 to 98) 23 (4 to 124) HRT II 3 M1 borderline or outside normal limits 86 (55 to 97) 89 (66 to 98) 51 (11 to 246)
C-20-1 3 1 abnormal point 92 (65 to 99) 94 (73 to 99) 181 (25 to 2139) FDT
C-20-5 5 1 abnormal point 78 (19 to 99) 75 (57 to 87) 10 (0.7 to 249)
OKP 4 1 abnormal point 86 (29 to 100) 90 (79 to 96) 58 (4 to 1585)
SAP suprathreshold 9 M3 points missing 71 (51 to 86) 85 (73 to 93) 14 (6 to 34)
SAP threshold 5 AGIS scoreM3 88 (65 to 97) 80 (55 to 93) 30 (6 to 159)
GAT 9 IOP > 21 mmHg 46 (22 to 71) 95 (89 to 97) 15 (4 to 49)
Notes:
1. The common cutoff was considered to also include the following cutoffs: Ophthalmoscopy (discs graded as normal or suspicious, subjective criteria); Optic disc photography (VCDRM0.7, normal/glaucomatous disc based on majority opinion of observers); RNFL photography (NFL lost); HRT II (global or 1 of the 6 segments flagged abnormal); OKP (1 or more points missing, ifM 1 chart numbers consistently made the black stimulus disappear); SAP suprathreshold (M17 relative or absolute defects and/or cluster of 8 in any one quadrant,M4 abnormal points in any single quadrant, sufficient points to drop the indicator into the suspicious zone or below, 3 abnormal adjacent points, M 1 missed point, optometrist judgement, at least 1 absolute defect associated with 1 relative defect or 3 adjacent relative defects or 4 non-adjacent relative defects or sure nasal step); SAP threshold (cross meridional, GHT abnormal/borderline, LDA 59 points, mirror image method, GHT outside normal limit and/or PSD p<0.05 in on or both eyes); GAT (IOPM21 mmHg, IOP 21-22 mmHG, IOP > 22 mmHG).