When less is more in Neural Quality Estimation of Machine Translation.
An industry case study
Dimitar Shterionov∗ F´elix do Carmo∗ Joss Moorkens∗ Eric Paquin∗ Dag Schmidtke† Declan Groves† Andy Way∗
∗ADAPT Centre / Dublin City University, Dublin Ireland,
{firstname.lastname}@adaptcentre.ie
†Microsoft E+D Global, Ireland,[dags,degroves]@microsoft.com
Abstract
Quality estimation (QE) of machine trans-lation (MT), the task of predicting the quality of an MT output without human references, is particularly suitable in dy-namic translation workflows, where trans-lations need to be assessed continuously with no specific reference provided. In this paper, we investigate sentence-level neural QE and its applicability in an industry use-case. We assess six QE approaches, which we divide into two-phase and one-phase approaches, based on quality and cost. Our evaluation shows that while two-phase sys-tems perform best in terms of the predicted QE scores, their computational costs sug-gest that alternatives should be considered for large-scale translation production. 1 Introduction
Quality estimation (QE) (Specia et al., 2009) is the process of predicting the quality of a machine translation (MT) system without human interven-tion or reference translainterven-tions. QE can be applied at word-, sentence-, or document-level. In the case of document- and sentence-level, the task is typi-cally to predict a score that corresponds to a target evaluation criteria or metric (e.g., BLEU (Papineni et al., 2002), TER (Snover et al., 2006), etc.), i.e. it is a regression task. In this work, we investigate sentence-level QE, estimating TER scores.
QE has been the focus of multiple WMT shared tasks. In such tasks the common evaluation cri-teria are metrics that score the quality of the esti-mates, such as Pearson’s r or Root Mean Square
c
2018 The authors. This article is licensed under a Creative Commons 3.0 licence, no derivative works, attribution, CC-BY-ND.
Error (RMSE). However, in a commercial setting, it is important to set a balance between perfor-mance and efficiency. Furthermore, a QE solu-tion for industry needs to be generalizable and as language-independent as possible. Feature-based methods have ranked highly in such tasks. How-ever, neural methods have recently not only outper-formed feature-based ones, from a quality perspec-tive, but they also provide a more generalizable and language-independent solution. In our work, we first assess the predictive capabilities of neu-ral QE (NQE) systems applied on MT data from the IT software domain, i.e. UI strings, for the English→German and English→Spanish language pairs. We then focus on the efficiency aspect. We further compare the performance of QE systems from a business perspective, i.e. using industry-established metrics.
Our contribution is two-fold: the analysis and comparison of NQE approaches, and the imple-mentation of a new efficient method that scores on a par with the others. The use of QE in commercial setting has been discussed in previous work (As-tudillo et al., 2018), but there are, to our knowl-edge, no published results of tests as extensive as ours of the application of QE to commercial data.
2 State-of-the-art
The state-of-the-art in QE was most recently pre-sented at WMT 2018 (Specia et al., 2018a).
black-box (or system-independent) or glass-black-box (system-dependent).
In contrast to traditional QE systems, NQE sys-tems process source and target text in an end-to-end fashion, using neural networks (NN). It is not necessary to explicitly define QE features to feed to the NQE system. Similar to the encoder-decoder approach for MT (Sutskever et al., 2014; Cho et al., 2014; Bahdanau et al., 2015), NQE systems use one or multiple encoders to compress the input information in a context vector and use this vector to predict a quality score; the context vector im-plicitly encodes features used to learn estimates.
One-phase and two-phase approaches We classify QE in two groups: one-phase and two-phase approaches. The former have a unified ar-chitecture and are trained to generate estimates in an end-to-end fashion, with no distinct intermedi-ate stages. The latter employ two phases in training and in testing, typically involving two networks that are trained separately; the first one targets decomposing the input (a source sentence and its MT) into features, which are then used as input for the second network to compute a QE score.
NQE Systems The top-scoring systems in the segment-level task at WMT 2018 were QEBrain (Wang et al., 2018) and UNQE (Li et al., 2018), both two-phase systems.
QEBrain is an extension of the ‘Neural Bilin-gual Expert model’ (Fan et al., 2018) with ex-tra features. The first phase exex-tracts high latent semantic and alignment information between the source and the translation output. Based on Trans-former (Vaswani et al., 2017), this network builds a conditional language model – the neural bilin-gual expert. It is complemented with an error-prediction model which identifies possible mis-matches of words. In the second phase, the fea-tures of these two models are used in a bi-LSTM model to output the QE score.
The POSTECHarchitecture (Kim et al., 2017) consists of aword predictormodel and an estima-tormodel. The predictor model is used to extract QE feature vectors (QEFVs) which are employed to train the estimator: a logistic regression model based on a summary representation of the QEFVs. deepQuest (Ive et al., 2018) implements two types of architectures: (i) BiRNN (a one-phase approach) and (ii) POSTECH (a two-phase ap-proach). The BiRNN architecture employs two
bidirectional RNNs (with GRU units) whose out-puts are combined through an attention mecha-nism. The resulting vector representation is used to produce an estimate of quality. Similarly, the deepQuest implementation of POSTECH uses a bidirectional RNN to compute QEFVs.
The first-phase models of systems like QEBrain and POSTECH are typically trained on parallel data. One-phase systems, such as thedeepQuest BiRNN, are trained only on QE data: source, MT output, and a score.
3 SiameseQE
Siamese NNs were proposed initially for the prob-lems of signature verification (Bromley et al., 1993) and fingerprint recognition (Baldi and Chau-vin, 1993). The model consists of two (or more) identical networks, encoding different inputs. The two networks share the same configuration with mirrored weights. Siamese NNs have also been applied to address the task of text similarity (Yih et al., 2011; Mueller and Thyagarajan, 2016) and image recognition (Koch et al., 2015).
With the aim of providing an efficient QE sys-tem, we implemented our SiameseQE with one LSTM-based RNN that encodes both source and MT sentences in so called left and right passes, respectively. The encoded representations – the RNN outputs – of both sentences are used to com-pute a distance score which is optimised through an MSELoss with respect to the expected TER score. We use Euclidean distance in our imple-mentation. Given that we build on a single RNN, we use joint vocabulary so that we could train without mismatch of tokens.
We also explored three types of networks: (i) with no attention; (ii) with Soft Dot Attention (Lu-ong et al., 2015) and (iii) with word-by-word at-tention, as defined in Rockt¨aschel et al. (2015).
Ueffing et al. (2018) presented a Siamese NN system for QE with two LSTM RNNs with tied weights, using cosine similarity. Their application identified quality levels of automatically generated product titles. We aim to further optimise the per-formance via a single RNN (with LSTM units) and by implementing attention mechanisms.
4 Use-case and data
sys-tems we used proprietary Microsoft data collected from post-edits scored using TER. The language pairs are German (EN-DE) and English-Spanish (EN-ES). We also used parallel data from Europarl (Koehn, 2005) and from Microsoft for two-phase systems, abbreviated as EU and MS re-spectively. In Table 1 we present details of the QE and the extra parallel training data.
To train the one-phase systems, only the QE data was used. To train the two-phase systems (POSTECH systems and QEBrain) for EN-DE and EN-ES we used parallel data (EU or MS) for the feature-extraction part of the model, i.e. for the first phase, and the provided QE data for the QE score computation model, i.e. the second phase. We trained one POSTECH system per language pair on EU data, and another on the MS parallel data sets. The evaluation of these four systems (two per language) led to the conclusion that there were no advantages in the use of the EU data, so for the experiments with the QEBrain system we used only MS parallel data.
QEdataEN-DE EN-ES Extra data EN-DE EN-ES
Train 67 718 46 217 EU 1 863 144 1 850 469 Dev 7 524 5 136 MS 1 741 218 1 581 875 Test 32 898 34 623
Table 1:Number of sentences in the QE data sets and number of parallel sentences of extra data used to train the feature-extraction part of the two-phase systems.
5 Experimental setup
We experimented with three different systems: deepQuest, QEBrain and SiameseQE. While the first two systems have been developed over an extensive period of time, have undergone signifi-cant empirical evaluations, and have achieved high rankings in WMT QE shared tasks, the last one is developed by our team for maximum efficiency.
5.1 Hardware and software setup
We trained our models on two GPU-powered ma-chines: one with2 × nVidia TitanX, 64GB RAM andan Intel(R) Core(TM) i7-5960XCPU; and an-other with4 ×nVidia GTX 1080Ti, 128GB RAM
and an Intel(R) Core(TM) i7-7820X CPU. Each model is trained and evaluated using one GPU, with the exception of theQEBrainones, which re-quired a lot of computational power and for which we used 4 GPUs to train one model in parallel, as recommended. For fair comparison, we
mir-rored the software and configurations on the two machines using Anaconda3virtual environments.
5.2 Systems hyperparameters
deepQuest BiRNN and POSTECH. We used the EU and MS parallel data (see Table 1) to train the POSTECH models for EN-DE and EN-ES. We used the default vocabulary size of 30 000 tokens. Sentences were clipped after length 70. The mini-batch size was set to 70.
QEBrain We used the following settings for the Expert model: max-vocab-size=49999; num-train-steps=75000; embedding-size=512; num-nits=512; num-layers=2; batch-size=512; infer-batch-size=24; metrics=BLEU; src-max-len=70; tgt-max-src-max-len=70; num-gpus=4; For theQE model: num-train-steps=50000; rnn-units=128; rnn-layers=1; qe-batch-size=10; infer-batch-size=10; metrics=pearson.
SiameseQE We used the following options: Vocabulary: joint; size: EN-DE 62 468, EN-ES 41 729; batch size: 64; RNN type: bidirectional, LSTM;RNN units: 64;layers:2;embedding size: 256; learning optimizer: Adam (Kingma and Ba, 2014);learning rate:0.001.
6 Evaluation 6.1 Business impact
We compared the performance of the NQE systems according to Microsoft’s business metrics, devel-oped to maximise the use of MT output. As a base-line we used a non-neural QE system based on 33 features (referred to as “33features”).
The following evaluation focuses only on strings above 10 words, with TER scores below 0.3, in-dicative of good quality. The metrics we used are: AUC - area under the curve: a metric of the ca-pacity of classification of the model;
Precision: these values are measured as ratios of words that are associated with correct TER scores, within a fine-grained optimal QE score threshold. Distance to ideal (DtI): the distance between throughput scores and the respective value for an ideal QE system (a system with 100% precision, 100% recall), as estimated by Microsoft. The ideal values for throughput are:15.49%for German and 29.32%for Spanish.
The scores in these metrics are summarised in Table 2 and Table 3.
System AUC↑ Thr.↑ Gain↑ Prec.↑ DtI↓
BiRNN 0.7475 12.63% 2.83% 36.97% 2.86% POST. EU 0.7154 12.38% 2.58% 36.74% 3.11% POST. MS. 0.7047 11.95% 2.15% 34.50% 3.54% QEBrain 0.8091 13.35% 3.55% 40.33% 2.14%
S. NoATT 0.6004 10.39% 0.59% 26.64% 5.10% S. DotATT 0.7342 12.57% 2.77% 37.39% 2.92% S. w2wATT 0.6698 12.43% 2.63% 35.67% 3.06% 33features 0.6639 11.10% 1.30% 29.24% 4.39%
Table 2: Business evaluation scores of QE systems for EN-DE (best scores marked in bold).
System AUC↑ Thr.↑ Gain↑ Prec.↑ DtI↓
BiRNN 0.6683 21.77% 5.02% 63.42% 7.55% Post. EU 0.6401 21.01% 4.26% 62.10% 8.31% Post. MS 0.6708 21.92% 5.16% 63.61% 7.40% QEBrain 0.7259 22.82% 6.06% 65.38% 6.50%
S. NoATT 0.5359 16.65% -0.11% 54.95% 12.67% S. DotATT 0.6557 21.87% 5.12% 63.62% 7.45% S. w2wATT 0.6008 21.36% 4.60% 62.71% 7.96% 33features 0.6617 21.63% 4.88% 63.14% 7.69%
Table 3: Business evaluation scores of QE systems for EN-ES (best scores marked in bold).
An interesting observation in these tables is the fact that, although all systems were configured in the same way (with the exception of the vocabulary sizes determined by the available data), the scores can be clearly grouped by language pairs:
• For throughput, gain and precision, all systems trained with Spanish data achieve better scores than any system trained with German data. For example, Spanish systems show throughput values of between 22.82% and 16.65%, but the German systems are all below 13.35%.
•However, regarding distance to the ideal QE sys-tem, all German-trained systems are better than the Spanish ones: the distance to the ideal values for German is between 2.14% and 5.10%, while for Spanish it is 6.5% or more.
This clear separation between languages shows the impact of fine-tuning and optimising metrics, for different types of data and language.
The ranking of systems for German data shows that QEBrain performs best according to all met-rics. The BiRNN system takes second place in all metrics except precision, in which the usually third system, SiameseDotATT, replaces it. The sys-tem that scores consistently lowest is the Siame-seNoATT, followed by the 33features system.
The ranking of systems trained with Spanish data is very similar to the German ranking, with a few exceptions. QEBrain is confirmed as the best system according to all metrics. The second-best system according to most metrics (except preci-sion) is the Postech MS system, instead of BiRNN. The SiameseDotATT ranks third for most met-rics, except precision. In all metmet-rics, the 33fea-tures system outperforms three systems (Siame-seW2wATT, Postech EU and SiameseNoATT), and in terms of AUC, it also outperforms the SiameseDotATT system.
6.2 Model performance
We also evaluated the systems’ performance with standard metrics used for the evaluation of QE sys-tems: Pearson correlation coefficient (Pearson r), RMSE and MAE.Pearsonr is a measurement of the strength of the linear dependency between two variables. Both RMSE and MAE are measures of the differences between predicted and expected values.
Previous work has noted that in order to avoid the biases and limitations of each metric, it is necessary to consider them jointly (Specia et al., 2018b). We define Equation (1) to combine these metrics and derive a rank score (denoted by ω),
where r, M AE and RM SE are the arithmetic
means of the sets of scores for each of the respec-tive metrics.
ωi = (0.5 +0.5r×ri)−(M AEM AEi +RM SERM SEi)/2 (1)
The intuition is to allow ascending metrics to subsume descending ones and normalize over the set of all tested systems, thus generating a ranking score that takes into account not only the individ-ual metrics and their combination, but also the dis-tribution of these metrics’ scores over all investi-gated systems. This method takes into account not only the ranking of the systems according to each metric, but also the distances within each metric.
System Pearson↑ MAE↓ RMSE↓ ω↑ Rank BiRNN 0.4811 0.2107 0.2819 0.3169 2 Post. EU 0.4102 0.2194 0.2838 0.1883 6 Post. MS 0.4255 0.2153 0.2770 0.2312 5 QEBrain 0.6232 0.1753 0.2416 0.6726 1 S. NoATT 0.2535 0.2555 0.3176 -0.1803 7 S. DotATT 0.4277 0.2132 0.2755 0.2416 4 S. w2wATT 0.2869 0.2545 0.3609 -0.1990 8 33features 0.4585 0.2124 0.2729 0.2938 3
Table 4: Performance and rank scores for experiments on EN-DE.
System Pearson↑ MAE↓ RMSE↓ ω↑ Rank BiRNN 0.3599 0.2226 0.2914 0.0930 2 Post. EU 0.3055 0.2534 0.3214 -0.1036 6 Post. MS 0.3636 0.2292 0.2975 0.0747 3 QEBrain 0.5235 0.1856 0.2455 0.4940 1 S. NoATT 0.1115 0.2216 0.2750 -0.2530 7 S. DotATT 0.3206 0.2297 0.2898 0.0212 5 S. w2wATT 0.2993 0.3084 0.4237 -0.3975 8 33features 0.3650 0.2349 0.2935 0.0712 4
Table 5: Performance and rank scores for experiments on EN-ES.
These are the most important observations re-garding the different system performance scores:
• QEBrain is clearly the best-performing system. It ranks first across all metrics by quite some distance to the other systems.
• BiRNN ranks second in both language pairs,
although its ranks per metric are very different. In German, it ranks second in terms of Pearson’s r
score and MAE, but it is only fifth for RMSE; in Spanish, it is the third system (for MAE only) or fourth system in each metric rank. However, its consistent scores make it second-best.
• The next best-ranked systems are either the POSTECH MS or the Siamese DotATTN.
• The baseline system (“33features”) has very
good scores for German (second best for RMSE, and third in the other scores). In Spanish, it reaches second position for Pearson’sr, but ranks lower for the other metrics.
The rank and scores of the Siamese NoATT sys-tem called our attention:
• In Spanish, this system ranks quite highly ac-cording to MAE and RMSE (it is the second-best system according to these metrics), but it scores very poorly according to Pearson’sr. In the case of EN-ES, the variance in this system’s predictions is very low, but so is the mean: σ2 = 0.0012,
µ = 0.2909; and the max and min values are
max = 0.4435, min = 0.2159. The error mea-surement based on the mean difference between
predicted and expected values will also be low, as there will not be extreme differences per assessed pair. However, Pearson’srtakes this into account
and, as seen from Table 5, gives such a system a lower score. This further supports the claim that, although widely used in QE research, these three metrics should not be considered independently.
•In the case of EN-DE, the variance, mean, min and max values are broader and thus cover the dis-tribution of TER scores more realistically.
Our ranking method balanced these disparate re-sults, making this system rank low, as expected, in the global ranking for both language pairs.
6.3 Cost of the different systems
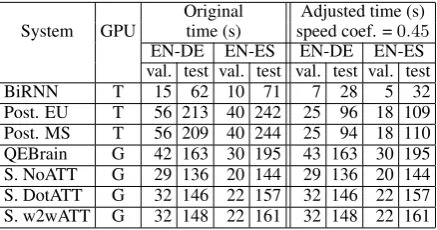
Table 6 shows training times, and Table 7 inference times, i.e., the time for the model to generate TER scores for the given input. These tables also show adjusted values for cost, as described next.
The first three systems (BiRNN, POSTECH EU and POSTECH MS) were trained on a TitanX ma-chine, while the last four were trained on a GTX 1080Ti system. To compensate for the speed dif-ference of these machines and obtain realistic com-parative times, we ran the BiRNN model on the GTX 1080Ti machine and we calculated a speed coefficient. We also took into account that QE-Brain was trained in parallel on 4 GPUs, using TensorFlow’sin-graphreplication. To further ac-count for this, we multiplied the time consumed for training the expert model by 4.
The ranking according to GPU costs shows how the total cost of QEBrain significantly exceeds all others: by a factor of approximately4for the sec-ond slowest system, by a factor of95for the fastest EN-DE system and a factor of 62 for the fastest EN-ES system. The biggest share of the con-sumed time of two-phase systems is during phase 1, when systems are learning word-level features from parallel data. The most cost-effective sys-tems are one-phase: Siamese syssys-tems and Deep-Quest BiRNN. In fact, all one-phase systems train more than 10 times faster than the fastest two-phase system. Also, since they can run on a single GPU, one-phase systems can train different mod-els in parallel, on multi-GPU machines.
Original Adjusted time (m) System GPU time (m) GPU speed coef. =0.45
EN-DE EN-ES EN-DE EN-ES
I II Tot. I II Tot. I II Tot. I II Tot.
BiRNN T – – 265 – – 152 – – 119 – – 68
Post. EU T 1 770 262 2 032 1 859 159 2 018 797 118 915 837 72 908 Post. MS T 1 118 160 1 268 1 752 154 1 906 503 72 575 788 69 858 QEBrain G 859 107 966 863 91 954 3 436 107 3 543 3 452 91 3 543
S. NoATT G – – 37 – – 86 – – 37 – – 86
S. DotATT G – – 102 – – 80 – – 102 – – 80
[image:6.595.117.481.71.186.2]S. w2wATT G – – 75 – – 62 – – 75 – – 62
Table 6: Training time in minutes for phase 1, phase 2 and total, denoted asI,IIandTot. respectively. Training time for single-phase systems is only marked as total for readability.
Original Adjusted time (s) System GPU time (s) speed coef. =0.45
EN-DE EN-ES EN-DE EN-ES val. test val. test val. test val. test BiRNN T 15 62 10 71 7 28 5 32 Post. EU T 56 213 40 242 25 96 18 109 Post. MS T 56 209 40 244 25 94 18 110 QEBrain G 42 163 30 195 43 163 30 195 S. NoATT G 29 136 20 144 29 136 20 144 S. DotATT G 32 146 22 157 32 146 22 157 S. w2wATT G 32 148 22 161 32 148 22 161
Table 7: Inference time (in seconds) for the validation and the test sets. Number of sentence pairs for the validation set for EN-DE and EN-ES: 7525, 5136 respectively; for the test set for EN-DE and EN-ES: 32898, 34623 respectively.
several factors that play a role here, one of which is the batch size. In the experiments for the Siamese networks we invoke per-sentence inference, i.e., the batch size during test is equal to1.
In a commercial setting, latency is critical, as it is essential that a deployed QE model does not in-troduce any additional latency into the workflow. A factor in favour of the one-phase systems is memory consumption. While typically two-phase systems would consume almost 100% of the GPU memory, the one-phase systems with our configu-ration would only consume between 70% – 90%. This would suggest that, by adapting the training hyperparameters of the one-phase systems to max-imally utilise the GPU hardware, one can expect that either one model can be trained faster, or mul-tiple models can be trained on the same GPU, e.g., by adapting the batch or vocabulary size. We also ought to note the size of models and additional files stored on the disk as an extra cost worth consider-ing, one which is optimal for SiameseQE systems. While the numbers in the previous rankings are in favour of the two-phase systems, we suggest that these rankings should be considered in combina-tion with costs of implementacombina-tion and use of such systems. We also point out that other business
fac-tors must be taken into account when evaluating such systems. For example, two-phase systems re-quire more training data, which may not be easily available, or of sufficiently high quality. In addi-tion, other computing resources increase the cost of ownership or rental of equipment, or the mainte-nance and optimisation cost for such systems. All these issues should be addressed in future research.
7 Conclusion – discussion of results and future work
This paper investigates NQE applied to industry data. We tested existing deepQuest (BiRNN and POSTECH) and QEBrain systems and the newly-introduced SiameseQE (no attention, Soft Dot at-tention and word-to-word atat-tention). We con-ducted a series of experiments to test the perfor-mance of these systems on data provided by Mi-crosoft and with additional training data.
Our evaluation shows that the QEBrain system outperforms all others, but is by far the most com-putationally expensive. An important outcome of our work is the observation that simpler, one-phase systems like BiRNN and Siamese networks show very promising results with low computa-tional costs and easy implementations. In addi-tion, the Siamese NN systems evidence reason-able room for improvement. Using attention yields much better results.We should also note that the baseline system – a statistical QE system – per-forms quite well. This suggests that statistical, feature-based systems can potentially be integrated into new hybrid approaches.
Acknowledgements The ADAPT Centre for Digital Content Technology is funded under the SFI Research Cen-tres Programme (Grant 13/RC/2106) and is co-funded under the ERD Fund. F´elix do Carmo collaborates under an Horizon 2020 programme: EDGE COFUND Marie Skodowska-Curie Grant Agreement no. 713567.
[image:6.595.73.292.234.349.2]References
Astudillo, Ram´on Fern´andez, Jo˜ao Grac¸a, and Andr´e Martins. 2018. Translation Quality Estimation and Automatic Post-Editing - Workshop Proceedings. In
The 13th Conference of The Association for Machine Translation in the Americas (AMTA2018), Boston, USA.
Bahdanau, Dzmitry, Kyunghyun Cho, and Yoshua Ben-gio. 2015. Neural machine translation by jointly learning to align and translate. InProceedings of the 6th International Conference on Learning Represen-tations (ICLR 2015), San Diego, CA, USA. 15pp. Baldi, Pierre and Yves Chauvin. 1993. Neural
net-works for fingerprint recognition. Neural
Computa-tion, 5(3):402–418.
Bromley, Jane, Isabelle Guyon, Yann LeCun, Eduard S¨ackinger, and Roopak Shah. 1993. Signature ver-ification using a ”siamese” time delay neural
net-work. InProceedings of the 6th International
Con-ference on Neural Information Processing Systems, NIPS’93, pages 737–744, San Francisco, CA, USA. Morgan Kaufmann Publishers Inc.
Cho, Kyunghyun, Bart van Merri¨enboer, C¸alar G¨ulc¸ehre, Dzmitry Bahdanau, Fethi Bougares, Hol-ger Schwenk, and Yoshua Bengio. 2014. Learning phrase representations using RNN encoder–decoder for statistical machine translation. InProceedings of the 2014 Conference on Empirical Methods in Nat-ural Language Processing, pages 1724–1734, Doha, Qatar.
Fan, Kai, Bo Li, Fengming Zhou, and Jiayi Wang. 2018. ”bilingual expert” can find translation errors.
CoRR, abs/1807.09433.
Ive, Julia, Fr´ed´eric Blain, and Lucia Specia. 2018. DeepQuest: a framework for neural-based Quality
Estimation. Proceedings of COLING 2018, the 27th
International Conference on Computational Linguis-tics, Sante Fe, New Mexico, USA, pages 3146–3157. Kim, Hyun, Jong-Hyeok Lee, and Seung-Hoon Na.
2017. Predictor-estimator using multilevel task
learning with stack propagation for neural quality
es-timation. InProceedings of the Second Conference
on Machine Translation, WMT 2017, Copenhagen, Denmark, September 7-8, 2017, pages 562–568. Kingma, Diederik P. and Jimmy Ba. 2014. Adam:
A method for stochastic optimization. CoRR,
abs/1412.6980.
Koch, Gregory, Richard Zemel, and Ruslan Salakhut-dinov. 2015. Siamese neural networks for one-shot image recognition. InProceedings of the 32nd Inter-national Conference on Machine Learning (JMLR: W&CP 2015), Lille, France.
Koehn, Philipp. 2005. Europarl: A Parallel Corpus
for Statistical Machine Translation. In Conference
Proceedings: the 10th Machine Translation Summit (MTSummit 2005), pages 79–86, Phuket, Thailand.
Li, Maoxi, Qingyu Xiang, Zhiming Chen, and Ming-wen Wang. 2018. A unified neural network for qual-ity estimation of machine translation. IEICE Trans-actions, 101-D(9):2417–2421.
Luong, Thang, Hieu Pham, and Christopher D. Man-ning. 2015. Effective approaches to attention-based
neural machine translation. In Proceedings of the
2015 Conference on Empirical Methods in Natural Language Processing, (EMNLP 2015), pages 1412– 1421, Lisbon, Portugal.
Mueller, Jonas and Aditya Thyagarajan. 2016.
Siamese recurrent architectures for learning sentence
similarity. In Proceedings of the Thirtieth AAAI
Conference on Artificial Intelligence, AAAI’16, pages 2786–2792, Phoenix, Arizona, USA.
Papineni, Kishore, Salim Roukos, Todd Ward, and Wei-Jing Zhu. 2002. BLEU: A Method for Automatic
Evaluation of Machine Translation. InProceedings
of the 40th Annual Meeting on Association for Com-putational Linguistics, pages 311–318, Philadelphia, Pennsylvania, USA.
Rockt¨aschel, Tim, Edward Grefenstette, Karl Moritz Hermann, Tom´as Kocisk´y, and Phil Blunsom. 2015. Reasoning about entailment with neural attention.
CoRR, abs/1509.06664.
Snover, Matthew, Bonnie Dorr, Richard Schwartz, Lin-nea Micciulla, and John Makhoul. 2006. A study of translation edit rate with targeted human annotation. InProceedings of the 7th Conference of the. Associ-ation for Machine TranslAssoci-ation of the Americas. Vi-sions for the Future of Machine Translation (AMTA 2006), pages 223–231, Cambridge, Massachusetts, USA.
Specia, Lucia, Nicola Cancedda, Marc Dymetman, Marco Turchi, and Nello Cristianini. 2009. Esti-mating the sentence-level quality of machine
trans-lation systems. In Proceedings of the 13th Annual
Conference of the European Association for Machine Translation (EAMT 2009), pages 28–35, Barcelona, Spain.
Specia, Lucia, Kashif Shah, Jos´e G. C. de Souza, and Trevor Cohn. 2013. Quest - A translation
qual-ity estimation framework. In 51st Annual
Meet-ing of the Association for Computational LMeet-inguistics, (ACL 2013), Proceedings of the Conference System Demonstrations, pages 79–84, Sofia, Bulgaria. Specia, Lucia, Fr´ed´eric Blain, Varvara Logacheva,
Ram´on Fern´andez Astudillo, and Andr´e F. T. Mar-tins. 2018a. Findings of the WMT 2018 shared
task on quality estimation. In Proceedings of the
Third Conference on Machine Translation: Shared Task Papers, (WMT 2018), pages 689–709, Belgium, Brussels.
Specia, Lucia, Carolina Scarton, and Gustavo Henrique
Paetzold. 2018b. Quality Estimation for Machine
Sutskever, Ilya, Oriol Vinyals, and Quoc V. Le. 2014. Sequence to sequence learning with neural networks. In Proceedings of Advances in Neural Information Processing Systems 27: Annual Conference on Neu-ral Information Processing Systems (NIPS 2014), pages 3104–3112, Montreal, Quebec, Canada.
Ueffing, Nicola, Jos´e GC de Souza, and Gregor Leusch. 2018. Quality estimation for automatically
gener-ated titles of ecommerce browse pages. In
Proceed-ings of the 2018 Conference of the North American Chapter of the Association for Computational Lin-guistics: Human Language Technologies, (NAACL-HLT 2018), pages 52–59, New Orleans, Louisiana, USA.
Vaswani, Ashish, Noam Shazeer, Niki Parmar, Jakob Uszkoreit, Llion Jones, Aidan N Gomez, Łukasz Kaiser, and Illia Polosukhin. 2017. Attention is all
you need. InAdvances in Neural Information
Pro-cessing Systems 30: Annual Conference on Neural Information Processing Systems (NIPS 2017), pages 5998–6008, Long Beach, CA, USA.
Wang, Jiayi, Kai Fan, Bo Li, Fengming Zhou, Boxing Chen, Yangbin Shi, and Luo Si. 2018. Alibaba
sub-mission for wmt18 quality estimation task. In
Pro-ceedings of the Third Conference on Machine Trans-lation (WMT 2018), pages 822–828, Belgium, Brus-sels, October. Association for Computational Lin-guistics.