DEVELOPMENT AND VALIDATION OF A RP-HPLC METHOD FOR
QUANTITATIVE ESTIMATION OF CINACALCET IN TABLET
DOSAGE FORM
Debadash Panigrahi1*, Amiyakanta Mishra1 and Sushant Kumar Sahu2
1
College of Pharmaceutical Sciences, Puri, Baliguali, Puri- Konark Marine Drive Road, Puri,
Odisha, India, 752002.
2
Dept. of Pharmacy, Utkal University, Vani Vihar, Bhubaneswar, Odisha, India, 751004.
ABSTRACT
In the present work a simple, selective, accurate, precise and rapid
RP-HPLC method was developed for quantitative estimation of cinacalcet
in tablet dosage form. This method was developed by using a C18
column with mobile phase a mixture of methanol and phosphate buffer
(pH 6.8) in the ratio 60: 40 v/v at a flow rate 1.0 ml min-1. Detection of
the drug was performed at 232nm using PDA detector. The developed
method was validated as per ICH guideline for linearity, accuracy,
precision, specificity, robustness and selectivity. The developed
method was successfully applied for quantitative estimation of
cinacalcet in its tablet dosage form (Ceracal) having retention time is
2.82 minute and percentage of drug content was found to be 100.45%.
Validation study result revealed that the method is specific, accurate, precise, reliable and
reproducible for estimation of cinacalcet in it’s dosage form. Concentration with in the range
of 5-50 µg/ml was found to be linear. Limit of detection and limit of quantitation was found
to be 0.32 and 0.91μg/ml respectively. Recovery concentration was found to be in the range
99.85-100.14%, with coefficient of variance (COV) < 2.0. High percentage of recovery and
acceptance limit of statistical data for validation study assure that the developed method was
suitable for estimation of cinacalcet in it’s bulk and dosage forms.
KEYWORDS: Cinacalcet, RP-HPLC, Validation and Mobile Phase.
Volume 7, Issue 19, 1016-1025. Research Article ISSN 2277– 7105
Article Received on 29 September 2018,
Revised on 19 October 2018, Accepted on 09 Nov. 2018,
DOI: 10.20959/wjpr201819-13749
*Corresponding Author
Debadash Panigrahi
College of Pharmaceutical
Sciences, Puri, Baliguali,
Puri- Konark Marine Drive
Road, Puri, Odisha, India,
INTRODUCTION
Cinacalcet is a naphthalene derivative calcimimetic agent which mimics the action of calcium
on different organ tissues. It acts as allosteric activators of the calcium sensing receptor
(CaSR) in the parathyroid glands and other tissues.[1-3] It lowers the threshold for CaSR
activation by extracellular calcium ions and diminishes parathyroid hormone (PTH) release
from parathyroid cells during the treatment of hyperparathyroidism in parathyroid carcinoma.
Also used in the treatment of secondary hyperparathyroidism in patients with end-stage renal
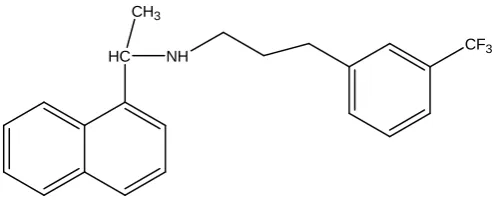
disease on maintenance dialysis therapy to treat higher calcium level.[4] Chemically it is (R
)-N-[1(naphthalene-1-yl) ethyl]-3-[3(trifluoromethyl) phenyl] propan-1-amine with chemical
formula C22H22F3N having molecular weight 357.4 g/mol.[5] Chemical structure of
Cinacalcet is given in Fig.01.
HC CH3
[image:2.595.174.421.311.419.2]NH CF3
Fig. 01: Chemical Structure of Cinacalcet.
Cinacalcet is available in the market with various brand names such as Sensipar, Mimpara,
Ceracal and PTH. Literature survey revealed that very few analytical methods have been
reported for the estimation of Cinacalcet in pure drug and pharmaceutical dosage forms using
liquid chromatography.[6-8] The aim of the present work is to develop a validated simple,
precise and accurate RP-HPLC method with UV detection for the determination of cinacalcet
in tablet dosage form.
MATERIAL AND METHODS
Chemical and Reagents
HPLC grade methanol and water were used for this work. AR grade KH2PO4 (Potassium
Dihydrogen Phosphate) and K2HPO4 (Dipotassium Hydrogen Phosphate) were used to
prepare phosphate buffer. API of Cinacalcet hydrochloride was obtained as a gift sample
from Cheminsol Pharma Solutions Pvt. Ltd, Panvel, Mumbai and the tablets Ceracal
(Cinacalcet hydrochloride, 30mg) was procured from local market manufactured by the
Instrument
Study was carried out with a Shimadzu chromatograph equipped with a LC-10 AT VP
solvent-delivery system, a universal loop injector (Rheodyne 7725 i) of injection capacity of 20 μL, and an SPD-10 AVP UV–Visible photodiode-array detector set at 232 nm. The
equipment was controlled by a PC work station. Separation is carried out on a 25 cm × 4.6
mm, 5-μm particle, Phenomenex Luna C18 column under reversed-phase partition conditions.
The mobile phase was a 60:40 (v/v) mixture of methanol and phosphate buffer (pH 6.8). The
flow rate was 1.0 mL min−1 and the run time was 05 mins. Before analysis both the mobile
phase and sample solutions were degassed by the use of a sonicator and filtered through a
0.2-μm filter. Identification of the compound was established by comparing the retention
times of compound in the sample solution with it’s standard solution. Chromatography was
performed in an air-conditioned room maintained at 25 ± 2°C.
Preparation of Mobile Phase
1000ml of Phosphate buffer of pH 6.8 was prepared by dissolving required quantity of
K2HPO4 and KH2PO4 in HPLC grade water. Mixture of methanol and prepared phosphate
buffer in ratio 60:40 was used as mobile phase for whole study. The prepared mobile phase
was sonicate for degassing and filtered through 0.2µm membrane filter before use.
Preparation of Standard and sample solutions
Cinacalcet (50mg) was weighted accurately and transferred to a 50ml volumetric flask then
dissolved with some amount of methanol and further the volume was adjusted upto 50ml with
methanol to prepare a stock solution of 1000µg ml-1. The solution was sonicate and filtered
by membrane filter and used to prepare different dilutions for study. Twenty tablets of
Ceracal were weighted individually and their average weight was determined. Then the
tablets were crushed to fine powder and powder equivalent to 50mg of drug content was
transfer to a 50ml volumetric flask and dissolved in methanol. The solution was shaken
vigorously for 20 minutes and filtered through whatmann filter paper. The residue was
washed with methanol and adjusts the volume upto 50ml with methanol. Working
concentration solutions were prepared from the above solution and were used for further
study.
Linearity Curve
For linearity study different known concentration dilutions were prepared from the standard
after another and their peak areas were recorded. Calibration curve was plotted between peak
area and concentration. From the curve it was clear that the drug has linearity range between
5-50µg/ml. Unknown assay samples were quantified by reference to the calibration plot.
Assay of Tablet Dosage form
Three replicates of 30µg/ml were prepared from tablet stock solution and sonicate before
injecting into the instrument. These solutions (20µL) were injected one by one for analysis,
then the drug content in these solutions were calculated by extrapolating peak area from the
calibration curve.
Validation
The developed method was further validated as per ICH guidelines for accuracy, Precision,
LOD, LOQ, specificity, sensitivity, and robustness.[9,10]
Accuracy
To check the accuracy of the developed method recovery study was performed by stand
addition method as per ICH guideline. During this to a pre analysed tablet sample solution
known concentration of standard drug solutions were added and % of drug recovery was
calculated.
Precision
Precision of the method was verified by repeatability study and intermediate precision study.
Three replicates of the tablet formulation were analysed for the repeatability study. The
standard deviation, coefficient of variance and standard error were calculated. Intermediate
precision of the method was checked by assay the sample solution on same day at an interval
of one hour (intraday precision) for three hours and on three different days (interday
precision).
LOD & LOQ
Limit of Detection (LOD) is the lowest amount of analyte in a sample that can be detected
under the stated experimental conditions. It is calculated by using the formula, LOD= 3.3*
SD/Slope.
Limit of Quantitation (LOQ) is the lowest amount of analyte in a sample that can be
quantified with acceptable precision and accuracy under the stated experimental conditions. It
Where SD= Standard deviation, obtained by injecting replicates of the sample and slope is
obtained from the calibration curve of the analyte.
Specificity and Robustness
Specificity was assessed by comparing the chromatograms of tablet solution and the drug
standard solution. Because the retention time of the drug for standard solution and tablet
solution were identical, and no co-eluting peaks from the diluents were observed indicates the
method was specific for quantitative estimation of the drug in the commercial formulation.
Robustness of the method was investigated under a variety of conditions like change in flow
rate (±0.2 ml/min) and change in mobile phase composition. In each variation analysis was
made in replicates and %COV of peak areas were determined.
RESULT AND DISCUSSION
Method Development and Optimization
Initial studies revealed that the drug is highly soluble in methanol, acetonitrile, sparingly
soluble in tetrahydrofuran. A standard solution (50μg/ml) of cinacalcet was scanned in the
range of 200-400 nm and the maximum absorption was found at 232 nm. Hence 232nm was
selected as the detection wavelength for the analysis of the drug. Column chemistry, solvent
type, solvent strength (volume fraction of organic solvent(s) in the mobile phase and pH of
the buffer solution) and flow rate were varied to determine the chromatographic conditions
giving the best separation. The mobile phase conditions were optimised so there was no
interference from solvent and excipients. Other criteria, for example time required for
analysis, appropriate k range for eluted peaks, assay sensitivity, solvent noise, and use of the
same solvent system for extraction of the drugs from the formulations during drug analysis
were also considered.
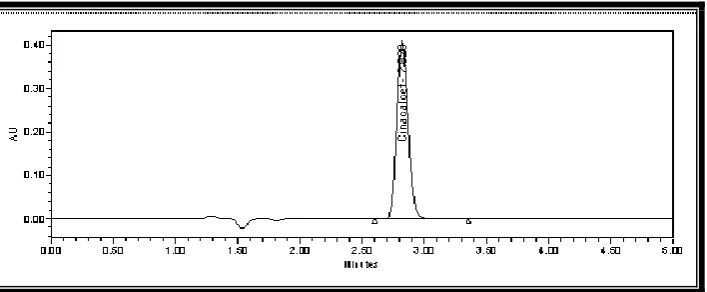
Mixture of methanol and phosphate buffer having pH 6.8 in ratio 60:40 was selected as
mobile phase because the drug gave symmetric peak with good peak shape and optimum
retention time. Flow rate was set at 1.0 ml/minute. The above optimized conditions were used
for further analysis of the drug. Under the optimised conditions the retention time of
cinacalcet was found to be 2.82 min for standard and marketed formulation given in Fig.02
Fig. 02: Chromatogram of Cinacalcet in Standard Solution.
Figure 03: Chromatogram of Cinacalcet in Tablet Solution.
Table 01: Information of Tablet analysis.
Method Validation
Linearity
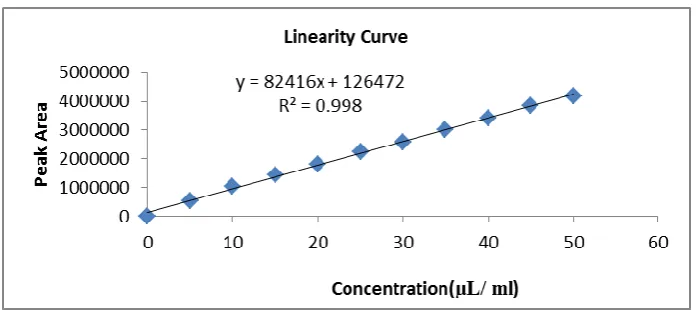
Linearity curve was plotted between peak area and concentration by injecting the dilutions
made from standard stock solution. From the calibration curve it was revealed that the drug
follows linearity in concentration range 5-50 µg/ml. The regression equation of the
calibration curve was found to be y82416x126472 with coefficient correlation value R2
= 0.998. Linearity curve was given in Fig. 04 and values of peak area for each concentration
[image:6.595.124.478.257.403.2]Fig. 04: Linearity Curve of Cinacalcet.
Table 02: Results of Linearity Study.
S. No. Concentration (µg/ml) Mean Peak Area COV %
1 5 515865 0.321 2 10 1028408 0.309 3 15 1434992 0.289 4 20 1818818 0.268 5 25 2230326 0.288 6 30 2565298 0.129 7 35 3013991 0.318 8 40 3406181 0.239 9 45 3854125 0.215 10 50 4187597 0.527 COV- Coefficient of Variance.
Accuracy
Accuracy of the method was confirmed by performing recovery study. During this to a pre
analysed tablet solution of 20 µg/ml known amount of standard drug solution (80%,100%
and 120% of drug content) were mixed and % of drug recovery were calculated by
extrapolating the peak areas from calibration curve equation. Drug recovery was found to be
with in concentration range of 99.85-100.14% with COV (%) < 2, indicates the developed
method is accurate for quantitative estimation of cinacalcet in it’s formulation. The result of
recovery study was given in Table.03.
Table 03: Result of Recovery Study.
S. No. Amount of Drug taken
(µg/ml)
Amount of drug added
% of Recovery COV (%)
% µg/ml
1
20
Precision
Intra and Inter day precision study of the tablet solutions were performed and the result of the
study was given in Table.04. Precision study clear that this method is précised for
quantitative estimation of cinacalcet as the statistical data for the intra and inter study were
within the acceptable range i,e standard deviation is < 1, COV (%) is < 2 and lower value of
standard error.
Table 04: Result of Precision Study.
Concentration (µg/ml)
Intraday Study Interday Study
Mean±SD COV (%) S.E Mean±SD COV (%) S.E
10 10.084±0.124 0.542 0.079 9.857±0.324 1.012 0.379 20 20.175±0.524 0.685 0.125 19.775±0.512 1.201 0.412 30 30.547±0.412 0.287 0.231 29.995±0.811 0.975 0.564 40 40.087±0.025 0.478 0.147 39.781±0.625 1.478 0.847 50 50.023±0.235 0.312 0.301 49.744±0.435 1.302 0.901 SD- Standard Deviation, COV- Coefficient of Variance, S.E- Standard Error
LOD & LOQ
Selectivity of the developed method was confirmed by calculating LOD and LOQ, the values
were 0.32µg/ml and 0.91µg/ml respectively.
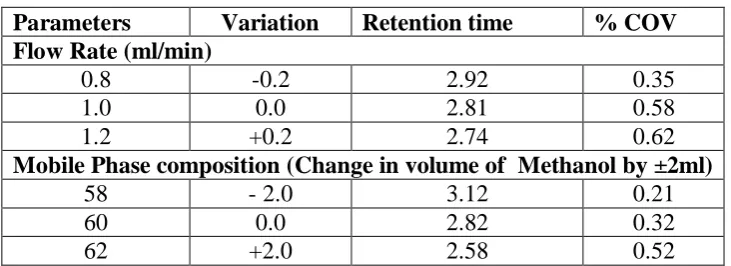
Specificity and Robustness
Study for specificity and robustness of the develop method were performed. As there is no
significant difference found in retention time of cinacalcet after modifying flow rate of
mobile phase as well as composition confirms that this method is suitable and robust for
[image:8.595.116.482.597.730.2]quantitative estimation of cinacalcet in tablet formulation. The result was reported in
Table.05.
Table 05: Result of Robustness Study.
Parameters Variation Retention time % COV
Flow Rate (ml/min)
0.8 -0.2 2.92 0.35 1.0 0.0 2.81 0.58 1.2 +0.2 2.74 0.62
Mobile Phase composition (Change in volume of Methanol by ±2ml)
Assay of Tablet Formulation
Quantitative estimation of cinacalcet was performed in it’s tablet dosage form (Ceracal,
30mg) by using this developed method. Replicates of tablet solution having concentration 30 µg/ml were prepared from it’s stock solution and injected into the system and concentration
of drug content was calculated by extrapolating peak area from the calibration curve. The %
of drug content was found to be 100.45 in market formulation and the statistical data revels
that the developed method was suitable for quantitative estimation of cinacalcet. The result
was given in Table.06.
Tablet 06: Result for Assay of Cerecal.
Drug Label Claim
(mg)
Amount Present (mg)
% of drug
content S.D
%
COV S.E
Cinacalcet.
HCl 30 30.135 100.45 0.554 0.447 0.654 SD- Standard Deviation, COV- Coefficient of Variance, S.E- Standard Error
CONCLUSION
In the present work a new RP-HPLC method has been developed for quantitative analysis of
cinacalcet in tablet formulation. Validation study result of this developed method revels that
the developed method is accurate, precise, linear, repeatable, specific, selective and reliable.
The relatively short run time enables rapid quantitation of many samples during analysis. The
same solvent was used throughout the experimental work and no interference of any
excipients was found. The developed method is economical and therefore can be used as a
quality control tool for estimation of cinacalcet in bulk as well as in formulation.
ACKNOWLEDGEMENT
The authors are grateful to Cheminsol Pharma Solutions Pvt. Ltd, Panvel, Mumbai, India for
providing gift sample of Cinacalcet. HCl.
REFERENCES
1. Krishna M, Karunanidhi SL, Sola G, Akshitha Y. Stability indicating HPLC method for
the estimation of Cinacalcet. HCl API. Indian J Res Pharma Biotechnology, 2013; 1(3):
346-50.
2. Lindberg J S, Culleton B, Wong G, Borah M F, Clark RV. Cinacalcet HCl, an Oral
Hemodialysis and Peritoneal Dialysis: A Randomized, Double- Blind, Multicenter Study.
J Am Soc Nephrol, 2005; 16: 800–807.
3. Loni AB, Ghante MR, Sawant SD. Spectrophotometric estimation of cinacalcet
hydrochloride in Bulk and tablet dosage form. Int J Pharm Pharma Sci, 2012; 4(3):
513-515.
4. Manjula A, Deepthi GC, Vijayaraj S. Spectrophotometric determination of cinacalcet
hydrochloride in Bulk. Int J Pharm Review Res, 2012; 2(2): 111-118.
5. Padhi D, Harris R. Clinical pharmacokinetic and pharmacodynamic profile of cinacalcet
hydrochloride. Clinical Pharmacokinetics, 2009; 48(5): 303-11.
6. Rao RN, Saida S, Naidu CG, Sravan B, Ramesh B. Liquid chromatographic separation,
determination and ESI-MS/MS, FTIR and NMR characterization of the forced
degradation products of cinacalcet. Analytical Methods, 2014; 6(14): 5076-5087.
7. Reddy PS, Raju TVR, Raju PS, Varma NS, Babu KS. Development and validation of
stability indicating RP-UPLC method for the estimation of impurities in Cinacalcet. Hydrochloride API and it’s formulation. Sci Pharma, 2015; 83(4): 583-598.
8. Tekula R, Prakash KV, Susana S, Tejaswini R. Validated RP-HPLC method for the
estimation of Cinacalcet in Bulk and Tablet dosage Form. American J Pharmtech Res,
2013; 3(3): 409-414.
9. Yousaf F, Charytan C. Review of cinacalcet hydrochloride in the management of
secondary hyperparathyroidism. Ren Fail, 2014; 36(1): 131-138.
10.ICH, Validation of analytical procedures: text and methodology Q2 (R1), in: proceedings