Abstract — The results of modelling fluid dynamics, heat/mass transfer and combustion processes in Diesel engine-like conditions are presented with the emphasis on the effects of droplet break-up, heating and evaporation on the predicted spray penetration, in-cylinder gas pressure and the amount of fuel vapour, O2, CO2, CO and NO. The following models have been studied: the Infinite Thermal Conductivity (ITC) and Effective Thermal Conductivity (ETC) liquid phase models, the basic gas phase model, the gas phase model suggested by Abramzon and Sirignano (1989), and three droplet break-up models - the model suggested by Reitz and Diwakar (1987), the KH-RT conventional WAVE model, and the TAB model. It is pointed out that the ETC model leads to the prediction of shorter spray penetration, in agreement with experimental data, when compared with the ITC model. The effect of the liquid phase model on predicted gas pressure in Diesel engines is shown to be relatively weak. The predicted amounts of fuel vapour, O2, CO2, CO and NO, are strongly affected by the choice of the liquid phase model but practically unaffected by the choice of the gas phase model. The predicted amounts of all these substances are strongly affected by the choice of the droplet break-up models. All these observations are related to the effect of droplet vaporization rate, controlled by the droplet surface temperature (mainly via the choice of the liquid phase model), and to droplet size distributions, mainly controlled by droplet break-up models.
I. INTRODUCTION
ODELLING of the processes in Diesel engines needs to take into account a number of complex processes, including droplet break-up, heating and evaporation and the ignition of the fuel vapour/air mixture in a realistic three dimensional geometry [1-3].
This naturally leads to the application of rather simplistic models of individual processes, including the assumption that there are no temperature gradients in individual droplets (their thermal conductivity is infinitely large) [4].
Manuscript received February 02, 2011; revised February 17, 201.
Walid A Abdelghaffar is with Mechanical Engineering Department, Faculty of Engineering, Alexandria University, Alexandria 21544, Egypt (002-0104667022 fax: 002 03 5501188; e-mail: wabdelghaffar@ hotmail.com).
Ahmed E Elwardany was with Alexandria University, Egypt, Alexandria 21544 Egypt. He is now with Sir Harry Ricardo Laboratories, School of Computing, Engineering and Mathematics, Faculty of Science and Engineering, University of Brighton, Brighton BN2 4GJ UK (e-mail:
Sergei S Sazhin is with Sir Harry Ricardo Laboratories, School of Computing, Engineering and Mathematics, Faculty of Science and Engineering, University of Brighton, Brighton BN2 4GJ UK (e-mail:
The authors of [5] were perhaps the first to draw attention to the fact that the assumption of infinite thermal conductivity of droplets reduces considerably the accuracy of prediction of the processes in Diesel engines. However, the model taking into account the finite thermal conductivity of droplets, suggested in [5], has not been widely accepted by the engineering community. This model was based on the numerical solution to the heat conduction equation, which was rather CPU intensive and not practical for implementation into CFD codes.
In a number of papers, an alternative approach to taking into account the effects of the finite thermal conductivity of liquid fuel and recirculation inside droplets was developed [6-9]. This approach was based on the analytical solution to the heat conduction equation inside droplets and incorporation of this solution into CFD codes (KIVA 2 was used for testing this approach). This model was based on the replacement of the actual thermal conductivity of droplets by their effective thermal conductivity, depending on Reynolds and Prandtl numbers. It could not predict accurately the details of temperature distribution inside droplets, but its prediction of the average droplet surface temperature turned out to be relatively accurate. The ETC model was validated by direct comparison between the predictions of this model and the rigorous model, taking into account the effects of vortices inside droplets [10-11]. Also, it was validated against experimental data obtained at the University of Nancy [12].
Further research in this direction was reported in [13], where the effects of various combinations of liquid and gas phase models on droplet heating and evaporation were investigated. It was concluded that the correct choice of the gas phase model is important for accurate prediction the droplet evaporation time, while the correct choice of the liquid phase models is important for accurate prediction of the auto-ignition timing. In a more recent paper [14], the combined effects of liquid and gas phase models and droplet break-up models on Diesel spray characteristics were studied.
The effects of modelling droplet heating and evaporation on the main characteristics of Diesel engines were studied in [15]. In this paper the most important effects reported in that paper are summarized. Also, some new effects with regard to the influence of the choice of droplet break-up models on the main characteristics of Diesel engines are presented.
II.MODELS
Heating andevaporation models
Two liquid heating models are considered. The first model is the infinite thermal conductivity (ITC) model in which the liquid thermal conductivity is assumed to be infinitely large and there is no temperature gradient inside droplets [16].
Effects of Fuel Droplet Break-up, Heating and
Evaporation in Diesel Engines
W A Abdelghaffar, A E Elwardany, S S Sazhin
The second model is the effective thermal conductivity (ETC) model, taking into account the effects of finite thermal conductivity inside droplets and recirculation within them by replacing the liquid thermal conductivity with the effective thermal conductivity , where the factor is approximated by the following expression [9,16]:
1.86 0.86tanh 2.225log Pe ⁄30 , (1)
Pel=Red(l)Prd(l)is the Peclet number,
Re and Pr are the Reynolds and
Prandtl numbers respectively, based on transport coefficients in the liquid phase, , , and are average liquid density, dynamic viscosity, specific heat capacity and thermal conductivity, respectively. In the ETC model, the distribution of temperature inside droplets was calculated at each time step using the analytical solution to the heat conduction equation [16].
The rate of droplet evaporation is described by the following equation:
)
1
ln(
2
. M o d f ld
D
R
Sh
B
m
, (2)where
m
d.
is the rate of change of droplet mass, Df is the
mass diffusion coefficient for fuel vapour, BM is the
Spalding mass transfer number, Sho 2hmRd/Dfis the Sherwood number of non-evaporating droplets, hm is the mass transfer coefficient.
Two gas phase models are considered in our analysis. In the first one, called M0 in [13], the following correlations for and were used [13]:
) Re 3 . 0 1 (
2 1/2 1/3
0 d Scd
Sh , (3)
) Pr Re 3 . 0 1 ( ) 1 ln(
2 1d/2 d1/3
M M
B B
Nu , (4)
where Re and Pr are the Reynolds
and Prandtl numbers respectively, based on transport coefficients in the gas phase, is the Schmidt number, , and are gas average density, viscosity and specific heat capacity at constant pressure, respectively.
In the second model, called M4 in [13], these correlations were given the form [9]:
) ( 2 1 Re , 1 max ) Re 1 ( 1 2 077 . 0 3 / 1 0 M d d d B F ScSh , (5)
) ( 2 1 Re , 1 max ) Pr Re 1 ( 1 ) 1 ln( 2 Nu 077 . 0 3 / 1 T d d d T T B F BB , (6)
where 1 . ,
1 . , B
T is the Spalding heat transfer number
[16].
The first model is the simplest, while the second, suggested in [9], is the most physically consistent and accurate [13, 16, 17]. The predictions of other models
suggested in the literature lie approximately between the predictions of these two models [13]. The effects of thermal radiation are ignored.
Combustion model
Approximating Diesel fuel by n-dodecane (C12H26), its
main kinetic oxidation reaction in air (Reaction 1) can be presented as [15]:
2C12H26 + 37 (O2 + 3.76 N2)
24 CO2 + 26 H2O + 139.12 N2 (7)
At high temperatures, typical for Diesel engine conditions, N2 is oxidised to produce NO, following the
scheme:
2N2 + O2
2NO + N2 (8)N2 + 2O2
2NO + O2 (9)N2 + 2OH
2NO + H2 (10)These reactions will be referred to as Reactions 2-4 respectively. In all these cases, the reactions proceed at a rate given by the following general expression:
mr mr b m m m br a m m m fr
r k W k W
(
/ ) (
/ )
(11)where ′ and ′ are reaction orders [15], and are the density and molecular weight of species m, kfr and kbr are
forward and backward reaction coefficients approximated as:
) /
exp( E T
T A
kfr fr fr
fr
and
) /
exp( E T
T A
kbr br br br
,
where A and are constants. E and T are the activation energy and the cell temperature. in this equation is in moles/(s cm3), is in g/cm3, and is in g/mole, is in cm3(amr1)
mole1amr s 1
, is in cm3(b'mr1) mole
mr b' 1
s 1
.
The chemical source term in Reactions 1-4 is calculated as:
r r mr mr mm W b a
( ) (12)
The following six equilibrium reactions have been taken into account due to their importance in hydrocarbon oxidation:
H2 2H
O2 2O
N2 2N (13)
H2 + O2 2OH
O2 + 2H2O 4OH
2CO + O2 2CO2
) ( )
/
( W K T
m
r c a b m
m mr mr
, (14)where is approximated as:
) /
ln
exp( r A r A r r A r A2
r
c A T B T C DT ET
K , (15)
TA = T/1000 K, Ar, Br, Cr, Dr and Er are constants [15].
Break-up models
Three break-up models have been implemented into the KIVA-3V code. These are the model suggested by Reitz and Diwakar [18] (RD model), the WAVE model in the format suggested in [19] and the TAB model [20] which is the default model in the KIVA-3V code.
Most CFD codes, including the conventional KIVA-3V code, ignored the effect of finite break-up length, assuming that the break-up process starts at the nozzle exit [21, 22]. In our study we took into account this effect and used the following empirical correlation for this length [21, 22]:
g l o d
b D
C C L
. 2
2 /
2
(16)
where C is the empirical constant, Cd is the coefficient of
discharge, Do the orifice diameter. This approach to
calculation of the break-up length is complementary to the one suggested in [14], as part of the modified WAVE model.
III. RESULTS
Computational set-up
The cylindrical computational domain had diameter 50 mm and height 80 mm with 20 radial, 72 azimuthal and 32 axial computational cells. The mesh spacing was non-uniform, with fine resolution at the centre line (the smallest cell was 1 mm wide by 2.5 mm long). Numerical experiments with finer meshes confirmed that the results are grid independent [22]. Up to 5000 droplet parcels were used in calculations. These parcels were injected from a 0.2 mm diameter 3-hole VCO nozzle at 50 mm3 fuelling. The nozzle was fixed on the side wall at 55 mm above the bottom surface of the cylinder. At the start of each computation, the domain was filled with quiescent air at a required pressure and temperature.
Effects of liquid and gas phase models on predicted spray penetration
The numerical results, obtained using the customised version of the KIVA-3V code, were validated against experimental data obtained using the Proteus rapid compression machine with a specially designed head for optical access for spray visualisation [21, 22, 29]. A chamber cavity formed at the top of the combustion chamber with a compression ratio of only 9:1. Therefore, in order to achieve in-cylinder pressures and temperatures representative of a modern Diesel engine, the boost pressure and intake air temperature were increased, giving nominal TDC pressures of up to 12 MPa, and a TDC gas temperature of 785 K [29].
The experimental and modelling results for the penetration length were compared for a 3-hole nozzle and hot air intake at 721 K at start of injection [21]. The injection pressure was set between 60 and 160 MPa whilst the in-cylinder pressure varied between 2 and 6 MPa. The results obtained for the case of cold intake (576 K at start of injection) were validated earlier (see [22]) using the original version of the KIVA-3V code.
Some numerical and experimental results for spray penetration for 100 MPa injection pressure and 2 and 6 MPa in-cylinder pressures (ICP) were compared in our previous paper [15]. It was shown that the ETC-M4 models predict lower penetration length than the ITC-M0 models and the predictions of the former are in better agreement with the experimental results. This can be attributed to the fact that the ETC model predicted higher initial droplet surface temperatures and this leads to an increase in evaporation rate and has a strong effect on the surface tension (cf. [14]). The surface tension decreases with the increase in surface temperature. This leads to a decrease in droplet diameter due to enhanced break-up. As a result, the ETC model predicts lower penetration length. The same behaviour was also observed for injection pressures of 60, 140 and 160 MPa [15].
The effect of break-up models on predicted combustion performance and exhaust emission
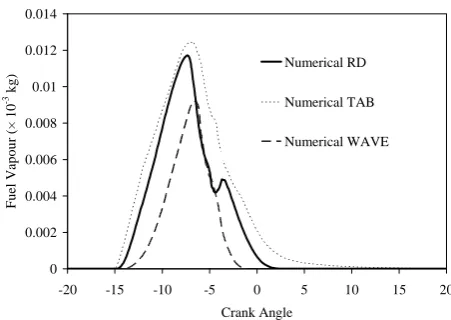
[image:3.595.324.550.513.673.2]Fig. 1 shows the amount of fuel vapour predicted by the KIVA-3V code, using the ITC liquid phase model and M0 gas phase model with the TAB, WAVE and Reitz and Diwakar (RD) [18] break-up models. As follows from this figure, the WAVE model predicts the smallest amount of fuel vapour. This can be related to the fact that it predicts the slowest break-up process. The initial rates of fuel production predicted by the TAB and WAVE models show the same trends as in the case discussed in [15].
Fig. 1. The amount of fuel vapour versus crank angle predicted by the customised version of the KIVA-3V code using RD, TAB and WAVE break-up models for two ranges of crank angles: from 20 BTDC to 20 ATDC.
0 0.002 0.004 0.006 0.008 0.01 0.012 0.014
-20 -15 -10 -5 0 5 10 15 20
Crank Angle
Fuel
V
apour (× 10
-3 kg)
Numerical RD
Numerical TAB
Fig. 2. The same as Fig. 1 but for the amount of O2.
Fig. 3. The same as Fig. 1 but for the amount of CO2.
Figs. 2 to 5 show the predicted amounts of O2, CO2, CO
and NO versus crank angles based on the RD, TAB and WAVE break-up models. The predicted amounts of O2,
CO2, CO and NO, using the TAB and the RD models appear
to be close, while the WAVE model led to prediction of slightly higher amounts of O2 than the other models. This
can be attributed to the fact that the WAVE model predicts a slower break-up process which leads to the prediction of less fuel vapour compared with other break-up models. This leads to reduced consumption of O2 (Fig. 2) and production
of less CO2 (11.1% less than predicted by the RD model)
(Fig. 3), CO and NO (an order of magnitude less than predicted by the RD model: see Figs. 4 and 5).
[image:4.595.321.551.266.422.2]Fig. 4. The same as Fig. 1 but for the amount of CO.
Fig. 5. The same as Fig. 1 but for the amount of NO.
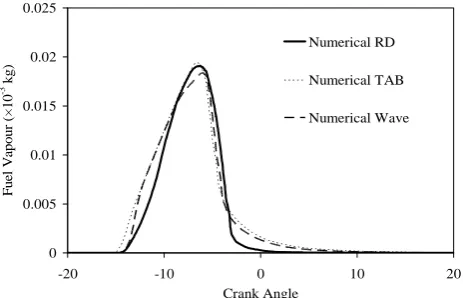
Figs. 6 and 7 show the amount of fuel vapour predicted by KIVA-3V, using ETC/M0 and ETC/M4 models respectively. The fuel vapour was calculated for each curve using the RD, TAB and WAVE break-up models. It can be seen that there is no significant difference between the fuel vapour volumes calculated using any of the break-up and gas phase (M0 and M4) models: the TAB model appears to predict slightly higher amounts of fuel vapour than those predicted by the RD and WAVE models. The amount of O2,
CO2, CO and NO predicted by the RD, TAB and WAVE
break-up models, and using the ETC/M0 and ETC/M4 models are rather similar for the cases under consideration. Comparing Figs. 6 and 7 with the results obtained in [15], one can see that the effect of the liquid phase models on the rate of fuel production is much greater than the effect of the gas phase model. This can be related to the fact that, in contrast to the liquid phase models, the gas phase models do not affect the predicted droplet surface temperature significantly (see [13] for details).
1.07 1.08 1.09 1.1 1.11 1.12 1.13 1.14
-20 -15 -10 -5 0 5 10 15 20
Crank Angle O2
(×
1
0
-3 kg
)
Numerical RD
Numerical TAB
Numerical WAVE
0 0.02 0.04 0.06 0.08 0.1 0.12
-20 -15 -10 -5 0 5 10 15 20
Crank Angle
CO
2
(×
1
0
-3 kg
)
Numerical RD
Numerical TAB
Numerical WAVE
0.E+00 2.E-04 4.E-04 6.E-04 8.E-04 1.E-03
-20 -15 -10 -5 0 5 10 15 20
Crank Angle
CO
(
×
10
-3 kg)
Numerical RD
Numerical TAB
Numerical WAVE
0.E+00 5.E-05 1.E-04 2.E-04 2.E-04 3.E-04 3.E-04 4.E-04
-20 -15 -10 -5 0 5 10 15 20
Crank Angle
NO (×
1
0
-3 kg)
Numerical RD
Numerical TAB
[image:4.595.64.289.272.461.2]Fig. 6. The amount of fuel vapour versus crank angle calculated using the customised version of the KIVA-3V code with ETC liquid phase model and M0 gas phase model and RD, TAB and WAVE break-up models for the same conditions as in Fig. 1.
Fig. 7. The same as Fig. 6 but for the M4 gas phase model.
Effects of liquid and gas phase models on predicted combustion performance and exhaust emissions
The results in [15] showed that the rate of formation of CO2 predicted using the ETC model is higher than that
predicted by the ITC model. This increase reaches 16.1% at 4 CA BTDC. The predicted amounts of CO and NO were shown to be very sensitive to the choice of the liquid phase model but almost independent of the choice of gas phase model.
As follows from the above analysis, taking into account temperature gradient inside droplets has a significant effect on the prediction of the fuel vapour, oxidizer and combustion products. This can be related to higher droplet surface temperatures predicted by the ETC model leading to higher evaporation rates. On the other hand, this increase in temperature leads to a higher reaction rate and eventually to the reduction of the amount of fuel vapour. The increased initial rate of fuel vapour production, shown in [15], is similar to the one reported in [5].
Fig. 8 shows the computed in-cylinder pressures using the ETC and M4 models. Experimental data, obtained in [21], were used to validate the numerical results. It is noticeable that a slightly higher in-cylinder pressure is predicted by the code using the ETC model. This can be related to a larger concentration of fuel vapour and higher surface temperature predicted by the ETC model. The
[image:5.595.64.299.275.444.2]results obtained using the ETC model fit the experimental results marginally better than those obtained using the ITC model (not shown). Note that there is a noticeable difference between the results shown in Fig. 8 and reported in [5] (see their Fig. 12), where a much more pronounced effect of finite thermal conductivity on the in-cylinder pressure was reported. This can be related to the fact that in [5] the effects of internal recirculation inside droplets were not taken into account. These effects can increase the effective thermal conductivity, compared with the liquid thermal conductivity, by up to 2.72 times [9]. Hence the predictions of the ETC model are expected to be closer to the predictions of the ITC, compared with the finite thermal conductivity model, not taking into account the effects of internal recirculation inside droplets. The choice of gas phase model has a negligible effect on the time evolution of the in-cylinder pressure.
Fig. 8. The in-cylinder pressure versus crank angle obtained experimentally (see [21]) and numerically, using the customized version of the KIVA-3V code.
IV. CONCLUSION
The effects of liquid and gas heating and evaporation models on the characteristics of Diesel engines, reported in [15] have been summarized. The new effects of droplet break-up models on the characteristics of Diesel engines have been presented and discussed. The study focuses on the Infinite Thermal Conductivity (ITC) and Effective Thermal Conductivity (ETC) liquid phase models, basic gas phase model and the gas phase model suggested by Abramzon and Sirignano (1989), and three droplet break-up models: the model suggested by Reitz and Diwakar [18] (RD model), and the KH-RT conventional WAVE and TAB models. The effect of finite break-up length has been taken into account. It has been pointed out that the ETC model leads to the prediction of shorter spray penetration, in agreement with experimental data, when compared with the ITC model. The effect of the gas phase model on spray penetration turned out to be much weaker compared with the liquid phase model. The effect of the liquid phase model on predicted gas pressure in Diesel engines has been shown to be weaker compared with the case considered by Bertoli and Migliaccio [5], who did not take into account the effects of recirculation inside droplets in their analysis. The predicted amounts of fuel vapour, carbon dioxide, carbon monoxide and NO in the engine are shown to be strongly affected by the choice of the liquid phase model but practically 0
0.005 0.01 0.015 0.02 0.025
-20 -10 0 10 20
Crank Angle
F
uel
V
ap
our
(
×
10
-3 kg
)
Numerical RD
Numerical TAB
Numerical Wave
0 0.005 0.01 0.015 0.02 0.025
-20 -10 0 10 20
Crank Angle
Fue
l Va
po
ur
(× 10
-3 kg)
Numerical RD
Numerical TAB
Numerical Wave
0 10 20 30 40 50 60 70
-100 -75 -50 -25 0 25 50 75 100
Pressu
re (b
ar)
unaffected by the choice of the gas phase model. The predicted amount of all these substances is shown to be strongly affected by the choice of droplet break-up models. All these effects are ultimately related to the droplet vaporization rate which is controlled by the droplet surface temperature (via the choice of the liquid phase model) and to droplet sizes which are controlled by droplet break-up models.
REFERENCES
[1] J. B. Heywood, Internal Combustion Engines Fundamentals. McGraw-Hill Book Company, New York, 1988.
[2] R. D. Reitz, C. J. Rutland, Development and Testing of Diesel Engine CFD Models, Prog. Energy Combust. Sci., vol. 21, pp. 173-196, 1995.
[3] P. F. Flynn, R. P. Durrett, G. L. Hunter, A. O. zur Loye, O. C. Akinyemi, J. E. Dec, C. K. Westbrook, Diesel Combustion: An Integrated View Combining Laser Diagnostics, Chemical Kinetics, and Empirical Validation, SAE report No.1999-01-0509, 1999. [4] E. M. Sazhina, S. S. Sazhin, M. R. Heikal, V. I. Babushok, R. Johns,
A Detailed Modelling of the Spray Ignition Process in Diesel Engines, Comb. Sci. Tech., vol. 160, pp. 317-344, 2000.
[5] C. Bertoli and M. Migliaccio, A Finite Conductivity Model for Diesel Spray Evaporation Computations, Int. J. Heat Fluid Flow, vol. 20, pp. 552–561, 1999.
[6] S. S. Sazhin, P. A. Krutitskii, W. A. Abdelghaffar, S. V. Mikhalovsky, S. T. Meikle, M. R. Heikal, Transient Heating of Diesel Fuel Droplets, Int. J. Heat Mass Transfer, vol. 47, pp. 3327–3340, 2004.
[7] S. S. Sazhin, W. A. Abdelghaffar, E. M. Sazhina, M. R. Heikal, Models for Droplet Transient heating: Effects on Droplet Evaporation, Ignition, and Break-up, Int. J. Thermal Science, vol. 44, pp. 610–622, 2005.
[8] S. S. Sazhin, W. A. Abdelghaffar, P. A. Krutitskii, E. M. Sazhina, M. R. Heikal, New Approaches to Numerical Modelling of Droplet Transient Heating and Evaporation, Int. J. Heat Mass Transfer, vol. 48, pp. 4215–4228, 2005.
[9] B. Abramzon and W. A. Sirignano, Droplet Vaporization Model for Spray Combustion Calculations, Int. J. Heat Mass Transfer, vol. 32, pp. 1605–1618, 1989.
[10] B. Abramzon, S. S. Sazhin, Droplet Vaporization Model in the Presence of Thermal Radiation, Int. J. Heat Mass Transfer, vol. 48, pp. 1868-1873, 2005.
[11] B. Abramzon and S. S. Sazhin, Convective Vaporization of Fuel Droplets with Thermal Radiation Absorption, Fuel, vol. 85, pp. 32– 46, 2006.
[12] C. Maqua, G. Castanet, F. Grisch, F. Lemoine, T. Kristyadi, and S. S. Sazhin, Monodisperse Droplet Heating and Evaporation: Experimental Study and Modeling, Int. J. Heat Mass Transfer, vol. 51, pp. 3932–3945, 2008.
[13] S. S. Sazhin, T. Kristyadi, W. A. Abdelghaffar, and M. R. Heikal, Models for Fuel Droplet Heating and Evaporation: Comparative Analysis, Fuel, vol. 85, pp. 1613–1630, 2006.
[14] S. S. Sazhin, S. B. Martynov, T. Kristyadi, C. Crua, and M. R. Heikal, Diesel Fuel Spray Penetration, Heating, Evaporation and Ignition: Modeling Versus Experimentation, Int. J. Eng. Syst. Modell. Simul., vol. 1, no. 1, pp. 1–19, 2008.
[15] W. A. Abdelghaffar, A. E. Elwardany, S. S. Sazhin, Modelling of the processes in Diesel engine-like conditions: effects of fuel droplet break-up, heating and evaporation, Atomization and Spray, vol. 20(8), pp. 737-747, 2010.
[16] S. S. Sazhin, Advanced Models of Fuel Droplet Heating and Evaporation, Progress in Energy and Combustion Science, vol. 32, pp. 162–214, 2006.
[17] S. Sazhin, Modelling of Sprays Using Computational Fluid Dynamics Codes, Pollack Periodica, vol. 4(1), pp. 5-16, 2009.
[18] R. D. Reitz, R. Diwakar, Structure of High-Pressure Fuel Sprays, SAE Report No. 870598, 1987.
[19] M. A. Patterson, R. D. Reitz, Modelling the Effects of Fuel Spray Characteristics on Diesel Engine Combustion and Emission, SAE Report No. 980131, 1998.
[20] P. J. O’Rourke, A. A. Amsden, The TAB Method for Numerical Calculation of Spray Break-up, SAE Report No. 872089, 1987. [21] K. Karimi, E. M. Sazhina, W. A. Abdelghaffar, C. Crua, T. Cowell,
M. R. Heikal, M. R. Gold, Developments in Diesel Spray
Characterisation and Modelling, THIESEL Conference on Thermo- and Fluid Dynamic Processes in Diesel engines, Spain, 2006, Session A.1 (CD), 2006.
[22] W. A. Abdelghaffar, K. Karimi, M. R. Heikal, Fuel Spray Penetration in High Pressure Diesel Engines, SAE Report No. 07SFL-15, 2006. [23] A. A. Amsden., P. J. O’Rourke, T. D. Butler, KIVA II: A Computer
Program for Chemically Reactive Flows with Sprays, SAE Report No. 872072, 1987.
[24] A. A. Amsden, KIVA-3: A KIVA Program with Block-Structured Mesh for Complex Geometries, Los Alamos Nat. Laboratory, New Mexico, 1993.
[25] A. A. Amsden, KIVA-3V: A Block-Structured KIVA Program for Engines with Vertical or Canted Valves, Los Alamos Nat. Laboratory, New Mexico, 1997.
[26] A. A. Amsden, KIVA-3V, RELEASE 2: Improvement to KIVA-3V, Los Alamos Nat. Laboratory, New Mexico, 1999.
[27] P. J. O’Rourke, Collective Drop Effects in Vaporizing Liquid Sprays, Ph.D. Thesis, Princeton University, 1532, 1981.
[28] P. J. O’Rourke, Statistical Properties and Numerical Implementation of a Model for Droplet Dispersion in a Turbulent Gas, J. Comput. Phys. vol. 83, 345–360, 1989.
[29] D. A. Kennaird, C. Crua, M. R. Heikal, M. R. Gold, N. S. Jackson, In-Cylinder Penetration and Break-up of Diesel Sprays Using a Common-Rail Injection System, SAE Report No. 01-1626, 2002. [30] D. B. Spalding, The Combustion of Liquid Fuels. Int. 4th Symposium