Abstract— The aim of this study is to present electrooculogram signals that can be used as a human computer interface efficiently. Establishing an efficient alternative channel for communication without overt speech and hand movements is important for increasing the quality of life for patients suffering from Amyotrophic Lateral Sclerosis or other illnesses that prevent correct limb and facial muscular responses.
In this paper, we introduce gaze estimation system of 24 Angles using cross-channels electrooculogram signals. This system records electrooculogram signals when the patients focused on each direct. All these recorded signals could be analyzed using the fuzzy mathematical model will be set up. From simulation results, the 24 pattern of eyeball movements is recognized under an accuracy of 87% in our system.
Index Terms— Cross-Channels, Electrooculogram Signal, Gaze estimation, Fuzzy mathematical model
I. INTRODUCTION
lectrooculography is a technique for measuring the corneo-retinal standing potential that exists between the front and the back of the human eye. And the resulting signal is called the electrooculogram (abbr. EOG). EOG can be modeled by a dipole [1], and these systems can be used in medical systems. There are several EOG-based Human-Computer Interface studies in literature. A wheelchair controlled with the eye movements is developed for the disabled and elderly people. The eyes movement signals and sensor signals are combined, and both direction and acceleration are controlled [2]. Because the EOG signals are slightly different for the each subject, a dynamical threshold algorithm is developed [3].
In order to classify the difference of each eye movements, an initial threshold is set due to the individual difference, and the initial threshold is distributed in a dynamic range.
Threshold value needs to be renewed for adjusting irregular changes. According to this threshold, the output signal is converting into the binary systems, and actual functionality could be realized by applications designed for each uses. The EOG, the Electroencephalogram (abbr. EEG) and the Electromyogram (abbr. EMG) signals are classified in real time, and movable robots are controlled by using an artificial neural network classifier [4], [5]. However, In-depth studies evoked that slow changing baseline drift is difficult to
Manuscript received January 8, 2014; revised February. 2, 2014.
M. Y. Author is with the Interdisciplinary Graduate School of Agriculture and Engineering, University of Miyazaki, Miyazaki, Japan (corresponding author to provide phone: +818039961661; e-mail:
H. T. Author is with Department of Electrical and Electronic Engineering, University of Miyazaki, Miyazaki, Japan.
K. Y. Author is with Department of Electrical and Electronic Engineering, University of Miyazaki, Miyazaki, Japan.
estimate in continuous EOG signals, and this drift is only appeared in direct current (abbr. DC) signals caused in the circuit. To overcome this issue, our system was proposed using alternating current (abbr. AC) of EOG to reduce baseline drift by segmentation of the signal [6-7].
In previous studies, the positions of the electrodes were always set as plus-channels same with direction of the eye movements. The horizontal channel was in charge of horizontal EOG signals and the vertical channel was in charge of vertical EOG signals. In this paper, we propose novel EOG system using cross-channel electrodes. This method is able to put the electrodes in place far from the eyeballs. In addition, this paper confirms that the cross-channel EOG signals have a similar performance to the conventional method. Using this system, EOG signals can be recorded when the patients focus on each direct. All these recorded 24 pattern signals could be analyzed by using fuzzy mathematics method. Gaze estimation can be recognized using EOG signals follow this method.
II. THE MEASUREMENT SYSTEM USING EOG SIGNALS AND ITS USE ON MOUSE CURSOR CONTROL SYSTEM A. Cross-Channels
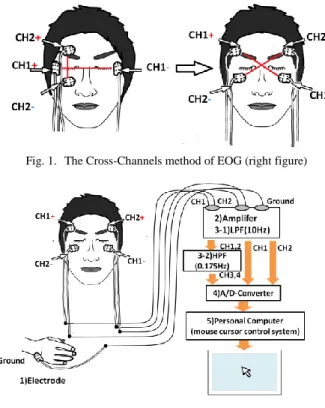
As shown in Fig.1 (left), previous researchers used plus-channels for recording the EOG signals, the horizontal signals were recorded by Channel 1, and the vertical signals were recorded by Channel 2 [6-7]. In this paper, in order to improve the accuracy of the EOG signals, a new cross-channels method was proposed as shown in Fig.1 (right).
The horizontal signals and the vertical signals could be recorded by both channels on the same time. It would be much easier to analysis the data using double signals.
B. The EOG Device
In this subsection, EOG measurement system design is proposed [6-7]. Fig.2 shows the formal scheme for the acquisition and analysis of the EOG signal for the control organization and flow of information through the system. Our proposal system is based on the five features, 1) Amplifier, 2) Low pass filter for channel 1 and 2, 3) High pass filter for channel 1 and 2, 4) A/D-convertor, and 5) mouse cursor control system. It consists of five electrodes, an A/D-convertor, a personal computer, and a monitor (shown Fig.2). In order to effectively filter functions, channel 3 (and channel 4) is used two amplifiers.
A Study on Gaze Estimation System using Cross-Channels Electrooculogram Signals
Mingmin Yan, Hiroki Tamura, and Koichi Tanno
E
Fig. 1. The Cross-Channels method of EOG (right figure)
Fig. 2. The measurement system of EOG
C. The EOG Signals Recording
After signal amplitude(1000 times) and considering noise reduction measures in designing of the biopotential data acquisition system, four kinds of eyes movements (Right, Left, Up, and Down) can be recognized accurately. Our EOG system performance is well and the electronic noise reduction is also successful. But because the eyes of person are in form of oval, the horizontal EOG signals are strong than the vertical EOG signals. The Fig.3, Fig.4 and Fig.5 and Fig.6 showed that 4 eyes movements are clearly different (right, left, up and down). Moreover, channel 1(CH1) and 2(CH2) have the DC level signals, so that the change of the EOG by the eyes movements can be recorded continuously and the continuous control for mouse cursor becomes possible.
Channel 3(CH3) and channel 4(CH4) are the AC level signals of the EOG. Therefore, CH3 and CH4 are strongly reacted while eyes moving only.
Fig. 3. The EOG signals recording samples in CH 1, 2,3 and 4 (Right)
Fig. 4. The EOG signals recording samples in CH 1, 2,3 and 4 (Left)
Fig. 5. The EOG signals recording samples in CH 1, 2,3 and 4 (Up)
Fig. 6. The EOG signals recording samples in CH 1, 2,3 and 4 (Down) Because the EOG signals changed in all 4 eyes movements, in order to understand the devison of these 4 eyes movements further, we imported 2 different methods, CH1+CH2 for the vertical signals and CH1-CH2 for the horizontal signals. We asked the experimenter to move his eyeballs follow the sequence as Center – Right – Center – Left – Center – Up –
Center – Down - Center, and the results of these two new method are shown in Fig.7. This Fig.7 shows that our system has the similar EOG signals of the conventional method.
Fig. 7. The EOG signals recording samples in CH1+CH2(Up side) and CH1-CH2(Down side).
III. OFFLINE EXPERIMENTS AND RESULTS
In order to record the EOG signals when the patients focused on each direct, we use the screen shown in Fig.8. The size of the monitor is 23 inches. The distance between the eyes of subject and the monitor is 50cm. the subjects of the experiments are three 20th healthy males (M.Y, K.G and K.M) who agreed to join in this experiment unforced.
A. Offline Experiments method
By using the screen shown in Fig. 8, we record the EOG signals when the patient focus its eyeballs right ahead. Then we ask the subject focus its eyeballs on the two crossing-points which were set on the left/right 30 degree position from right ahead, and record both DC and AC amplitude changes in CH1, CH2, CH3 and CH4. With the same method, we also record the amplitude changes when the patient focus its eyeballs on the left/right 30, 45, 60, 75 degree position for up (u), middle (m) and down (d) from right ahead.
All these data (24 angles) are considered as one group. We continue the experiments until recording ten groups’ data and re-initialize the system by 1 group. We have 6 groups of the teacher data and 4 groups of test data.
Fig. 8. The screen for EOG signals recording(24 angles)
B. The results of Experiments of M.Y
The average degree of each angle in the experiments is shown in Fig.9 and Fig.10. And the result of another subject of the experiments is shown in the next subsection.
Fig. 9. The results of the experiments (M.Y) (10 groups DC signals)
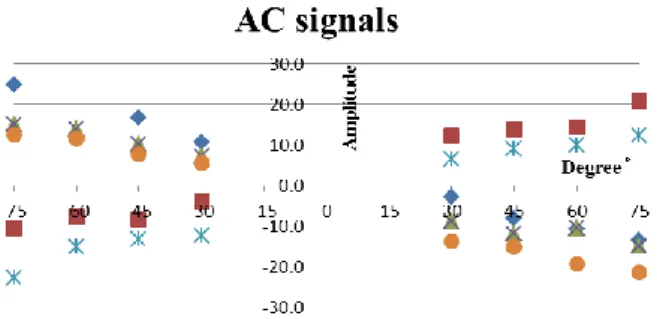
Fig. 10. The results of the experiments (M.Y) (10 groups AC signals)
IV. MATHEMATICAL MODELING OF THE RESULTS OF OFFLINE EXPERIMENTS
In order to get the rules for the gaze estimation judgment, we tried fuzzy mathematics methods, and the results of offline experiments were used as database.
A. Fuzzy mathematics analysis
All the DC and AC amplitude changes for each angle could be considered as fuzzy sets, in addition, we also used CH1+CH2 and CH1-CH2 as two fuzzy sets and its membership function is as below:
(1)
(i=1 to 24; j=CH1, CH2, CH3, CH4, CH1+CH2 and CH1-CH2)
is the average value and σ is standard deviation.
And the membership function for each angle is as below:
(2) If we choose the first six groups data as the teacher data, we
can get the teacher database using the average and the standard deviation.
Use (1) and (2) to compute the membership Aij. For example, the first data of group 7 is (CH1: -1.0423;
CH2:-10.0326; CH3: 1.4263; CH4: 18.9037).
A11=1-[(-1.0423+0.9902)/0.1088]2=0.7703 A12=1-[(-10.0326+10.7927)/1.5032]2=0.7443 A13= A14= A16=0
A15=1-[(0.3840-0.2750)/0.1545]2=0.5026 A1= A11 +A12 +A13 +A14 +A15 +A16=2.0172
We can also compute from A2 to A24 using the same method.
Follow the maximum membership principle, we can know the first data of group 7 belong to set 1, and the predicted degree is -75(up).
And the comparison between real degree and predicted degree of all three subjects are shown in Fig. 11, Fig.12 and Fig.13. The average correct rate of M.Y is 85.4%( 82/96), the average correct rate of K.G is 88.5%( 85/96), the average correct rate of K.M is 87.5%( 84/96) and the average correct rate of all three subjects is 87.1%.
Fig. 11. Correct and misjudge rate between real degree and predicted degree (M.Y)
Fig. 12. Correct and misjudge rate between real degree and predicted degree (K.G)
Fig. 13. Correct and misjudge rate between real degree and predicted degree (K.M)
In addition, we compared the fuzzy mathematical method using 6 inputs and 4 inputs (CH1, CH2, CH3 and CH4). From other simulation results, 6 inputs method was about 2% better than 4 inputs method.
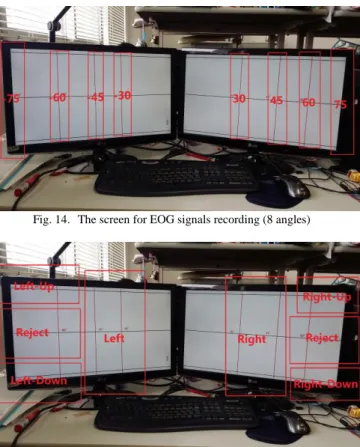
In one step further, we also built the Fuzzy models for 8 angles (left/right 30,45,60,75 degrees) as shown in Fig.14 and 6 angles (left, right, left-up, left-down, right-up and right-down) as shown in Fig.15. The correct rate of M.Y is 97.9% for 8 angles (94/96), 96.9 % for 6 angles (93/96), the correct rate of K.G is 99.0% for 8 angles (95/96), 97.9% for 6 angles (94/96), and the correct rate of K.M is 97.9% for 8 angles (94/96), 97.9% for 6 angles (94/96). The average correct rate of all three subjects is 98.3% for 8 angles, 97.5%
for 6 angles.
Fig. 14. The screen for EOG signals recording (8 angles)
Fig. 15. The screen for EOG signals recording (6 angles)
V. CONCLUSIONS AND DISCUSSIONS In this study, we introduced the EOG device which is used in the mouse cursor control system for amyotrophic lateral sclerosis patients successfully. In order to improve the precision accuracy of our system, we want to realize gaze estimation using EOG Signals. So we record both DC and AC amplitude changes of EOG signals when the people focus its eyeballs on 24 different positions from right ahead. With those data, we use mathematical modeling method, the fuzzy mathematics method. From the analysis results, we know that with numbers of database, the fuzzy mathematics method gets a good result. All the eyeballs movements can be recognized under an accuracy of 87.1%, and the patients also need move their eyeballs about 15 degree from one input button to the adjoining one in our system. So this accuracy is good enough for our system.
Further, we compared our proposed method and the adaptive neuro fuzzy inference system (abbr. ANFIS) [8]. The
ANFIS model had 92.7% accuracy of 24 patterns classification with the results of M.Y, but 71% accuracy with the results of K.G and K.M. The ANFIS is better than our proposed method in some cases and worse in some cases either. However, the ANFIS model is need a lot of parameter (224 parameters) and the parameter tuning algorithm. A new optimization algorithm must be created in order to improve the performance of ANFIS in all cases. In addition, we compared our proposed method, the original electrode position method and the ANFIS model in the horizontal angle of 8 patterns. Our proposed method is about 98.3%. The original electrode position method is about 100% [9]. In the horizontal angle of 8 patterns, two methods were almost same.
However, our proposed method has the merit of the electrodes position and the general-purpose properties.
In the future work, dynamic database are going to be imported into this system, so the accuracy will be improved into the higher level. And we also want to try this method in online experiments.
ACKNOWLEDGMENT
This research has been support by Miyazaki Prefectural Industrial Support Foundation (R&D) and Grant-Aid for Young Scientists(B)( 23700668) KAKEN.
REFERENCES
[1] S. Venkataramanan, P. Prabhat, S. R. Choudhury, H. B. Nemade, and J.
S. Sahambi, “Biomedical instrumentation based on Electrooculogram (EOG) signal processing and application to a hospital alarm system,”
in Proceedings of the 2nd IEEE International Conference on Intelligent Sensing and Information Processing (ICISIP ’05), Chennai, India, January 2005, pp. 535–540,.
[2] R. Barae, L. Boquete, and M.Mazo, “System for assitedmobility using eye movements based on electrooculography,” IEEE Transaction on Neural Systems and Rehabilitation Engineering, vol. 10, no. 4, 2002, pp. 209–218.
[3] Z. Lv, X. Wu, M. Li, and C. Zhang, “Implementation of the EOG-based human computer interface system,” in Proceedings of the 2nd International Conference on Bioinformatics and Biomedical Engineering (ICBBE ’08), Shanghai, China, May 2008, pp.
2188–2191.
[4] C. K. Young and M. Sasaki, “Mobile robot control by neural network EOG gesture recognition,” in Proceedings of the 8th International Conference on Neural Information Processing, vol.1, 2001, pp.
322–328.
[5] T. Manabe, H. Tamura, K. Tanno,“The Control Experiments of the Electric Wheelchair using s-EMG of Facial Muscles,”Proceedings of Forum on Information Technology 2009 (FIT2009) ,CD-ROM , 2009.
(Japanese), pp. K-008
[6] H. Tamura, M. Miyashita, K. Tanno, Y. Fuse “Mouse cursor control system using electrooculogram signals,” Proceedings of World Automation Congress 2010, IFMIP 239, CDROM, 2011, pp.1-6.
[7] H. Tamura, M. Yan, M. Miyashita, T. Manabe, K. Tanno, and Y. Fuse
“Development of Mouse Cursor Control System using DC and AC Elements of Electrooculogram Signals and its Applications,"
International Journal of Intelligent Computing in Medical Sciences &
Image Processing, Vol 5.No1, 2013, pp.3-15.
[8] H. Tamura,K. Tanno,H. Tanaka, C. Kuramitz, Z. Tang, “Recurrent Type ANFIS Using Local Search Technique for Time Series Prediction,” Proceedings CDROM, 2008 IEEE Asia Pacific Conference on Circuits and Systems , Nov 30 - Dec 3, 2009, Macao, China, pp. 380-383,
[9] M. Yan, H. Tamura, K. Tanno, “Gaze Estimation Using Electrooculogram Signals and Its Mathematical Modeling,”
Proceedings CDROM, IEEE 43rd International Symposium on
Multiple-Valued Logic 2013, May 21-24, 2013, Toyama, Japan, pp.18-22.