University of Warwick institutional repository: http://go.warwick.ac.uk/wrap This paper is made available online in accordance with
publisher policies. Please scroll down to view the document itself. Please refer to the repository record for this item and our policy information available from the repository home page for further information.
To see the final version of this paper please visit the publisher’s website. Access to the published version may require a subscription.
Author(s): B. Dutton, A.R. Clough and R.S. Edwards
Article Title: Near field enhancements from angled surface defects: a comparison of scanning laser source and scanning laser
detection techniques Year of publication: 2011
Near field enhancements from angled surface defects; a comparison of scanning laser
source and scanning laser detection techniques
B. Dutton, A.R. Clough and R.S. Edwards
Department of Physics, University of Warwick, Coventry, CV4 7AL, UK
Abstract. Enhancement of the Rayleigh wave signal amplitude at a surface defect, due to
interference of incident, reflected and mode converted waves, has been reported by several
authors, and it has been suggested that this could be used as a fingerprint of the presence of
such cracking. The scanning laser line source technique in particular, where signal amplitude
is enhanced as the laser generating the Rayleigh waves is in the region of a surface defect, has
been reported as a suitable detection tool. However, the previous work has looked primarily
at defects propagating normal to the surface, which may not always be a suitable
approximation, and the enhancement measured when a detection laser rather than a
generation laser is near a crack may, in some cases, be more significant. This work explores
near field effects for both laser generation and laser detection points near a defect, and
compares the enhancements for defects which are angled relative to the surface. We use a
combination of finite element method models and experimental results, and probe
enhancements of both the amplitude and frequency signals, and show that scanning the
detection point may be a better method for locating surface defects if they are inclined at an
angle to the surface.
1 Introduction
Surface crack detection and characterisation are very important in industry; cracks in
materials can lead to failure, and it is important to both detect and characterise cracking
before it grows deep into the material. Ultrasound is in common use, as testing can be
performed in a non-destructive manner, and recent advances in understanding the interaction
of surface waves, such as Rayleigh waves, with surface cracking is leading to new techniques
for characterisation [1-7]. Recent work has investigated the reflection and transmission of
waves following interaction with surface defects which are oriented normal to the sample
surface, a geometry which is typical of calibration samples [1,5-8]. It has been seen that a
surface defect will act like a filter to an incident wave, hence the transmitted signal for a
broadband Rayleigh wave, typical of that generated using non-contact techniques such as
electromagnetic acoustic transducers (EMATs) or laser ultrasound, drops off approximately
exponentially with depth [9, 10].
Enhancement of the ultrasonic signal in the near-field of a defect has been reported
[2,11,12], again only for defects oriented normal to the surface. For a detection point close to
a defect, interference between the incident Rayleigh wave with the reflected Rayleigh wave,
plus the mode-converted surface skimming longitudinal wave, leads to constructive
interference a short distance before the defect, and a significantly larger signal than the
incident wave amplitude away from the defect [2,11]. This has been modelled and
experimentally confirmed using EMATs [11].
When using laser generation of ultrasound, the shape of the source and the boundary
conditions play a large role in determining the amplitude and frequency content of a signal
[13]. If the laser generation point is over a defect, part of the beam is truncated and the
signal amplitude enhancement during scanning of a sample [2,5-7,12,14]. This enhancement
has been the subject of much recent research [2,5-7,12,14] and is known as the scanning laser
source (SLS) technique, or scanning laser line source (SLLS) if the generation laser is
focussed into a line. Frequency enhancements have also been reported before, with
researchers investigating changes in the frequency at which the fast Fourier transform (FFT)
shows a maximum magnitude [2]. This technique has been suggested as a useful method for
fingerprinting the position of a defect, and measurements of partially closed defects show a
non-linear frequency enhancement [12].
It is essential to understand fully how ultrasound interacts with surface cracks, in order to
gain an optimal characterisation of the crack geometry. The work highlighted above has used
primarily simulated defects, such as machined slots, which have been machined normal to the
sample surface. This will not necessarily be a suitable approximation for all defects, for
example rolling contact fatigue in rails which grows at an angle to the surface, or branched
defects such as stress corrosion cracking. It is therefore important to understand if there are
differences between the Rayleigh wave interaction with defects normal to the surface and
those at an angle to the surface normal. There has been limited work on this; Kinra et al.
performed initial investigations of the interaction of Rayleigh waves with angled defects [15].
Several researchers in diverse areas including geophysics have studied the interaction of a
Rayleigh wave incident on a wedge [16,17], but have not considered a finite depth defect. We
have recently studied the changes in reflection and transmission coefficients with angle for
several different defect depths, using a combination of models and experiments using laser
generation and detection of ultrasound [18-20]. These results show an angle dependence both
in the reflection and transmission of Rayleigh waves, and furthermore a variation with angle
Rayleigh wave at the crack [18,20], and these effects could be exploited for identifying the
angle of the defect.
During this research, interesting effects in the signal and frequency enhancement in the
near-field have been observed. This paper reports these effects, considering both amplitude
and frequency enhancement behaviour during scanning across cracks which have different
angles to the surface. We compare the effect of scanning the laser line source (SLLS) or the
detector (SLD, scanned laser detector) across the defect, and show that scanning the detector
may have significant advantages over a scanned generation point if defects are angled, rather
than normal to the surface. We also investigate frequency enhancements with angle, to
highlight further potential measurement techniques when using a scanning detection system
and the benefits over scanning the generation point.
2 Model and experimental details
This paper considers laser generation and detection of ultrasound. Laser generation will
typically generate a broadband Rayleigh wave, and can be used in either the thermoelastic
regime (causing no damage to the surface) or the ablative regime, where the surface of the
sample suffers some damage [21]. For detection, we consider laser detection using a
two-wave mixer interferometer system, which is sensitive to the out-of-plane (OP) component of
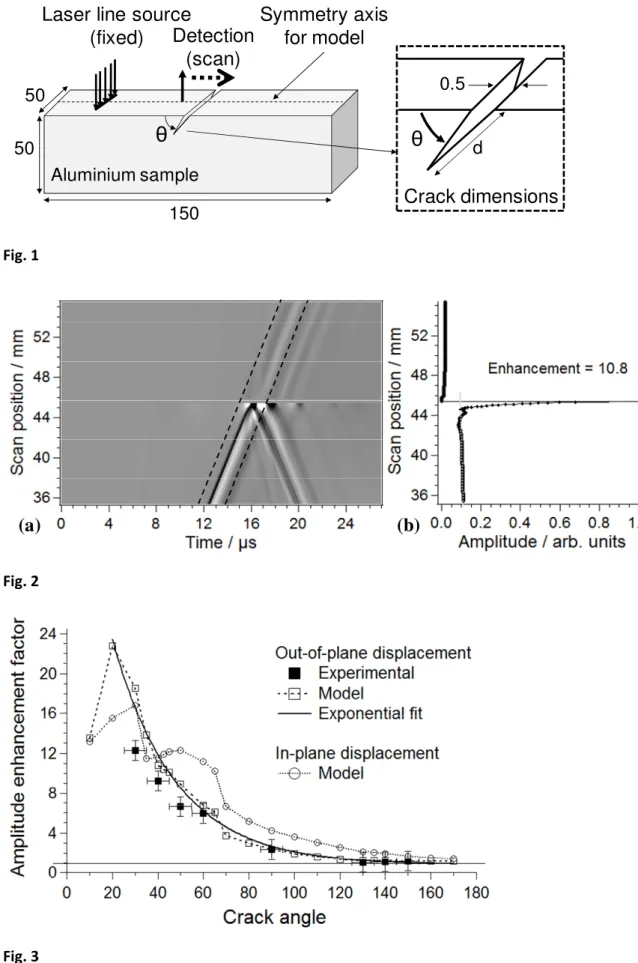
the Rayleigh wave. Both experiments and models are used, and Figure 1 shows the
measurement configuration and the sample geometry, including the surface defect.
To explore near field amplitude and frequency enhancement behaviours as crack angle
varies, two different 3D finite element method (FEM) models were generated with a software
package, PZFlex [22].
The SLD model was generated using loading forces derived from a laser pulse duration of 10
ns to give a good comparison with the experimental laser pulse used; these forces were
applied onto the sample in the form of dipoles [14,23]. The model configuration was set up as
shown in Figure 1, with results taken for different detection positions to simulate a scan.
Samples had defects with angles ranging from 10º to 170º and a normalised length of
d/λ=1.11, with other depths investigated and reported in the studies of transmission of the
Rayleigh wave [18-20]. The sample top surface and the crack faces of both models were
assigned to be ‘Free’. All other surfaces were assigned to be ‘Absorbing’ to simulate a larger
sample, saving computational memory and processing time. Symmetry was also applied to
improve model efficiency.
2.2 Scanning laser line source
For the SLLS technique, consideration must be made of the changes in boundary conditions
and source truncation near a defect, which leads to complications when using a dipole force
model. In this case, the heat-mechanical bridge mode in PZFlex was used, with the crack
walls free to expand [22]. For this model the laser line source spatial and temporal
temperature profile, based on the experimental line source [12,23], were used, with the heat
model creating a material expansion which in turn generated ultrasound waves in the
material. For SLLS the detection and generation positions shown in Figure 1 were
exchanged, therefore it is the generation line source that is scanned across the crack surface.
These models had defect angles, θ, ranging from 10º to 170º and a normalised length of
d/λ=1.11, with a limited number of models produced when compared to the SLD model due
to much longer processing times.
To validate the models, experimental scans were performed on aluminium samples with
dimensions 150x150x50mm using non-contact laser-ultrasound to both generate and detect,
and the near field enhancement behaviour was investigated. To generate the surface waves in
a thermoelastic manner a Nd:YAG laser with 10 ns rise time was used. The laser beam was
focused into a line with dimensions 6 mm by 500 µm, which generated ultrasound in a
direction perpendicular to the laser line; this method also has the effect of increasing the
frequency bandwidth of the generated surface waves [24,25]. Detection of the ultrasound
waves was performed using a two-wave mixer from IOS, which is capable of measuring the
out-of-plane surface displacement without the need for surface preparation such as polishing
[26]. Unpolished fabricated aluminium samples possessed crack angles, θ, from 30º to 150º,
with a normalised length of d/λ=1.11.
3 Results: amplitude enhancements
The signal enhancements reported previously and described above, observed as a scan is
performed across a crack, have been reported for cracks which are normal to the surface only
[2,11,12]. One paper [11] reports the detection point passing over a crack, whereas the SLS
technique with the laser source scanned over the crack has received much recent attention
[2,5-7,12,14]. The crack angle dependence of the enhancement has previously been ignored.
Here we report measurements of this behaviour as the crack angle varies, comparing both
SLD and SLLS techniques.
3.1 Amplitude enhancement for scanned laser detection
The first scanning technique presented is SLD. As the detection point passes close to the
defect, constructive interference between the incident and reflected Rayleigh waves and the
mode converted surface skimming longitudinal, lead to the enhancement for a 90° defect
changes in the amplitude of the windowed Rayleigh wave were monitored. A typical B-scan
from modelled results is shown in Figure 2(a) for a 40º crack (angle defined in Figure 1),
where the out-of-plane amplitude of the signals is shown by the grey-scale. The windowed
Rayleigh wave is shown by the dashed lines. Within this time window, the maximum
peak-to-peak amplitude was measured and is plotted in Figure 2(b). The defect was at a scan
position of 45.5 mm.
To calculate the enhancement of the signal, firstly the amplitudes before the crack were
considered. Attenuation of the Rayleigh wave as the separation between generation and
detection points is small over these distances; however, it was taken into account when
calculating the no-defect signal amplitude at the enhancement position. The enhancement
factor was then calculated as the ratio of the amplitude of the enhanced signal to that which
would have been measured without a defect. For this particular orientation of crack (40°) the
signal was enhanced by a factor of 10.8 above the signal amplitude when no defect is present.
This amplitude enhancement calculation was performed for each crack angle using the
model data, and is shown in Figure 3 for both out-of-plane (OP, open squares) and in-plane
(IP, open circles) displacements. In addition, the out-of-plane experimental data for several
crack angles between 30º and 150º are also displayed on the same figure as solid squares and
show a very good agreement with the model data. Experimental data is limited to
out-of-plane displacements only due to the interferometer technique used, however, the use of
EMATs allows measurement of the velocity components in both the out-of-plane and
in-plane, and will be the subject of a later publication. The reduced experimental enhancement
at some angles is mainly due to focussing issues, leading to a larger detection point size when
compared with the model [11]. Nevertheless, the out-of-plane enhancement for this depth of
on crack angle, shown as a solid line in Figure 3. The data point at 10º was not included in
this fit; at this angle the vertical depth of the defect is very small compared to the wavelength,
and the majority of the waves are able to penetrate beneath the defect [9,27].
The modelled and experimental enhancements for a 90° crack agree well with previously
published work [11], and each of the enhancements measured (out-of-plane and in-plane for
the model, out-of-plane for the experiments) exhibits an general trend of increasing
enhancement as the crack angle decreases, to a maximum at a certain angle. This
enhancement is known to be an excellent fingerprint of the defect, and clearly becomes more
so as the angle decreases.
The enhancement for angles other than 90° is again due to constructive interference of
Rayleigh and mode-converted waves close to the defect, with the reflected Rayleigh and
mode-converted surface skimming longitudinal wave dominating for angles around 90°
[1,11]. The exact mechanism for the enhancement at lower angles warrants further
investigation; we must consider the effect of the waves which have been mode-converted
from Rayleigh waves at the crack tip and have arrival times close to those of the incident
Rayleigh wave, and constructive interference between incident and reflected Rayleigh waves
and these mode-converted waves. It is clear from a comparison of the in-plane and
out-of-plane enhancements, and the difference in their behaviour, that these mode-converted waves
play an extremely important role [28].
3.2 Amplitude enhancement for scanned laser generation
We now compare these enhancements with the SLLS method, which has received much
recent attention [2,5-7,12,14]. In this case, the laser source passes over the crack, generating
an incident Rayleigh wave which can be reflected and mode-converted at the defect.
by the time the signals reach the detection point its effect will be minimal. Enhancement for
the SLLS method therefore considers interference of the incident and reflected Rayleigh
waves, but also the changes in the laser generation shape and boundary conditions as the laser
passes over the crack [2,5-7,12,13].
Similarly to the analysis of the SLD data, the Rayleigh wave peak-to-peak amplitude was
monitored during a scan and the ratio of the enhanced signal to the incident amplitude
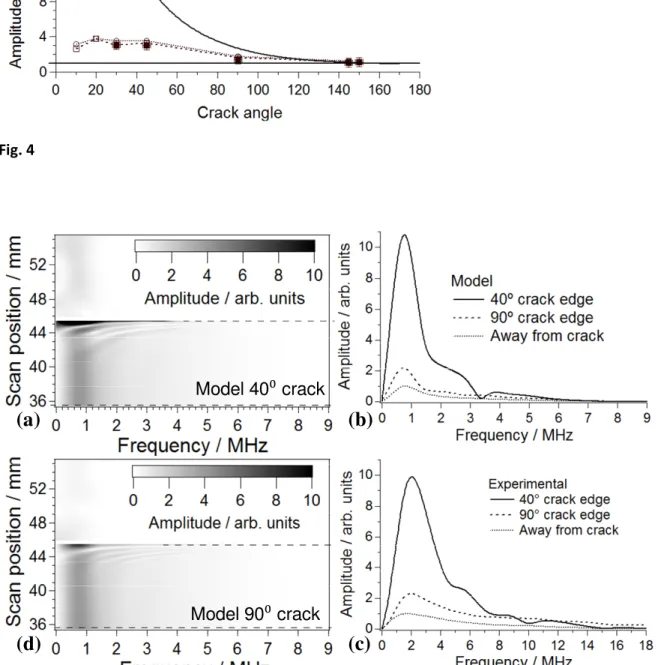
calculated for each crack angle. Figure 4 shows the out-of-plane amplitude enhancement
calculated from the experimental data for crack angles of 30º, 45º, 90º, 145º and 150º, and
both the out-of-plane and in-plane enhancements calculated from the modelled data. Due to
time limitations running the SLLS model, results from fewer crack angles than for SLD are
displayed, however, results again show very good agreement between modelled and
experimental data. In this case, the out-of-plane and in-plane enhancements from the model
data show a very similar variation with angle, with a much less significant angle-dependence
to the enhancements than measured when using a scanned detection system.
The fit to the out-of-plane enhancement from the scanned laser detection measurements is
shown in Figure 4 as a solid line. This shows clearly that the measured enhancement as the
angle reduced is much larger when the detection point is scanned over the crack than when
scanning the laser generation point over the defect. It is clear that for SLLS, the main
contribution to the enhancement is the change in the generation conditions, which will affect
both the in-plane and out-of-plane components in a similar manner, and lead to much less of
an angle dependence.
4 Results: frequency enhancements
Previous measurements have looked at the effect of a surface defect on the frequency content
SLLS technique, the frequency content in the region of the enhancement has been considered.
Kromine et al. showed that the frequency at which the FFT had a maximum magnitude
showed some variation in the region of a defect, changing by a measurable amount [2]. Other
measurements have shown interesting non-linear effects when measuring partially closed
cracks, and have shown that enhancement at higher frequencies may be beneficial when
detecting surface defects [12]. Here we consider the changes in frequency content with angle
when scanning using SLD and SLLS.
4.1 Frequency enhancement for scanned laser detection
For each position of a scan, the out-of-plane Rayleigh wave displacement (shown in the
B-Scan in Figure 2) was windowed and an FFT performed. These FFTs were then stacked into a
frequency B-Scan in a similar manner to producing B-Scans from time-domain data [12],
with examples shown in Figure 5(a) and (d) for modelled data with d/λ = 1.11, for a 40º and a
90º crack. The crack is at a position of 45.5 mm on the scan. Enhancement of the signal is
clear near the defect (shown as a dotted line), and a measurement of the maximum magnitude
of the FFT at each position would yield very similar results to the amplitude enhancement
measurements. However, there are also other interesting frequency effects which require
investigation.
Figures 5(a) and (d) show a near-constant frequency content when the generation and
detection points are away from the crack, as expected, but the enhancement is clear in the
larger magnitudes (shown by the colour scale) close to the defect. The bands near the defect
at higher frequencies are due to windowing effects, whereby the separation between the
incident and reflected Rayleigh waves leads to a second frequency content within the time
window. It is clear, however, that there are certain differences between the two frequency
this higher frequency enhancement is less significant. This is shown more clearly in Figure
5(b), where the FFTs are shown for generation and detection away from a defect (dotted
line), and for the detection point close to a 40° (solid black line) or 90° (dashed line) defect.
These have been normalised to the peak value of the FFT taken away from a defect.
From Figure 5(b), it is clear that in the region of frequency content of the incident
Rayleigh wave (around 0.2-1.2 MHz) the magnitude enhancement on comparing 90º and 40º
defects follows a similar pattern to that for the signal amplitude, with a higher enhancement
for shallower angles. There also appears to be enhancement to higher frequencies for the
shallower defect, although variations in this frequency content are overshadowed by
windowing effects and an alternative frequency analysis tool may be beneficial here. Figure
5(c) shows similar results in the experimental measurements, where again the enhancement is
much larger for the 40° crack and persists to higher frequencies; the frequency content here is
higher than for the models, however the defect depth was scaled to the central wavelength in
the ultrasound pulse.
This frequency-dependent behaviour is, to some extent, expected, considering the filtering
action of a crack. As shown in reference [9], when a broadband Rayleigh wave is incident on
a surface-breaking defect the higher frequencies tend to be blocked (reflected), while the
lower frequencies tend to be transmitted. When considering enhancement due to only
interaction of incident and reflected Rayleigh waves it is therefore to be expected that the
enhanced signal will contain significant higher frequency content. The addition of
mode-converted waves will complicate matters, but these are also likely to tend towards higher
frequency content [1].
Both model and experimental data confirm that the enhancement in the frequency content
closed defects, a measure of the signal at a higher frequency than is generally present in the
generated pulse may give a very clear indication of the defect [12].
4.2 Frequency enhancement for scanned laser line source
Finally, to compare the two techniques, FFTs were produced for the scanned laser line source
for two cases; 45º and 90º crack angles, for both model and experimental data. These are
shown in Figure 6(a) (model) and (b) (experiment). The SLLS model and experimental data
have similar bandwidth and the Rayleigh central frequencies are close, with experimental
peak frequency shifts due to focussing issues. Similarly to the amplitude enhancement
technique, Figures 6(a) and (b) show larger enhancements for shallower angles, but the
differences are much less significant than those found using a scanned detector. In contrast to
the SLD measurements, Figure 6 shows no significant frequency enhancement at higher
frequencies.
5 Conclusion
Previous work has shown that the Rayleigh wave signal enhancement for a surface defect
oriented normal to the sample surface, when using either scanned detection or a scanned laser
line source to generate signals, can be an excellent fingerprint of the position of a defect. We
have shown here that the enhancements in both the amplitude and frequency content, and for
both techniques, show promise for use in identifying surface defects and in finding their
orientation to the surface and position.
The out-of-plane amplitude enhancements have been compared with those from
measurements, where laser detection techniques were used to measure the out-of-plane
surface displacement on the sample surface during a scan, and show very good agreement.
dependence on crack angle, apart from for very shallow angles where the wave is able to pass
underneath the defect due to the small vertical depth. From the modelled data, the in-plane
and out-of-plane enhancements showed a difference in size, with a cross-over at angles below
40°. This change in behaviour is due to the mode-converted wavemodes present close to the
defect, which interfere with the incident and reflected Rayleigh waves [1].
For SLLS measurements some angle dependence is seen, however, it is not as pronounced
as that for the SLD measurements. For this case the OP and IP components show a similar
dependence on angle, confirming that the majority of the enhancement comes from changing
generation conditions, as expected.
Measurements using SLD techniques showed large frequency enhancements for shallow
cracks, and exhibited enhancement at higher frequencies than were present prior to
enhancement. For the SLLS measurements, some angle dependence to the frequency
enhancement was observed, but it was much less significant than for SLD measurements.
This angle dependence of both the amplitude and frequency content could potentially be
used to identify different angled cracks in real samples. It is clear for these measurements that
for defects which are inclined at an angle to the surface, such as rolling contact fatigue in
rails, which initially propagates at an angle of around 25° to the surface, SLD may be the
more beneficial technique for identifying and characterising defects when compared with
SLLS. It must be remembered that a defect with an angle of greater than 90° to the
propagation direction of the Rayleigh wave will have an angle of less than 90° if the
generation and detection points are switched, and hence the large enhancements at shallow
angles can again be exploited.
This work was funded by the European Research Council under grant 202735, ERC Starting
Independent Researcher Grant.
References
1. Jian, X., Dixon, S., Guo, N., and Edwards, R.: Rayleigh wave interaction with
surface-breaking cracks. Journal of Applied Physics 101 (6), 064906 (2007)
2. Kromine, A.K., Fomitchov, P.A., Krishnaswamy, S. and Achenbach, J.D.: Laser
ultrasonic detection of surface breaking discontinuities: Scanning laser source technique.
Materials Evaluation 58 (2), 173 (2000)
3. Fan, Y., Dixon, S., Edwards, R.S. and Jian, X.: Ultrasonic surface wave propagation and
interaction with surface defects on rail track head. NDT & E International 40 (6), 471
(2007)
4. Edwards, R.S., Jian, X., Fan, Y. and Dixon, S.: Rail defect detection using ultrasonic
surface waves. Review of Progress in Quantitative Nondestructive Evaluation, Vols 25A
and 25B, in AIP Conference Proceedings 820, pp. 1601-1608 (2005)
5. Jeong, H. and Park, M.C.: Finite-element analysis of laser-generated ultrasounds for
wave propagation and interaction with surface-breaking cracks. Research in
Nondestructive Evaluation 16 (1), 1 (2005)
6. Sohn, Y. and Krishnaswamy, S.: Interaction of a scanning laser-generated ultrasonic line
source with a surface-breaking flaw. Journal of the Acoustical Society of America 115
(1), 172 (2004)
7. Sohn, Y. and Krishnaswamy, S.: A near-field scanning laser source technique and a
microcantilever ultrasound receiver for detection of surface-breaking defects.
Measurement Science and Technology 17 (4), 809 (2006)
8. Vu, B.Q. and Kinra, V.K.: Diffraction of Rayleigh-waves in a half-space 1. Normal edge
9. Edwards, R.S., Dixon, S. and Jian, X.: Depth gauging of defects using low frequency
wideband Rayleigh waves. Ultrasonics 44 (1), 93 (2006)
10. Wang, J.S., Xu, X.D., Liu, X.J. and Xu, G.C.: A tuneable acoustic filter made by
periodical structured materials. Applied Physics Letters 94 (18), 181908 (2009)
11. Edwards, R.S., Jian, X., Fan, Y. and Dixon, S.: Signal enhancement of the in-plane and
out-of-plane Rayleigh wave components. Applied Physics Letters 87 (19), 194104
(2005)
12. Dixon, S., Cann, B., Carroll, D. L., Fan, Y. and Edwards, R. S.: Non-linear enhancement
of laser generated ultrasonic Rayleigh waves by cracks. Nondestructive Testing and
Evaluation 23 (1), 25 (2008)
13. Scruby, C.B. and Drain, L.E., Laser Ultrasonics: Techniques and Applications. Bristol:
Adam Hilger, (1990)
14. Arias, I. and Achenbach, J.D.: A model for the ultrasonic detection of surface-breaking
cracks by the scanning laser source technique. Wave Motion, 39 (1), 61 (2004)
15. Kinra, V.K.: Diffraction of Rayleigh-waves in a half-space 2. Inclined edge crack.
Journal of the Acoustical Society of America 79 (6), 1688 (1986)
16. Budaev, B.V. and Bogy, D.B.: Rayleigh-wave scattering by a wedge. Wave Motion 22
(3), 239 (1995)
17. Fujii, K.: Rayleigh-wave scattering at various wedge corners - investigation in the wider
range of wedge angles. Bulletin of the Seismological Society of America 84 (6), 1916
(1994)
18. Dutton, B., Rosli, M.H. and Edwards, R.S.: Defect feature extraction using surface wave
interactions and time-frequency behaviour. Review of Progress in Quantitative
Nondestructive Evaluation, Vols 29A and 29B, in AIP Conference Proceedings 1211, pp.
19. Dutton, B., Clough, A.R., Rosli, M.H. and Edwards, R.S.: Exploring surface wave
interaction with angled defects in the near and far field. Journal of Physics: Conference
Series, 2nd International Symposium of Laser-Ultrasonics, in press.
20. Dutton, B., Clough, A.R., Rosli, M.H. and Edwards, R.S.: Non-contact ultrasonic
detection of angled surface defects. NDT & E International, in press.
21. Essex, S.D., Potter, M. D. G., Vann, R. and Dixon, S.: Utilizing EBSD to validate and
understand NDE techniques. Review of Progress in Quantitative Nondestructive
Evaluation, Vols 28A and 28B, in AIP Conference Proceedings 1096, pp. 1224-1231
(2009)
22. PZFlex version 2.3, developed by Weidlinger Associates, Inc., http://www.pzflex.com/
23. Arias, I. and Achenbach, J.D.: Thermoelastic generation of ultrasound by line-focused
laser irradiation. International Journal of Solids and Structures 40 (25), 6917 (2003)
24. Aindow, A.M., Dewhurst, R.J. and Palmer, S.B.: Laser-Generation of Directional
Surface Acoustic-Wave Pulses in Metals. Optics Communications 42 (2), 116 (1982)
25. Hutchins, D.A.: Mechanisms of Pulsed Photoacoustic Generation. Canadian Journal of
Physics 64 (9), 1247 (1986)
26. Klein, M.B., Bacher, G. D., Grunnet-Jepsen, A., Wright, D. and Moerner, W. E.:
Homodyne detection of ultrasonic surface displacements using two-wave mixing in
photorefractive polymers. Optics Communications 162 (1-3), 79 (1999)
27. Viktorov, I.A.: Rayleigh and Lamb waves: physical theory and applications. Ultrasonic
technology, New York: Plenum Press (1967)
28. Dutton, B., Clough, A.R. and Edwards, R.S.: Ultrasound near field enhancement
Figure list
Fig. 1 Model and experimental sample scanning details. The scanning detection point case is
shown, and for SLLS the source and detection were reversed. All dimensions in mm.
Fig. 2 Results from a modelled scanned detection out-of-plane measurement of a 40º crack.
(a) is the B-Scan with dashed window around the Rayleigh-wave arrival time; (b) is the
peak-to-peak Rayleigh wave amplitude vs. scan position.
Fig. 3 Scanned laser detection: out-of plane and in-plane amplitude enhancements vs. crack
angle, for d/λ=1.11. The horizontal line shows no enhancement (factor=1).
Fig. 4 Scanned laser line source: signal enhancement factor vs. crack angle for out-of-plane
and in-plane modelled data and out-of-plane experimental data. The fit to the out-of-plane
SLD data is shown as a solid line. All data is for d/λ = 1.11.
Fig. 5 Magnitude FFT B-scan of modelled out-of-plane displacement data using a scanned
laser detector for (a) 40º crack and (d) 90º crack, and the corresponding normalised FFTs (b).
(c) shows experimental normalised FFTs for 40º and 90º cracks.
Fig. 6 Out-of-plane SLLS normalised FFTs for 45º and 90º cracks from, (a) model and (b)
Fig. 1
Fig. 2
Fig. 3
Crack dimensions
dθ
0.5
Aluminium sample
Laser line source
(fixed)
Detection
(scan)
150 50
50
θ
Symmetry axis
for model
Fig. 4
Fig. 5
(d)
(a)
(b)
(c)
Model 40⁰ crack
Fig. 6