Methyl 4-methylbenzoate
Aamer Saeed,aHummera Rafiqueaand Ulrich Flo¨rkeb*
aDepartment of Chemistry, Quaid-i-Azam University Islamabad, Pakistan, and b
Department Chemie, Fakulta¨t fu¨r Naturwissenschaften, Universita¨t Paderborn, Warburgerstrasse 100, D-33098 Paderborn, Germany
Correspondence e-mail: [email protected]
Received 29 March 2008; accepted 1 April 2008
Key indicators: single-crystal X-ray study;T= 120 K; mean(C–C) = 0.002 A˚; Rfactor = 0.042;wRfactor = 0.125; data-to-parameter ratio = 18.2.
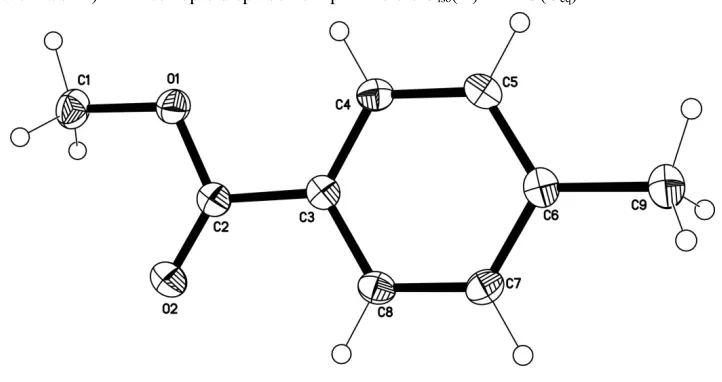
The structure of the title compound, C9H10O2, is related to
that of 4-methylphenyl 4-methylbenzoate and ethylene di-4-methylbenzoate showing similar bond parameters. The mol-ecule is planar, the dihedral angle between the aromatic ring and the –COOMe group being 0.95 (6). The cystal structure
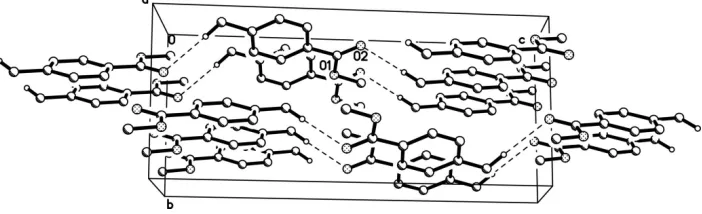
exhibits intermolecular C—H O contacts that link mol-ecules into infinite chains extended in the [001] direction.
Related literature
For related literature, see: Deguire & Brisse (1988); Gowdaet al. (2007; Gray & Whalley (1971); Harris & Mantle (2001); Saeed & Rama (1994); Simpson (1978).
Experimental
Crystal data
C9H10O2 Mr= 150.17 Monoclinic,P21=c
a= 5.9134 (11) A˚
b= 7.6048 (14) A˚
c= 17.484 (3) A˚
= 97.783 (4)
V= 779.0 (2) A˚3 Z= 4
MoKradiation
= 0.09 mm1 T= 120 (2) K 0.450.430.39 mm
Data collection
Bruker SMART APEX diffractometer
Absorption correction: multi-scan (SADABS; Sheldrick, 2004)
Tmin= 0.961,Tmax= 0.967
6617 measured reflections 1855 independent reflections 1482 reflections withI> 2(I)
Rint= 0.038
Refinement
R[F2> 2(F2)] = 0.042 wR(F2) = 0.124 S= 1.06 1855 reflections
102 parameters
H-atom parameters constrained
max= 0.31 e A˚3
min=0.20 e A˚3
Table 1
Hydrogen-bond geometry (A˚ ,).
D—H A D—H H A D A D—H A
C9—H9B O2i
0.98 2.51 3.4930 (16) 177
Symmetry code: (i)x;yþ1 2;z
1 2.
Data collection:SMART(Bruker, 2002); cell refinement:SAINT
(Bruker, 2002); data reduction:SAINT; program(s) used to solve structure:SHELXS97(Sheldrick, 2008); program(s) used to refine structure: SHELXL97 (Sheldrick, 2008); molecular graphics:
SHELXTL(Sheldrick, 2008); software used to prepare material for publication:SHELXTL.
AS gratefully acknowledges a research grant from Quaid-I-Azam University, Islamabad.
Supplementary data and figures for this paper are available from the IUCr electronic archives (Reference: SG2231).
References
Bruker (2002).SMARTandSAINT. Bruker AXS Inc., Madison, Wisconsin, USA.
Deguire, S. & Brisse, F. (1988).Can. J. Chem.66, 2545–2552.
Gowda, B. T., Foro, S., Babitha, K. S. & Fuess, H. (2007).Acta Cryst.E63, o3867.
Gray, R. W. & Whalley, W. B. (1971).J. Chem. Soc. C, pp. 3575–3577. Harris, J. P. & Mantle, P. G. (2001).Phytochemistry,58, 709–716. Saeed, A. & Rama, N. H. (1994).J. Sci. I. R. Iran,5, 173–175. Sheldrick, G. M. (2004).SADABS. University of Go¨ttingen, Germany. Sheldrick, G. M. (2008).Acta Cryst.A64, 112–122.
Simpson, T. J. (1978).J. Chem. Soc. Chem. Commun.pp. 627–628. Acta Crystallographica Section E
Structure Reports
Online
supporting information
Acta Cryst. (2008). E64, o821 [doi:10.1107/S1600536808008738]
Methyl 4-methylbenzoate
Aamer Saeed, Hummera Rafique and Ulrich Fl
ö
rke
S1. Comment
The title ester is an important intermediate in the synthesis of a variety of natural products. These include the sclerotiorin
group of fungal metabolites (Gray & Whalley, 1971), isochromans related to sclerotiorin pigments (Saeed & Rama, 1994)
and isocoumarins like the 7-methylmellein (Harris & Mantle, 2001) and stellatin (Simpson, 1978).
S2. Experimental
The title ester was prepared from commercial p-toluic acid according to standard procedure.
S3. Refinement
Hydrogen atoms were located in difference syntheses, refined at idealized positions riding on the carbon or nitrogen
[image:2.610.124.485.365.556.2]atoms (C–H = 0.88–0.99 Å) with isotropic displacement parameters Uiso(H) = 1.2U(Ceq).
Figure 1
Figure 2
Crystal packing viewed along [100] with intermolecular hydrogen bonding pattern indicated as dashed lines. H-atoms not
involved in hydrogen bonding are omitted.
Methyl 4-methylbenzoate
Crystal data
C9H10O2 Mr = 150.17
Monoclinic, P21/c Hall symbol: -P 2ybc
a = 5.9134 (11) Å
b = 7.6048 (14) Å
c = 17.484 (3) Å
β = 97.783 (4)°
V = 779.0 (2) Å3 Z = 4
F(000) = 320
Dx = 1.280 Mg m−3
Mo Kα radiation, λ = 0.71073 Å Cell parameters from 806 reflections
θ = 2.4–27.8°
µ = 0.09 mm−1 T = 120 K Block, colourless 0.45 × 0.43 × 0.39 mm
Data collection
Bruker SMART APEX diffractometer
Radiation source: sealed tube Graphite monochromator
φ and ω scans
Absorption correction: multi-scan (SADABS; Sheldrick, 2004)
Tmin = 0.961, Tmax = 0.967
6617 measured reflections 1855 independent reflections 1482 reflections with I > 2σ(I)
Rint = 0.039
θmax = 27.9°, θmin = 2.4°
h = −7→7
k = −10→9
l = −23→23
Refinement
Refinement on F2 Least-squares matrix: full
R[F2 > 2σ(F2)] = 0.042 wR(F2) = 0.124 S = 1.06 1855 reflections 102 parameters 0 restraints
Primary atom site location: structure-invariant direct methods
Secondary atom site location: difference Fourier map
Hydrogen site location: difference Fourier map H-atom parameters constrained
w = 1/[σ2(F
o2) + (0.0752P)2 + 0.0208P] where P = (Fo2 + 2Fc2)/3
Special details
Geometry. All e.s.d.'s (except the e.s.d. in the dihedral angle between two l.s. planes) are estimated using the full covariance matrix. The cell e.s.d.'s are taken into account individually in the estimation of e.s.d.'s in distances, angles and torsion angles; correlations between e.s.d.'s in cell parameters are only used when they are defined by crystal symmetry. An approximate (isotropic) treatment of cell e.s.d.'s is used for estimating e.s.d.'s involving l.s. planes.
Refinement. Refinement of F2 against ALL reflections. The weighted R-factor wR and goodness of fit S are based on F2, conventional R-factors R are based on F, with F set to zero for negative F2. The threshold expression of F2 > σ(F2) is used only for calculating R-factors(gt) etc. and is not relevant to the choice of reflections for refinement. R-factors based on F2 are statistically about twice as large as those based on F, and R- factors based on ALL data will be even larger.
Fractional atomic coordinates and isotropic or equivalent isotropic displacement parameters (Å2)
x y z Uiso*/Ueq
O1 0.39091 (14) 0.28701 (11) 0.44793 (5) 0.0280 (2)
O2 0.68910 (15) 0.15425 (13) 0.51751 (5) 0.0325 (3)
C1 0.2956 (2) 0.31740 (17) 0.51874 (7) 0.0320 (3)
H1A 0.2793 0.2050 0.5448 0.048*
H1B 0.1456 0.3732 0.5068 0.048*
H1C 0.3974 0.3946 0.5526 0.048*
C2 0.59091 (19) 0.20144 (15) 0.45593 (6) 0.0234 (3)
C3 0.67753 (18) 0.17434 (15) 0.38071 (6) 0.0223 (3)
C4 0.55841 (19) 0.23124 (15) 0.31083 (7) 0.0247 (3)
H4A 0.4154 0.2888 0.3098 0.030*
C5 0.6496 (2) 0.20350 (15) 0.24261 (7) 0.0262 (3)
H5A 0.5675 0.2426 0.1952 0.031*
C6 0.8588 (2) 0.11953 (15) 0.24239 (7) 0.0244 (3)
C7 0.97615 (19) 0.06389 (15) 0.31291 (7) 0.0253 (3)
H7A 1.1195 0.0068 0.3140 0.030*
C8 0.88716 (19) 0.09050 (15) 0.38126 (7) 0.0242 (3)
H8A 0.9693 0.0515 0.4287 0.029*
C9 0.9593 (2) 0.08897 (17) 0.16858 (7) 0.0312 (3)
H9A 1.1213 0.1213 0.1764 0.047*
H9B 0.8782 0.1613 0.1273 0.047*
H9C 0.9438 −0.0355 0.1542 0.047*
Atomic displacement parameters (Å2)
U11 U22 U33 U12 U13 U23
O1 0.0268 (5) 0.0322 (5) 0.0260 (4) 0.0042 (3) 0.0071 (3) 0.0018 (3)
O2 0.0343 (5) 0.0389 (5) 0.0234 (5) 0.0042 (4) 0.0004 (4) 0.0016 (3)
C1 0.0340 (7) 0.0342 (7) 0.0299 (7) 0.0024 (5) 0.0121 (5) −0.0009 (5)
C2 0.0249 (6) 0.0201 (6) 0.0248 (6) −0.0033 (4) 0.0022 (5) 0.0003 (4)
C3 0.0236 (6) 0.0203 (6) 0.0232 (6) −0.0031 (4) 0.0031 (4) 0.0006 (4)
C4 0.0214 (5) 0.0252 (6) 0.0271 (6) 0.0008 (4) 0.0022 (4) 0.0024 (4)
C5 0.0271 (6) 0.0281 (6) 0.0222 (6) −0.0019 (5) −0.0006 (5) 0.0029 (4)
C6 0.0275 (6) 0.0210 (6) 0.0251 (6) −0.0058 (4) 0.0049 (4) −0.0010 (4)
C7 0.0231 (6) 0.0215 (6) 0.0316 (6) 0.0008 (4) 0.0042 (5) 0.0002 (4)
Geometric parameters (Å, º)
O1—C2 1.3405 (14) C5—C6 1.3927 (17)
O1—C1 1.4468 (14) C5—H5A 0.9500
O2—C2 1.2065 (14) C6—C7 1.3962 (17)
C1—H1A 0.9800 C6—C9 1.5101 (16)
C1—H1B 0.9800 C7—C8 1.3843 (16)
C1—H1C 0.9800 C7—H7A 0.9500
C2—C3 1.4890 (16) C8—H8A 0.9500
C3—C8 1.3929 (16) C9—H9A 0.9800
C3—C4 1.3940 (16) C9—H9B 0.9800
C4—C5 1.3899 (16) C9—H9C 0.9800
C4—H4A 0.9500
C2—O1—C1 115.38 (9) C4—C5—H5A 119.3
O1—C1—H1A 109.5 C6—C5—H5A 119.3
O1—C1—H1B 109.5 C5—C6—C7 118.16 (10)
H1A—C1—H1B 109.5 C5—C6—C9 121.71 (11)
O1—C1—H1C 109.5 C7—C6—C9 120.13 (11)
H1A—C1—H1C 109.5 C8—C7—C6 121.10 (10)
H1B—C1—H1C 109.5 C8—C7—H7A 119.5
O2—C2—O1 123.28 (10) C6—C7—H7A 119.5
O2—C2—C3 124.43 (11) C7—C8—C3 120.20 (10)
O1—C2—C3 112.28 (9) C7—C8—H8A 119.9
C8—C3—C4 119.46 (10) C3—C8—H8A 119.9
C8—C3—C2 118.00 (10) C6—C9—H9A 109.5
C4—C3—C2 122.54 (10) C6—C9—H9B 109.5
C5—C4—C3 119.76 (11) H9A—C9—H9B 109.5
C5—C4—H4A 120.1 C6—C9—H9C 109.5
C3—C4—H4A 120.1 H9A—C9—H9C 109.5
C4—C5—C6 121.33 (10) H9B—C9—H9C 109.5
C1—O1—C2—O2 −1.07 (16) C3—C4—C5—C6 0.00 (17)
C1—O1—C2—C3 179.72 (9) C4—C5—C6—C7 −0.20 (17)
O2—C2—C3—C8 −0.70 (18) C4—C5—C6—C9 −179.94 (10)
O1—C2—C3—C8 178.50 (10) C5—C6—C7—C8 0.28 (17)
O2—C2—C3—C4 −179.94 (11) C9—C6—C7—C8 −179.98 (10)
O1—C2—C3—C4 −0.74 (16) C6—C7—C8—C3 −0.16 (17)
C8—C3—C4—C5 0.12 (17) C4—C3—C8—C7 −0.05 (17)
C2—C3—C4—C5 179.36 (10) C2—C3—C8—C7 −179.32 (10)
Hydrogen-bond geometry (Å, º)
D—H···A D—H H···A D···A D—H···A
C9—H9B···O2i 0.98 2.51 3.4930 (16) 177