http://dx.doi.org/10.4236/jtts.2015.54017
A Study of Noise & Development of Traffic
Noise Annoyance Models
Syed Aqeel Ahmad
1, P. K. Sarkar
2, Hom Nath Dhungana
3 1Department of Civil Engineering, Integral University, Lucknow, India2Department of Transport Planning, School of Planning & Architect, New Delhi, India 3Integral Institute of Medical Sciences & Research, Lucknow, India
Email: [email protected]
Received 27 June 2015; accepted 22 August 2015; published 25 August 2015
Copyright © 2015 by authors and Scientific Research Publishing Inc.
This work is licensed under the Creative Commons Attribution International License (CC BY).
http://creativecommons.org/licenses/by/4.0/
Abstract
Although noise annoyance is a major public health problem in urban areas, noise problem is still a great challenge for both public and transportation planners. The quantitative study of traffic noise and its relationship with annoyance & traffic volume was discussed in the paper and at the same time we tried to develop new statistical regression models to relate them. In the present study we also tried to fit different regression models such as Log-Linear, Linear, Log-Log Linear and Quad-ratic over noise data and decided which model fitted the best by using mathematics of principle of maxima & minima. After the identification of best fit curve we use this to fit our data. The aim of the study was to assess the predictive value of various factors on noise annoyance in noisy and quiet urban streets of New Delhi, capital of India.
Keywords
Noise Annoyance, Regression Models, Reliability & Validity, Equivalent Noise Level & Traffic Volume
1. Introduction
most important factors in producing deterioration of both well being and quality of life (QoF) of people in urban areas. Noise produces a series of physiological, psychological, behavioural changes in responses [3].
Various researchers have found out in their research that annoyance is very much related with noise levels. Vallet M. etal. [6] revealed that annoyance was related to measured noise levels for the people living along the expressways. Heavy lorries are found to constitute major sources of annoyance, particularly during the evening. For residents in bungalows, noise levels need to be somewhat lower. Ohrstrom E. et al. [7] investigated the acute annoyance reaction to different noise sources (lorries, aircraft, mopeds and trains) in a laboratory experi-ment. The results demonstrated that Leq demonstrated the best correlation with noise annoyance. However, traf-fic noise due to lorry is found to be less disturbing than aircraft noise at the same Leq value. Jakovljevic Branko etal. [8] determined principal factors for high noise annoyance in an adult urban population and assessed their predictive value. Noise annoyance was estimated using self-reported annoyance scale. Noise annoyance showed strong correlation with noise levels, personal characteristics and some housing conditions. Paunović Katarina et al. [9] conducted a study to assess the predictive value of various factors on noise annoyance in noisy and quiet urban streets. A cross-sectional study is performed on 1954 adult residents (768 men and 1186 women), aged 18 - 80 years. Noise annoyance has been estimated using a self-report five-graded scale. In noisy streets, the re-levant predictors of high annoyance are the orientation of living room/bedroom toward the street, noise an-noyance at workplace, and noise sensitivity. Thancanamootoo S. [10] studied the concerns about the noise nuis-ance resulted from the operation of urban railways (Metro) in Wallsend and Walkergate, UK. The following Noise Annoyance Model (NAM) has been developed in the study:
LOGNAI = −0.14 + 0.01 (LEQMI8H) + 0.05 (METROVI) + 0.04 (BGNOISE) − 0.003 (AGE) − 0.05 (TENURE). LOGNAI = log of noise annoyance index.
LEQMI8H = noise level.
METROVI = degree of annoyance with vibration from metro.
BGNOISE = degree of dissatisfaction with noise from road traffic and aircraft. AGE = age of the respondent.
TENURE = whether or not the respondent was an owner occupier.
1.1. Noise Annoyance
Noise annoyance is defined as an emotional and attitudinal reaction from a person exposed to noise in a given context.
1.2. Equivalent Noise Level (L
eq)
Leqrepresents the equivalent energy sound level of a steady state and invariable sound. It includes both intensity and length of all sounds occurring during a given period. The noise levels of different squares in different time intervals were predicted along with their equivalent noise levels (Leq). The value of Leq in dB (A) unit is calcu-lated by using the formula of Robinson.
In the present study we developed some models to estimate traffic noise annoyance models with respect to traffic noise and traffic volume.
1.3. Traffic Noise Index (TNI)
Traffic Noise Index (TNI) is another parameter, which indicates the degree of variation in a traffic flow. This is also expressed in dB (A).
1.4. Traffic Volume (Q)
The noise level near the highway depends on the number of vehicles. The noise level increases with an increase in traffic volume. Traffic volume is defined as the total number of vehicles passing a given point during a cific period of time or the number of vehicles that pass over a given section of a lane or a roadway during a spe-cific period of time.
2. Material & Method
equivalent traffic noise and traffic volume have been developed on the basis of traffic noise survey, residents’ perception survey and traffic volume survey. The surveys have been conducted at six study area locations in Delhi. But the data and developed model of one location i.e. Soami Nagar is discussed in the paper. The resi-dents’ perception has been recorded in terms of their degree of annoyance with respect to noise levels. There are five verbal scale degree of annoyance recorded viz. “tolerable (1)”, “slightly intolerable (2)”, “intolerable (3)”, “very intolerable (4)” and “extremely intolerable (5)”. After conduct of primary surveys data has been analyzed for equivalent traffic noise levels, traffic volume & its composition, residents’ perception on traffic noise in terms of degree of annoyance. The equivalent noise levels and corresponding residents’ perception have been determined with respect to five time bands in a day. The time bands have been divided based on temporal varia-tion of traffic and time duravaria-tion suggested by MoEF (The Ministry of Environment & Forests) for day and night. The present study was undertaken in 2011, at New Delhi, capital of India. The 24 hour traffic volume survey and noise measurement survey are conducted at Soami Nagar, New Delhi and thereafter resident’s perception data has been collected by interviewing of 62 households for different five time bands.
2.1. Traffic Volume
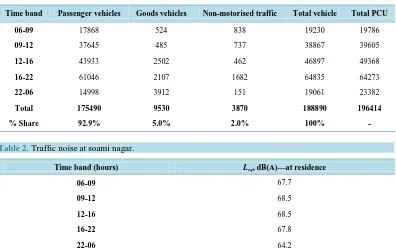
Classified traffic volume survey has been carried out for 24 hour in a working day at Soami Nagar. To differen-tiate passengers and goods modes, classified traffic volume survey has been carried out for 24 hours. The survey has been carried manually with the help of twenty enumerators at a time through tally marking, wherein all categories of modes are recorded separately for both directions of traffic. The 24 hour traffic volume data has been grouped into five time bands based on temporal variation of traffic and day/night noise limit timings. Ob-served Average Daily Traffic (ADT) worked out to 1,88,890 vehicles/1,96,414 PCUs with peak hour traffic of 8.2% at 10:00-11:00 hour, please refer Table 1.
2.2. Traffic Noise
Traffic noise measurement survey has been carried out for 24 hour in a working day simultaneously along with the traffic volume survey at Soami Nagar. The estimated Leq (day) and Leq (night) in this locality worked out to 68.1 dB (A) and 64.2 dB (A) respectively as presented in Table 2. These values are above the prescribed limit by Ministry of Environment and Forest (MoEF), Government of India of 55 dB (A) and 45 dB (A) in day [11] and night respectively.
Table 1. Traffic volume at soami nagar.
Time band Passenger vehicles Goods vehicles Non-motorised traffic Total vehicle Total PCU
06-09 17868 524 838 19230 19786
09-12 37645 485 737 38867 39605
12-16 43933 2502 462 46897 49368
16-22 61046 2107 1682 64835 64273
22-06 14998 3912 151 19061 23382
Total 175490 9530 3870 188890 196414
[image:3.595.116.512.468.720.2]% Share 92.9% 5.0% 2.0% 100% -
Table 2. Traffic noise at soami nagar.
Time band (hours) Leq, dB(A)—at residence
06-09 67.7
09-12 68.5
12-16 68.5
16-22 67.8
2.3. Residents’ Perception
Sixty two residents have been interviewed to find out their perception on traffic noise. The data has been col-lected with respect to five time bands. 52.4% residents informed that their annoyance level is intolerable (4) fol-lowed by 41.9% informed extremely intolerable (5) and 5.6% residents informed it as intolerable (3).
2.4. Reliability of Test Instrument
Any research based on measurement must be concerned with reliability of measurement. A reliability coefficient demonstrates whether the test designed is correct in expecting a certain collection of information to yield inter-pretable statements about individual differences. Validity and reliability are two fundamental elements in the evaluation of a measurement instrument. Instruments can be conventional knowledge, skill or attitude tests, sci-entific simulations or survey questionnaires. Reliability is concerned with the ability of an instrument to measure internal consistently Tavakol Mohsen, etal. [12]. The estimation of reliability of a test item is cheeked by chro-nobach α.
The Cronbach α is defined as
2 1
2
1 1
i
N Y i
X
N N
σ α
σ=
= −
−
∑
.N is the number of test items in the test instruments.
2
X
σ is the variance of observed total test scores.
2
Y
σ is the variance of component for the current sample of persons.
In the present study we calculated the reliability of test item by using SPSS (Version 19.0, IBM Chicago) software and it was found to be 0.71 which is acceptable. The validity has been estimated as r1∞ = (r11)1/2.
Therefore, validity of test items in the present study is r1∞ = (0.71)1/2 = 0.84, which means that the test measures true ability to the extent of 84% and this is acceptable.
3. Results
3.1. Selection of Model for Noise & Annoyance
Best noise indicator chosen to represent the noise source is Leq[10],which had been used to examine the rela-tionship between noise exposure and annoyance. The following four regression models were tested to prepare relationship between noise exposure and annoyance:
1) Log-Linear. 2) Linear.
3) Log-Log Linear. 4) Quadratic.
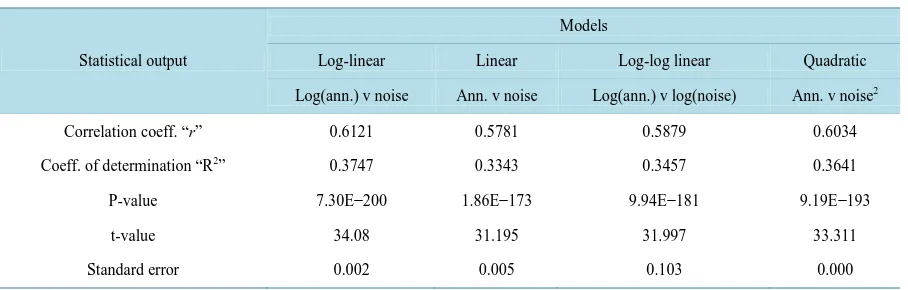
[image:4.595.87.541.575.720.2]The results of the above mentioned four regression models are presented in Table 3, along with the statistical outcomes associated with different models.
Table 3.Comparison of various models for noise and annoyance.
Statistical output
Models
Log-linear Linear Log-log linear Quadratic
Log(ann.) v noise Ann. v noise Log(ann.) v log(noise) Ann. v noise2
Correlation coeff. “r” 0.6121 0.5781 0.5879 0.6034
Coeff. of determination “R2” 0.3747 0.3343 0.3457 0.3641
P-value 7.30E−200 1.86E−173 9.94E−181 9.19E−193
t-value 34.08 31.195 31.997 33.311
Among above mentioned models, correlation coefficient “r” and coefficient of determination “R2” of Log- Linear relationship were observed maximum. Therefore, it has been chosen to prepare the relationship between noise exposure and annoyance.
3.2. Traffic Noise Annoyance Models
The following traffic noise annoyance model has been developed for Soami Nagar by utilising day time equiva-lent traffic noise and corresponding annoyance data. For this our proposed model is given by,
(
)
log Annoyance =0.2043×Leq−12.436 (1)
R2 : 0.55
P-value : 1.9E−22
t-value : 12.07
Std. error : 0.017
Correlation coefficient : 0.245
3.3. Development of Noise Annoyance Models with Respect to Traffic Volume
The traffic noise is generated through motorised traffic. Motorised traffic is broadly divided into two categories viz. passenger traffic and goods traffic. The relationship between responses in regard to annoyance and observed noise levels has been studied in the previous sections. But in this section, an attempt has been made to develop the relationship between responses in regard to annoyance and passenger & goods traffic by conducting multiple regression analysis. The annoyance is considered to be dependent variable while passenger traffic & goods traf-fic turn into independent variable.
For this our proposed model is,
(
)
(
)
(
)
log Annoyance 0.1641 log Passenger Traffic Volume
0.07319 log Goods Traffic Volume 0.42045
= ×
+ × − (2)
Statistical outputs of model 2 is given by,
Adjusted R2 : 0.55
P-value
Passenger traffic : 1.54E−10
Goods traffic : 1.18E−08
t-value
Passenger traffic : 7.01
Goods traffic : 6.13
Std. error
Passenger traffic : 0.023
Goods traffic : 0.012
Correlation coefficient
Passenger traffic : 0.625
Goods traffic : 0.632
4. Discussion
noise annoyance model with respect to Leq which shows the comparatively high value of R2 (0.55). The model is efficient to predict the degree of annoyance if we have quantitative information of noise level. Similarly in our second model we relate noise annoyance with respect to traffic volume. The value of adjusted R2 for the model is again 0.55 which is developed by using multiple regression analysis. Practically, the functional form of these models can play a crucial role in the study of noise annoyance. Our results have almost the same conclusion over development of models as previous related works [13] [14].
References
[1] Rylander, R., Sorensen, S. and Kajland, A. (1976) Traffic Noise Exposure and Annoyance Reactions. Journal of Sound and Vibration, 47, 237-242. http://dx.doi.org/10.1016/0022-460X(76)90719-7
[2] Ouis, D. (2002) Annoyance from Road Traffic Noise: A Review. Journal of Environmental Psychology, 21, 101-120. http://dx.doi.org/10.1006/jevp.2000.0187
[3] Calixto, A., Diniz, F.B. and Zannin, P. (2003) Effects of Traffic Composition on Road Traffic Noise in an Urban Set-ting. Cities, 20, 23-29. http://dx.doi.org/10.1016/S0264-2751(02)00093-8
[4] Jakovljevic, B., Pavnovic, K. and Belojevic, G. (2009) Road-Traffic Noise and Factors Influencing Noise Annoyance in an Urban Population. EnvironmentInternational, 35, 552-556. http://dx.doi.org/10.1016/j.envint.2008.10.001
[5] Guski, R., Felscher-Suhr, U. and Schuemer, R. (1999) The Concept of Noise Annoyance: How International Experts See It. Journal of Sound and Vibration, 223, 513-527. http://dx.doi.org/10.1006/jsvi.1998.2173
[6] Vallet, M., Maurin, M., Page, M.A., Favre, B. and Pachiaudi, G. (1978) Annoyance from and Habituation to Road Traffic Noise from Urban Expressways. Journal of Sound and Vibration, 60, 423-440.
http://dx.doi.org/10.1016/S0022-460X(78)80121-7
[7] Ohrstrom, E., Bjorkman, M. and Rylander, R. (1980) Laboratory Annoyance and Different Traffic Noise Sources.
Journal of Sound and Vibration, 70, 333-341. http://dx.doi.org/10.1016/0022-460X(80)90303-X
[8] Branko, J., Katarina, P. and Goran, B. (2009) Road-Traffic Noise and Factors Influencing Noise Annoyance in an Ur-ban Population. Environment International, 35, 552-556. http://dx.doi.org/10.1016/j.envint.2008.10.001
[9] Katarina, P., Branko, J. and Goran, B. (2009) Predictors of Noise Annoyance in Noisy and Quiet Urban Streets. Sci-ence of the Total Environment, 407, 3707-3711. http://dx.doi.org/10.1016/j.scitotenv.2009.02.033
[10] Thancanamootoo, S. (1987) Impact of Noise from Urban Railway Operations. Ph.D. Thesis, University of New Castle upon Tyne, 165-173.
[11] Ahmad, S.A. and Sarkar, P.K. (2014) A Review of Traffic Noise Standards and Noise Models. Trends in Transport Engineering & Application, 1, 10-19.
[12] Mohsen, T. and Reg, D. (2011) Making Sense of Cronbach’s Alpha. International Journal of Medical Education, 2, 53-55. http://dx.doi.org/10.5116/ijme.4dfb.8dfd
[13] Agarwal, S. and Swami, B.L. (2009) Noise Annoyance under Interrupted Traffic Flow Condition for Jaipur City. In-ternational Journal of Applied Science and Engineering, 7, 159-168.