Comparison of Clustering Methods over a Hidden Web Data
using Stratification
G. Jaya Suma,
PhD.Associate Professor Department of Information
Technology JNTUK-UCEV
Vizianagaram
R. Manjula
Department of Computer Science & Engineering
JNTUK-UCEV Vizianagaram
ABSTRACT
This paper’s centre of attention is on the problem of data mining (in general) and clustering (in specific) on a hidden web data. We know that data mining is a process that analyzes and extracts knowledge from large amounts of data which provides useful information to users. Hidden or deep web data is the database located at remote system .So, to access such data, we need query interface or HTML forms. Clustering such type of data is difficult as it is limited to indirect access through query interface and requires more time to access. A novel methodology stratified clustering introduced through sampling of datasets. The samples can only be obtained by submitting queries. It is required to apply efficient sampling method to reduce time consumption and number of queries required to access deep web data. This paper proposes series of steps to accomplish the task.1) the space of input attributes are categorized into stratum that represents the association between input and output attributes.2) Efficient sampling method proposed to obtain high estimation accuracy .3) the samples obtained are used by two clustering methods, stratified k-means clustering and hierarchical clustering. The estimation accuracy of cluster centers of deep web data are compared for simple random sampling against stratified sampling and k-means clustering method against hierarchical clustering method.
Keywords
Stratification, Stratified Sampling, Stratified k-means
Clustering, Stratified Hierarchical clustering;
1.
INTRODUCTION
In current days, one of the approaches of data distribution became most popular is hidden web. Hidden web data contains large amount of data stored in the form of database located at remote system. It can be accessed through internet by submitting user queries using HTML forms called query interfaces. Hidden or deep web is qualitatively different from surface web [4]. Many recent efforts took place for the development of deep web querying systems to provide an interface between deep web and users [3, 5 and 6]. It is advantageous to obtain the summary for an existing deep web data source. For example, consider car dataset (as inTable1). The summaries of car details for a specific range of price attribute values highly useful for purchaser or customer. The main approach of this paper is to cluster the deep web data that presents interesting information to users and compares two clustering methods.
2.
LITERATURE SUMMARY
The various existing sampling methods for clustering, sampling for different data mining problems and sampling for hidden web discussed.
Clustering based on Sampling
The various sampling methods are widely studied by many researchers. CLARA is one of the best methods for clustering huge amount of data based on sampling that finds best potential medoids [2].
Distinct Data Mining Problems based on
Sampling
One of the data mining methods is frequent item set mining. This is studied by several researchers. Toivonen developed random sampling method to find association rules, proved by considering entire dataset [1].
Sampling Methods for Hidden Web Data
There have been several research efforts for sampling from deep web data. Dasgupta et al proposed HDSampler, to retrieve random sample through query interface from deep web data.
3.
METHODOLOGY
In this section, the concept of components to achieve the goal of obtaining cluster centers of output attributes of deep web data source is discussed.
3.1 Stratification
Stratification is the process of partitioning the entire deep web data source into homogenous groups with minimized variance within each group. These homogenous groups are also called as strata or stratum. Stratification helps to improve performance for sampling and reduce error in the estimation of cluster centers in deep web data source. Also, finds the relationship between input and output attributes. Stratified sampling is a process of choosing sample from each stratum. Stratification helps to obtain a sample that represents actual distribution of deep web data.
attributes; among them one input attribute is chosen to further stratify the data so that the variance within each stratum is small.
This process continues until there is no further input attributes to stratify or if specified threshold value is greater than the radius of data records within the stratum.
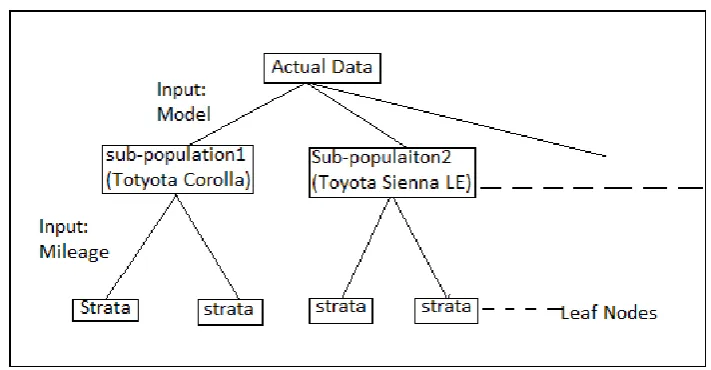
For example, consider the car data set shown in table 1 with 20 records. It is clearly observed that the value of output attribute price varies accordingly depending on the input attribute model. So we can consider “model” attribute to stratify the data.
In deep web data source, consider set of input attributes IN = {IN1, IN2, INn}, set of output attributes OP = {OP1, OP2,…
OPn}. Now, say for a query input subspace for each leaf node
of tree contains subset of input attributes S, (S N) input attributes not contained in current query subspace is said to be potential set of splitting input attributes i.e., P={IN –S}. The Radius of query sub-space is,
Radius = R=1920; for strata
sub-population1
Here, D (OP) denotes the vector of output attributes, CS denotes the centre of sub-population i.e. mean value, and N represents the size of population.
For an input attribute PIi, the decrease of radius,
i =Radius- Pi =di,k |Q) × Ri,k;
i=199; for sub-space with Input attribute:’Service’ i=1413; for sub-space with Input attribute:’mileage’
Here, p (Pi =di,k|Q) = P (Pi =di,k , Q)/p (Q) represents the
conditional probability of input attribute Pi, di, k represents the
k=1…, t domain values. Assume, deep web data provides the prior probability of P (Pi =di,k, Q) and p (Q), hence p (Pi
=di,k|Q) can be obtained. Ri,k is computed similar to the
radius formula for kth potential child generated by splitting with input attribute Pi.
For example, consider car dataset. First we consider “Model” attribute to stratify the data as it clearly decreases radius of “price” attribute within strata. Now, calculating decrease of radius for “service” ( RI=199) and “mileage” ( i=1413) attributes, “mileage” has the highest decrease of radius. Hence, input attributes “mileage is considered to further stratify the data.
Figure 1 show the tree structure representation of stratification of data which was presented in the table1, with leaf nodes representing stratum. Initially, data records stratified considering the input attribute “model” (with values ‘Toyota Corolla’ and ‘To Sienna LE’).Again these sub-populations are sub-divided into strata considering input attribute “mileage” with domain range of values= {(5000 to 20000),(20000 to 45000),(45000 to 90000)},as decrease of radius is highest for “mileage” attribute compared to “service” attribute. This greedy stratifying process stops when the radius associated with all leaf nodes is smaller than a pre-specified threshold.
The obtained strata later used for stratified sampling.
3.2 Effective Sampling Method
The Stratification process results in set of strata. The traditional Simple random sampling can be performed to choose random number of data records from each stratum. Random sample data may not represent the accurate deep web data source. The efficient sampling method Neymann allocation method [10] can be applied to obtain number of data records to be drawn from each stratum. The proposed sampling method reduces the error in the estimation of distribution of deep web data and also reduces access cost. The cost here represents the number of queries required to access data.
The obtained sample represents the actual distribution of deep web data source and further used for stratified clustering.
3.3 Stratified Clustering Methods
In this section, clustering methods over a stratified sample obtained from deep web data source is introduced. As sample obtained is not a simple random sample, traditional k-means or hierarchical clustering cannot be applicable. So, we go for a novel clustering methods stratified k-means clustering and stratified hierarchical clustering.
3.3.1 Stratified k-means Clustering
In stratified sample, each data record is associated with a certain weight. Stratified k-means clustering is similar to original k-means clustering, but it considers weight of a data record of sample [8]. Let us consider a sample SS, assume nj
records are drawn from jth stratum, corresponding stratum contains Nj number of data records. Then, we can say each
data record in the sample is associated with the weight of .
The novel clustering method works same as traditional k-means clustering. The difference is at each iteration the centre of cluster is associated with weight of data record. Similar to k-means clustering, centre of ith cluster is
Ci = ;
Two cluster centres, C1=4142.82; C2=23985.5;
Here, Dm(OP) represents the vector of output attributes for
data records belonging to cluster, wtm represents the weight
of data record Dm and m denotes number of data records in a cluster.
The performance of clustering depends on number of clusters k. To achieve good results, the algorithm can be repeated many number of times, the smallest distance within the clusters will be taken as final result. The distance within the clusters is obtained by,
CRDist=
where Ci represents the set of data objects belonging to the ith cluster in the sample, distance(Dr(OP), ci) denotes
distance between data records and center of cluster.
k-means algorithm, cluster centres obtained are C1=14142.82
C2= 23985.5
Hence, the output of stratified k-means clustering is estimated two cluster centres of deep web car data are obtained.
3.3.2 Stratified Hierarchical Clustering
In this approach, Similar to stratified k-means clustering process discussed above, the original hierarchical clustering works with the difference is it considers weight of each sample record. Let us consider a sample NS, assume nj data
records are
drawn randomly from jth stratum, the corresponding strata contains Nj data records. Hence, each data record in the
sample
represents data records in jth stratum. Correspondingly, in
our clustering process, each data record in the sample is
associated with weight of . An algorithm [9] works in the
following way.
Similar to the traditional hierarchical clustering methods, at each step, two clusters with the minimum distance are merged into one cluster. The process continues until there are k clusters left, where k is the predefined number of clusters.
The distance between two data records is computed as the Euclidean distance on the output attributes. Formally, for two data records D1 D2 from the deep web data source with the set of output attributes OP, the distance is computed as:
Distance(D1,D2) = where, the output
attribute Oj ∈ OP. The distance between two clusters, C1, C2, is the average of the weighted distances between all pairs of two data records Di ∈ C1, and Dj ∈ C2,
i.e., Distance(C1,C2)= ;
Dist(C1,C2)=67; Dist(C1,C3)=106; Dist(C2,C3)=76;
where ωti, ωtj denote the weights associated with data
records Di ∈ C1 and Dj ∈ C2 respectively.
For example, consider two strata are generated from the values shown in table 1 with input attribute values “Toyota
Corolla” and “Toyota Sienna LE”. Now, say a stratified sample is drawn from two stratum with n1=5, n2= 5 number of data records from each stratum. The ouput attribute price values of,
Sample form 1st stratum=
{15995,12495,16277,13995,12956}
Sample from 2nd
stratum={22995,12888,24977,25975,21995}. Here, as there are 10 records , as in hierarchical clustering 10 clusters are generated. For a given number of clusters k=3, using above distance formula , we obtain distance between these clusters as:
Dist(C1,C2)=67; Dist(C1,C3)=106; Dist(C2,C3)=76;
Clearly, distance between clusters C1 and C2 is lowest , so it
can be merged to form a cluster, thus we attain two clusters using hierarchical agglomerative clsutering with stratified sample.
Representation of Clusters
The clusters are represented by their centre vectors. In traditional clustering methods, the centre vectors are computed as the mean vectors of the data records assigned to the same cluster. This cannot be used directly in the stratified clustering, where the data is not randomly drawn from the entire population. Thus, the centre vectors are computed as the weighted average of the data records assigned to the same cluster. For the ith cluster Ci, the centre vector is computed
as:
;
=15228.71 ; =24649; for two clusters obtained above.
here om corresponds to the vector of output attributes for the
data record Dm ∈ Ci. The associated radius Ri for cluster Ci is
estimated as:
where denotes the Euclidean distance on output attributes. The Radius associated with in the cluster is used to find the best number of clusters, the clusters with smallest radius within the cluster is considered as the final cluster centers as output.
Table 1. An Example of Deep Web Car Data set
S.NO MODEL NO. OF DOORS SERVICE MILEAGE PRICE
1 Toyota Corolla 4 3 11655 15995
2 Toyota Corolla 4 3 13324 15995
Figure 1. The Process of Stratification in the form of Tree Structure
4. EXPERIMENTAL ANALYSIS
In this section, the comparison of two clustering methods hierarchical and k-means clustering, simple random sampling against stratified sampling proposed using weka tool [7].
Synthetic data set: This data set is generated using simple java application that creates any number of specified rows with four categorical input attributes and one numerical output attribute.
Yahoo Data set: The Yahoo! Data set consist sampled web data from real world hidden web data at http://autos.yahoo.com/. It consists of four categorical input attributes model, service, number of doors of, mileage and one numerical output attribute price.
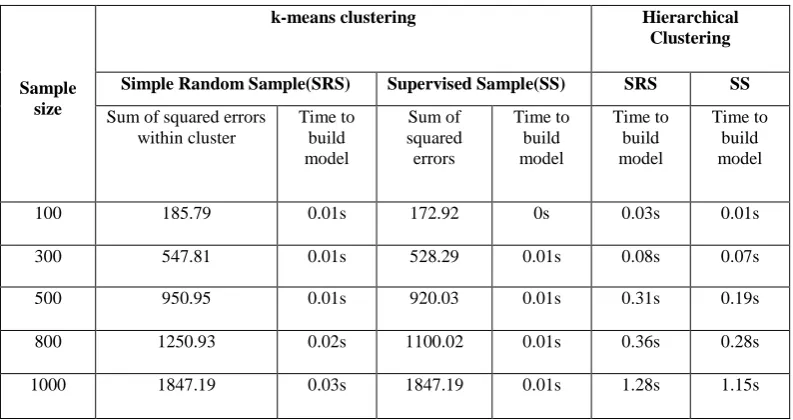
The tables shown below represent the comparison of two clustering methods k-means clustering against hierarchical clsutering, and simple random sampling (SRS) against stratified
Sampling. Here, stratified sampling is obtained using supervised filter in the weka tool that subsamples the data set by stratification.
As the mean squared error values is larger for simple random sampling methods than supervised (stratified) sampling, the clusters efficiency is more based on stratified sampling method. It is clearly shown in table that, time required to build a model for k-means clustering is smaller than hierarchical clustering, hence the scalability of k-means clustering is more than hierarchical clustering.
4 Toyota Sienna LE 4 2 41670 22991
5 Toyota Sienna LE 4 2 45370 21995
6 Toyota Corolla 4 3 32107 12495
7 Toyota Corolla 4 3 5928 16277
8 Toyota Corolla 4 4 67515 10999
9 Toyota Corolla 4 2 40697 13995
10 Toyota Sienna LE 4 9 80279 12888
11 Toyota Corolla 4 3 61000 12499
12 Toyota Sienna LE 4 3 38694 19995
13 Toyota Sienna LE 4 1 18610 24977
14 Toyota Sienna LE 4 1 14648 25888
15 Toyota Corolla 4 3 34697 13799
16 Toyota Corolla 4 4 44468 12956
17 Toyota Corolla 4 2 11792 15900
18 Toyota Sienna LE 4 11 103651 8995
19 Toyota Corolla 4 4 88419 10900
The Proposed method stratification process stratified clustering and sampling method discussed in section3
[image:5.595.91.509.144.364.2]improves the efficiency of sampling and clustering, in specific larger databases located at remote system.
Table 2. Comparison of Clustering Methods and Sampling using Synthetic Data set
Sample size
k-means clustering Hierarchical Clustering
Simple Random Sample(SRS) Supervised Sample(SS) SRS SS
Sum of squared errors within cluster
Time to build model
Sum of squared errors
Time to build model
Time to build model
Time to build model
400 482.07 0.02s 407.10 0.02s 0.24s 0.17s
800 959.48 0.06s 840.64 0.04s 1.35s 0.28s
3000 3605.59 0.11s 3183.11 0.08s 38.05s 16.4s
5000 5956.20 0.2s 6603.43 0.18s 72s 52s
Table 3. Comparison of Clustering Methods and Sampling using Yahoo Data set
Sample size
k-means clustering Hierarchical
Clustering
Simple Random Sample(SRS) Supervised Sample(SS) SRS SS
Sum of squared errors within cluster
Time to build model
Sum of squared errors
Time to build model
Time to build model
Time to build model
100 185.79 0.01s 172.92 0s 0.03s 0.01s
300 547.81 0.01s 528.29 0.01s 0.08s 0.07s
500 950.95 0.01s 920.03 0.01s 0.31s 0.19s
800 1250.93 0.02s 1100.02 0.01s 0.36s 0.28s
1000 1847.19 0.03s 1847.19 0.01s 1.28s 1.15s
5. CONCLUSION
In present days, growing in the usage of internet by vast number of users, data in the deep web is increasing. Clustering on such type of deep web data, obtaining summarized results presents user with interested information. This paper proposed a new methodology for clustering on deep web data using stratified k-means clustering and hierarchical clustering. The proposed stratified sampling and neymann allocation method improves the performance of clustering. Comparison of clustering methods, deep web sampling methods analyzed using weka tool. The
experimental analysis resulted that k-means clustering is more
scalable than hierarchical clustering, stratified sampling results in high performance compared to simple random sampling.
6. REFERENCES
[image:5.595.100.497.408.618.2][2] L. Kaufman and P.J.Rousseeuw. Finding Groups in Data an Introduction to Cluster Analysis. Wiley InterScience, Newyork, 1990.
[3] A. Kementsietsidis, F. Neven, D. Van de Craen, and S. Vansummeren. Scalable multi-query optimization for exploratory queries over federated scientific database, VLDB Endowment, 1:16-27, 2008.
[4] M.K. Bergman. The Deep Web: Surfacing Hidden Value, Journal of Electronic Publishing, 7, 2001.
[5] D. Braga, S. Ceri, F. Daniel, and D. Martinenghi. Optimization of Multi-domain Queries on the web. VLDB Endownment, 1:562-673, 2008.
[6] U. Srivastava, k. Munagala, J.Widom, and R. Motwani. Query Optimization over web services. In Proceedings of the 32nd VLDB Endownment, pages 255-366, 2006.
[7] Bharat Chaudhari, Manan Parikh. A Comparative study of clustering algorithms using Weka Tools. In Proceedings of International Journal IJAIEM, 2012 [8] Tantan Liu and Gagan Agarwal. Stratified k-means
Clustering over a Deep web Data Source. In Proceedings of the 18th ACM SIGKDD International Conference, pages 1113-1121, 2012.
[9] Tantan Liu and Gagan Agarwal. Stratification based Hierarchical Clustering on Deep Web Data source. In Proceedings of 12th SIAM International Conference. Pages 70-81, 2012.
[10]W. Cochran. Sampling Techniques. Wiley and Sons, 1977.