International Journal of Emerging Technology and Advanced Engineering
Website: www.ijetae.com (ISSN 2250-2459, ISO 9001:2008 Certified Journal, Volume 8, Issue 3, March 2018)
Wireless Multimedia Sensor Network for Image Compression:
Objective & Performance Analysis
Raj Kumar Mondal
Maulana Azad National Urdu University, Hyderabad, India Abstract— The Wireless Multimedia Sensor Network
differs from the scalar network like WSN which depends on environment, data format, memory, microcontroller, radio transceiver etc. Several routing protocol such as data centric or hierarchical, energy management protocol and dissemination of data have been designed and developed for wireless sensor networks which depend on WSNs architecture and its application. Multimedia data communications through WSNs are widely used and more successful in the research area as well as real life application. The main objective of this paper represent the use of image compression algorithm through WSNs in order to reduce the power consumption of sensor and transmitting & receiving multimedia information through sensors to maintain a lifelong network instead of scalar network. In this paper we describe DWT, DCT and SPIHT algorithms. After evaluation its performance shows that DWT transform algorithm better than DCT and SPIHT compression algorithms in terms of image quality and power consumption of sensor nodes.
Keywords—Wireless Sensors Networks (WSNs), Wireless Multimedia Sensors Networks (WMSNs), Discrete Wavelet Transform, Discrete Cosine Transform, Set Partitioning in Hierarchical Tree, power consumption & complexity.
I. INTRODUCTION
In the recent technological world the use of wireless communications, VLSI, integrated digital circuits like microcontroller development of wireless multimedia sensor networks has been enabled and become dramatically feasible. We know that image consists of many pixels that are highly correlated to each other. However, due to this correlation; it contains a large amount of data redundancies which occupy large memory space and decreases transmission bandwidth and processing time. There are three types of data redundancy [1] that are observed. (i)Spatial Redundancy (ii) Temporal Redundancy & (iii)Spectral Redundancy. Image Compression is one such technology that has been developed to reduce image size[2].Its applications such as cameras, medical instruments, image databases, and video-on-demand systems, among many others [3]. There are several image compression technique like DWT, DCT, SPIHT, ISEC etc.
Choosing an image compression technique depends upon the nature of operating platform, this platforms is wireless multimedia sensor network (WMSN).
The layout of a typical WMSN consists of a large number of sensor nodes deployed in a deterministic or self-organizing region of interest broadcast, gradient setup and reinforcement. Typically, each node in WMSN has the ability to acquire, compress and transmit captured frames to the base station which acts as the main network controller or coordinator. In this role, its primary function is to coordinate the functions of the nodes. It also collects information gathered by the nodes to be stored or further processed. WMSN has gained a wide attention as such networks that has been used for many applications such as military target tracking, traffic surveillance, security monitoring, military target tracking, chemical and biological detection, plant monitoring, agriculture and transportation.
One of the drawbacks Compared to conventional wired networks and wireless network, WMSN encounters more problems due to their limited resources in memory, processing speed, bandwidth, time & space complexity, and power consumption. As a result of large amount of data being transmitted over WMSN, in that sense we need data compression technique to decrease large data into compressed format.
WMSN differs from scalar data WSN in the following points: (a) Nature and volume of visual data being manipulated which is pixel-based. On the other hand, the data manipulated by WSN are scalar data based such as simple value of temperature or simple mathematical calculation (b) The resource limitation of sensor nodes in terms of memory or processor speed makes most of the compression algorithms are inapplicable for WMSNs. (c) More energy needed by compression algorithms to handle images compared to scalar data. (d) Visual flow in WMSN is susceptible to information loss due to redundancy nature, but WSN data loss affects accuracy of collected data.
International Journal of Emerging Technology and Advanced Engineering
Website: www.ijetae.com (ISSN 2250-2459, ISO 9001:2008 Certified Journal, Volume 8, Issue 3, March 2018)
Thirdly, we execute performance evaluation and we compare these three methods in terms of image quality, execution time and transmission time, packet lost and memory usage and finally energy consumption. It concludes the benefits and shortcomings of most recent efforts of such algorithms as well as, an open research issue for each compression method and its potentials to WMSNs.
II. RELATED WORK
The most current research related to image compression in wireless sensor networks [4] is limited to the evaluation by simulation because of compatibility and resource limitation. We have used several methods in the compression such as DCT, DWT, SPIHT tested by simulation. For instance, DCT compression method makes the image into 8x8 blocks and then encoding a block by FDCT and then transform into a few low-frequency components. To reduce the number of bits needed to represent the image, these components are then quantized. The next step is entropy coding. We have to use a combination of variable length coding and Huffman encoding. Finally data packets are created suitable for transmission over the wireless sensor network.
In case of DWT, we used filters that can divide the input image into four non-overlapping multi-resolution Sub bands LL, LH, HL and HH on the first level. In horizontal, vertical and diagonal orientation each sub band contains the low-pass information and the others contain high-pass information. The next step is quantification and coding of sub bands used to reduce the number of bits needed to represent the image. This step will lower the quality of the image but better than DCT. The image quality will depend on the values of the quantization used. The next step is arithmetic coding. It is a variable length coding it encodes the source message fully. Finally data packets are created suitable for transmission over the wireless sensor network.
In case of SPIHT, it is a powerful wavelet based image compression algorithm that achieved very compact output bit stream than DCT without adding an entropy encoder. This enhances its efficiency in terms of computational complexity. Moreover, progressive mode in SPIHT [5] allows the process of coding/decoding to be stopped at any stage of the compression. Sorting pass and the refinement passes are used in coding process in SPIHT.
III. COMPRESSION METHODS FOR SENSOR NETWORKS A. Discrete Cosine Transform (DCT)
The DCT is similar to the Discrete Fourier transform which transforms a signal or image from the spatial domain to the frequency domain.
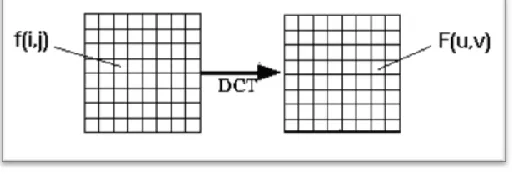
[image:2.612.326.582.375.466.2]First the image is transform into the suitable format for image compression. Second, the Discrete Cosine Transform (DCT) decompose the original image into the parts of 8x8 blocks as shown in Figure-III.1. Third, each block can be transform into the frequency plane. This is done by using a fast discrete cosine transform (FDCT). After the transformation, most of information is concentrated to a few low-frequency components. To reduce the number of bits needed to represent the image. Fourthly, these components are then quantized. This step will lower the quality of the image by reducing the bits. We have use a quantization matrix for the image tradeoff and controlling the produced bits that will define the step size for each of the frequency component. The components will also be zigzag scanned to put the most likely non-zero components first and the most likely zero components last in the bit-stream. Finally, entropy coding is applied that is combination of variable length coding and Huffman encoding. Then data packets are created suitable for transmission over the wireless sensor network.
Figure III.1 DCT Encoding
The general equation for a 2D (N by M image) DCT is defined by the following equation:
1 1 1 1 2 2
0 0
2 2
( , ) ( ) ( ) cos (2 1) cos (2 1) ( , )
2 2
N M
i j
u u
F u v i j i j f i j
N M N N
(1)
And the corresponding inverse 2D DCT transform is simple
F
1(u,v). Where1
( ) 0,
2 ( ) 1
for
otherwise
(2)
The basic operation of the DCT is as follows:
i. The input image is N by M.
ii. f(i,j) is the intensity of the pixel in row i and column j. iii. F(u,v) is the DCT coefficient in row k1 and column
International Journal of Emerging Technology and Advanced Engineering
Website: www.ijetae.com (ISSN 2250-2459, ISO 9001:2008 Certified Journal, Volume 8, Issue 3, March 2018)
iv. For most images, much of the signal energy lies at low frequencies; these appear in the upper left corner of the DCT.
v. Compression is achieved since the lower right values represent higher frequencies, and are often small - small enough to be neglected with little visible distortion.
vi. The DCT input is an 8 by 8 array of integers. This array contains each pixel's gray scale level.
vii. 8 bit pixels have levels from 0 to 255.
viii. Therefore an 8 point DCT would be: equation-(2).
B. Discrete Wavelet Transform (DWT)
[image:3.612.328.570.301.475.2]It is a Wavelet based transform [5] technique that can represent a signal with good resolution in time and frequency using a set of basis functions called wavelets. First the image is transform into the suitable format for image compression. Second, using filters divide the input image into four non-overlapping multi-resolution sub-bands LL, LH, HL and HH on the first level as shown in Figure-III.2 [1] i.e. applying low pass filter on rows to produce L and H sub-bands, then apply high pass filter on columns to produce four sub bands LL, LH, HL, and HH. Then, in the second level, each of these four sub-bands is self-decomposed into four sub bands LL2, LH2, HL2, HH2, and so on. It can be decomposed into 3, 4 . . . levels. The third step is quantification and coding of sub-bands used to reduce the number of bits needed to represent the image. This step will lower the quality of the image but better than DCT. The quality will depend on the value of the quantization used, here we used a quantization matrix. The forth step is arithmetic coding. It is a variable length coding. Finally data packets are created suitable for transmission over the wireless sensor network.
Figure III.2 Two level of decomposition of 2D-DWT
Generally, the wavelet transform can be expressed by the following equation:
* ( , )
( , )
( )
a b( )
F a b
f x
x dx
(3)Where the * is the complex conjugate symbol and function ψ is a special function that it obeys certain rules. C. Set Partitioning In Hierarchical Tree (SPIHT)
SPIHT [7] is wavelet based image compression algorithm that is very powerful and achieved very compact output bit stream. Implementing SPIHT [8] in power constrained WMSN isan advance choice as it has a higher compression ratio, less computational complexity, lower power consumption and less complex implementation over DCT. The following Figure-III.3 [17] shows the wavelet tree structure of SPIHT algorithm. We use the following function to indicate the significance of a set of coordinates defined in the SPIHT[10]:
,( , )
max { } 2
1, 0,
(
)
n i j
i j X
C
n others
S
X
Figure III.3 The wavelet tree structure for SPIHT algorithm
The above tree representation consists of the following sets:
O(i, j)=the set of coordinates of all offspring of node (i,j)
D(i, j)=the set of all coordinates that are descendants (all nodes that are below) of the node (i,j)
L(i,j) = the set of all coordinates that are descendants but not offspring of node (i,j)
[image:3.612.50.288.532.653.2]International Journal of Emerging Technology and Advanced Engineering
Website: www.ijetae.com (ISSN 2250-2459, ISO 9001:2008 Certified Journal, Volume 8, Issue 3, March 2018)
LIS:=List of Insignificant Sets, this list is one that shows us that our saving work by not accounting for all coordinates but just the relative ones.
LIP: = List of Insignificant Pixels, this list keeps track of pixels to be evaluated
LSP: =List of significant Pixels, this list keeps track of pixels already evaluated and need not be evaluated again.
To wavelet transform coefficients, SPIHT quantized more efficient that the quantized bit stream can achieve very good results, but not using arithmetic coding and can provide better bit distortion performance. For example: In the SPIHT algorithm, when sort of scanning to determine the important extent of the wavelet coefficients, must be accompanied there collection linked list. For the SPIHT algorithm, the sorting process of scanning, if the four roots nodes of the linked list LIP is not important, requires four bits to represent the importance. Can be seen, a very small coefficient of the linked list LIP can cause multiple bits transmission to represent the non-importance for several threshold, And may even require more bits to represent the wavelet coefficients of the successor node is non-important(Insignificant). Clearly, in the resulting bit stream, the information of non-important bit will occupy a large proportion, which will inevitably lead to decreased quality of image restoration (especially at low bitrates).
IV. PERFORMANCE EVALUATION OF THREE COMPRESSION
METHODS
We evaluate our work on Matlab simulator. The comparison will be very detailed depending on the results obtained through the PSNR values of the image for different algorithms. We evaluate three compression techniques in image processing applications. In this simulation Firstly, we compare three methods of compressing images by theoretically which are the Discrete Cosine Transform (DCT), Discrete Wavelet Transform (DWT) and SPIHT, then test their capability on wireless sensor networks (WSNs) through the Matlab simulator. Secondly, we execute performance evaluation and we compare the three methods in terms of image quality, execution and transmission time, packet loss and memory usage and finally energy consumption.
The experimental results in terms of quality are given in Figure-IV.4 of original image (Figure-IV.3) which represents image by DWT, DCT and SPIHT for different values of k (resolution). Obviously, even if the overall visual quality is good, as k decreases image distortion increases for both proposed methods.
Furthermore, as we can see in this Figure-IV.4, these methods provide different level of quality for large values of k (i.e., 2 and 8 here). On the other hand, for small values of k the DWT method offers a better performance than other two methods. To discuss energy consumption, we have assigned data transmission and data receiving energy for each node (in terms of jule). Then applying data centric routing protocol like directed diffusion to calculate the execution and transmission time, packet lost, memory usage, energy consumption and finally overall network lifetime. The following functions are used for performance analysis of image compression algorithms.
A. PSNR
The term peak signal-to-noise ratio (PSNR) is an mathematical expression for the ratio between the maximum possible value of a signal and the power of distorting noise that affects the quality of its representation. Because many signals have a very wide dynamic range. The PSNRis usually expressed in terms of the logarithmic decibel scale. PSNR is most commonly used to measure the quality of reconstruction of lossy compression images or codecs. The signal in this case is the original data and the noise is the error introduced by compression. When comparing compression codecs, PSNR is an approximation to human perception of reconstruction quality. PSNR is most easily defined via the mean squared error (MSE). Given a noise-free m×n monochrome image I and its noisy approximation K, MSE is defined as:
1 1
2
0 0
1
( , )
( , )
m ni j
MSE
I i j
K i j
mn
The PSNR (in dB) is defined as:
International Journal of Emerging Technology and Advanced Engineering
Website: www.ijetae.com (ISSN 2250-2459, ISO 9001:2008 Certified Journal, Volume 8, Issue 3, March 2018)
B. Compression ratio
Compression ratio (CR)[1] is a term that is being used to describe ratio of compressed output sequence length (b1) to uncompressed input length (b0) and measured with bits per pixel(bpp) as described in Eq. (3)
Compression ratio (CR)=
1
0
b
b
CR can be used to judge how compression efficiency is, as higher CR means better compression.
C. Directed diffusion
The basic idea of directed diffusion routing is to increase the survivability of networks, it may be necessary to use sub-optimal paths occasionally. To achieve this, multiple paths are found between source and destinations, and each path has a cost, depending on the cost metric. And each node has a data transmitting and receiving energy to create energy metric. The approach argues that using the minimum energy path all the time will deplete the energy of nodes on that path. Instead, one of the multiple paths is used, so that the whole network lifetime increases.
We consider a network of static energy constrained sensors that means all the nodes like source, sink and event are static. Assume that all nodes in the network are assigned with a unique Id(i.e. node number, x location and y location) and all nodes are participating in the network and forward the given data, the nodes within the routing zone are active and all other nodes are in sleep mode for their energy saving. Additionally, these sensor nodes have
limited processing power, storage and energy, while the
sinknodes have powerful resources to perform any tasks or
communicate with the sensor nodes.
The directed diffusion algorithm [18] is used for making a decision on which neighbor a sensor node should forward the data message. A node is selected to forward the data based on its energy level and signal strength. Ideally, the greater the energy in the node and farther the node from the previous one, is the more likely to be selected as the next hop. The nodes which are not selected in this process will move to the sleep state in order to conserve power. The protocol replies with a complete route from the source node
to the sink quickly, and prepares manyroute paths. It also
enables intermediate nodes to aggregate all the received packets during a short period time and transmit only one
aggregated packet to the following node. There are 3 main
phases in this protocol:
A. Interest propagation
The interest is broadcast by a sink through its neighbors. This process continues until gradients are setup from the source back to the sink. An interest message is query or which specifies what a user wants. Each interest’s message contains a description of data interested by a user. Typically, data in sensor networks is collected or processed information of a phenomena which matches an interest or a request of a user. Such data can be an event which is a short description of the sensed phenomenon. Initially the ―Cost‖ field is to zero for every node before sending the request.
CostND 0
Every intermediate node forwards the request only to the neighbors that are closer to the source node than oneself and farther away from the destination node. On receiving the request, the cost metric for the neighbor that sent the request is computed and is added to the total cost of the path. Thus, if the request is sent from node Ni to node Nj, Nj calculates the cost of the path as:
Cost( N j ,Ni) Cost( Ni) Metric( N j ,Ni)
In this way we calculate cost from source to sink.
B. Data propagation
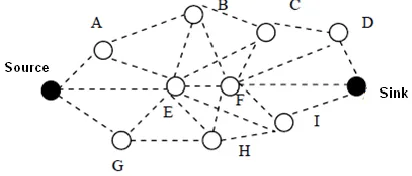
[image:5.612.337.543.549.637.2]After interest propagation, setup a gradient toward the sensor nodes from which it receives the interest. This process continues until gradients are setup from the source back to the base station. Hence, by utilizing interest and gradients, paths are established between sink and sources. Several paths can be established so that one of them is selected using reinforcement. After some time if a node die then it will be select another minimum energy consuming path for data propagation.
Figure IV.1 Gradient set-up between sink and source
International Journal of Emerging Technology and Advanced Engineering
Website: www.ijetae.com (ISSN 2250-2459, ISO 9001:2008 Certified Journal, Volume 8, Issue 3, March 2018)
Assume that the available energy at A is larger than at E and G, hence node A is selected to broadcast the message to the neighboring nodes. The process continues and node B which is selected sends out the broadcast message which is received by nodes F and C, it is found that both F and C have the same energy level, So both F and C start a back-off timer and if the back-back-off timer of node F ends before C an implicit acknowledgement is sent by node F which is also received by node C, and so node C stops its back-off timer as shown in Figure-IV.2. When the broadcast message reaches the target sink, then this is the minimum energy consuming path from source to sink. In my experiment we take 2jule for data transmission energy and 0.5jule for data receiving energy. In this way we create an energy metric i.e. energyMetric( N j ,Ni).Energy( N j ,Ni) be the total energy.
[image:6.612.366.533.131.266.2]Energy( N j ,Ni) Energy( Ni) energyMetric( N j ,Ni)
Figure IV.2 Minimum energy consuming path
C. Route maintenance
However, it is also possible to local repairof failed or affected paths. Causes for failure or degradation include node energy depletion and environmental factors affecting communication. For sensor nodes to minimize energy consumption in data communication to extend the lifetime of sensor networks. The data delivery ratios increase as the node density increases. When node density is high, there are more nodes available for data forwarding, and this increases the delivery ratio
D. Simulation Results
There are different images uses for experimentation; we choose for example a common image to do the different scenario.
Figure IV.3 Original image
[image:6.612.321.566.338.662.2]The reconstructed images after applying different image compression algorithms for different distance (d) among sensor nodes are given by Figure-IV.4.
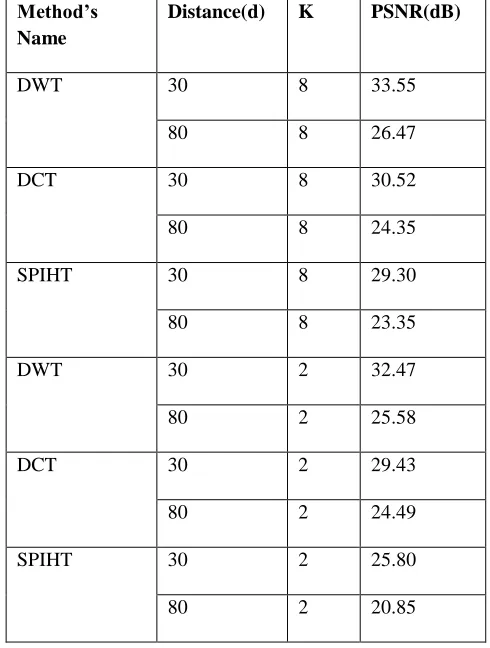
Table 1
PSNR comparison ratio for different image compression methods
Method’s Name
Distance(d) K PSNR(dB)
DWT 30 8 33.55
80 8 26.47
DCT 30 8 30.52
80 8 24.35
SPIHT 30 8 29.30
80 8 23.35
DWT 30 2 32.47
80 2 25.58
DCT 30 2 29.43
80 2 24.49
SPIHT 30 2 25.80
[image:6.612.68.261.345.427.2]International Journal of Emerging Technology and Advanced Engineering
Website: www.ijetae.com (ISSN 2250-2459, ISO 9001:2008 Certified Journal, Volume 8, Issue 3, March 2018)
DWT (PSNR=33.55dB PSNR=26.47dB)
DCT (PSNR=30.52dB PSNR=24.35dB)
SPIHT (PSNR= 29.30dB PSNR=23.35dB)
Figure IV.4 Reconstructed image at node distance 30m (left three fig.) & node distance 80m(right three fig)
[image:7.612.46.280.115.456.2]The above figure illustrates the obtained PSNR by varying nodes distance for 64x64 images. According to these figures and comparison table, images quality is better using DWT regardless of the distance(d) and resolution(k). For distances higher than 30m, a higher gap of PSNR values is obtained. Quality is also decreases when increasing distances between source and destination nodes.
Table 2 Performance analysis
DWT DCT SPIHT
Memory Requirements
High Low Moderate
Computational Load
High Low Low
Complexity Low Low Moderate
Power Consumption
Low Moderate Low
Compression Ratio
High Low High
Processing Speed High Lower than DWT
High
Reconstructed image quality
High(Good) Low High
Results(PSNR) 33.55dB for 64x64
30.52dB for 64x64
29.30dB for 64x64
International Journal of Emerging Technology and Advanced Engineering
Website: www.ijetae.com (ISSN 2250-2459, ISO 9001:2008 Certified Journal, Volume 8, Issue 3, March 2018)
There is a lot of literature based on discrete wavelet transform introducing an energy efficient technique for image compression in wireless sensor network. Ghorbel et al. in [15] proposed a performance analysis for image compression in WSN. They used DCT and DWT for their analysis and showed that DWT is better than DCT in terms of image quality and energy consumption. According to this figures, images qualities are better (for 64 * 64) using DWT with PSNR reached to 33.55 db, 30.52 db using DCT and 29.30 for SPIHT respectively. Implementing SPIHT [16] in power constrained WMSN is an excellent choice as it achieves a higher compression ratio, less computational complexity, lower power consumption and less complex implementation than DCT but nearly to DWT.
V. CONCLUSION &FUTURE WORK
In this paper we have proposed and evaluated three image compression methods dedicated to transmission over Wireless Multimedia Sensor Networks (WMSNs) using directed diffusion protocol in order to decrease the energy consumption of sensors and thus to maintain a long network lifetime. Image compression algorithms which are based on theDiscrete wavelet transform (DWT) have been widely recognized to be more prevalent than DCT and SPIHT. This is due to the wavelets' excellent spatial localization, frequency spread, and multi-resolution characteristics, which are similar to the theoretical models of the human visual system. Image quality, compression ratio, speed of compression and power consumption, memory requirement, computational load, processing speed are the most important metrics discussed for compression performance. Performance metrics differ according to operating platform. Wireless multimedia sensor networks have some limitations due to resource limitations like memory, power consumption, processor capabilities and life time of sensor nodes. In future, our work will be concerned by transposing these results to other fast implementation methods of the literature on real platform like TelosB mote or any new version of mote with NS2 simulator. Also adapting SPIHT for WMSN to reduce memory requirement is an important future research area.
Acknowledgement
The authors gratefully acknowledge the support from Department of Computer Science & Engineering, University of Kalyani, West Bengal, India.
REFERENCES
[1] H.Z.Eldin , M.A. Elhosseini, H.A. Ali, ―Image compression algorithms in wireless multimedia sensor networks: A survey‖, Ain Shams Engineering Journal 2015, p.481–490.
[2] F. Marcelloni et M. Vecchio. ―An Efficient Lossless Compression Algorithm for Tiny Nodes of Monitoring Wireless Sensor Networks‖. The Computer Journal 52(8), April 2009, pp 969-987. [3] Ian F. Akyildiz, T. Melodia, Kaushik R. Chowdhury. ―A survey on
wireless multimedia sensor networks‖. Journal Computer Networks: The International Journal of Computer and Telecommunications Networking, Volume 51, Issue 4, Inc . New York, NY, USA, United State, March 2007.
[4] L.W. Chew, L. M. Ang, K. P. Seng, ―Survey of Image Compression Algorithms in Wireless Sensor Networks‖, in Proc. of Int. Symp. onInformation Technology (ITSim 2008), August 2008.
[5] Said A, Pearlman WA. A new, fast, and efficient image codec based on set partitioning in hierarchical trees. IEEE Trans Circ Syst Video Technol 1996;6(3):243–50.
[6] Mammeri Abdelhamid, Hadjou Brahim, Khoumsi Ahmed. A survey of image compression algorithms for visual sensor networks. ISRN Sensor Networks 2012;2012:1–19.
[7] Mammeri A, Khoumsi A. Energy aware JPEG for visual sensor networks. University of Sherbrooke, Quebec, Canada.
[8] Said A, Pearlman WA. A new, fast, and efficient image codec based on set partitioning in hierarchical trees. IEEE Trans Circ Syst Video Technol 1996;6(3):243–50.
[9] Shapiro JM. Embedded image coding using zero trees of wavelet coefficients IEEE Trans Signal Process 1993;41(12):3445–62. [10] Khan E , Ghanbari M. Efficient SPIHT based embedded color image
coding[J ] . IEE Electronics Letters , 2001 ,37 :951-952.
[11] Yang SH , Chang YL , Chen HC. A digital watermarking scheme based on SPIHT coding[A] . 2001 IEEE International Conference on Multimedia & Expo ( ICME 2001) [C] . Tokyo , Japan , 2001. [12] Welstead, Stephen T. (1999). Fractal and wavelet image
compression techniques. SPIE Publication. pp. 155–156. ISBN 978-0-8194-3503-3.
[13] Raouf Hamzaoui, Dietmar Saupe (May 2006). Barni, Mauro, ed. "Fractal Image Compression". Document and image compression
(CRC Press) 968: 168–169. ISBN 9780849335563. Retrieved 5 April 2011.
[14] Taylor CN, Panigrahi D, Dey S. Design of an adaptive architecture for energy efficient wireless image communication. Lect Notes Comput Sci 2002:260–73.
[15] Ghorbel O, Ayedi W, Jmal MW, Abid M. Image compression in WSN: performance analysis. In: Communication technology (ICCT), 2012 IEEE 14th international conference; 2012. p. 1363–8. [16] Said A, Pearlman WA. A new, fast and efficient image codec based
on set partitioning in hierarchical trees. IEEE Trans Circ Syst Video Technol 1996;6(3):243–50
[17] Jianxiong Wang, Fuxia Zhang, Study of the Image Compression based on SPIHT Algorithm: International Conference on Intelligent Computing and Cognitive Informatics, 2010. p. 130-33.