Munich Personal RePEc Archive
A cross-national analysis of the relations
between school choice and effectiveness
differences between private-dependent
and public schools
Dronkers, Jaap and Avram, S
Maastricht Research School of Economics of Technology and
Organization (METEOR), Maastricht University - Research Center
for Education and Labour Market
November 2009
Online at
https://mpra.ub.uni-muenchen.de/23911/
A Cross-national Analysis of the Relations between School Choice and Effectiveness Differences between Private-Dependent and Public Schools 1
Jaap Dronkers & Silvia Avram
Maastricht University & European University Institute
Abstract
We apply propensity score matching to the estimation of differential school effectiveness between the publicly funded private sector and the public one, in a sample of 26 countries. This technique allows us to distinguish between school choice and school effectiveness processes and thus, to account for selectivity issues involved in the comparison of the two. Concerning school choice, we found two patterns: a choice of the upwardly mobile parents for private schools and a preference for segregation by (lower-) middle class parents. As regards school effectiveness, our results indicate that, after controlling for selectivity, a substantial advantage in reading achievement remains among students in publicly funded private schools in ten out of the 26 countries.
Keywords: school choice; school effectiveness; private-dependent and public schools; international comparison.
1. Introduction
The differences in scholastic achievement of public and private schools have been the topic of a large number of studies in the educational sciences, sociology and economics, mostly in the USA but also to some extent in Europe. Within this literature, a significant distinction emerges inside the private sector, namely between private-dependent (i.e. publicly financed) and private independent schools. The distinction is important for at least three reasons. Firstly, in many countries, especially in continental Europe, these two types of schools exist alongside each other and alongside public schools, often as an unintended outcome of the 19th century struggle
around school ownership and financing between the State and Church(es). Secondly, the functions that these types of schools fulfil can differ significantly, depending on the social, religious or ethnic groups that charter them. Thirdly, the distinction between public schools and private government-dependent schools also relates to current policy debates about the organization, provision and financing of collective goods like education.
influenced the discourse on the relation between public and private schools in Europe (especially in the UK and Scandinavia, where fully subsidized private schools were rare, but also in countries like Belgium, Germany, France and the Netherlands where subsidized private schools had been established long before the rise of the neoliberal discourse on the effectiveness of public and private schools).
Due to its implications for educational policy, any differential effectiveness between private and public schools constitutes an important research topic. The debate started with the study of Coleman, Hoffer & Kilgore (1982), who claimed that pupils attending Catholic schools in the USA achieved at higher levels than comparable students in the public sector. This study was the start of a huge and still ongoing debate and research in the USA on public and private schools, subsidized chartered schools, potential state subsiding of religious schools and parental school choice. Coleman and Hoffer (1987) and Bryk, Lee and Holland (1993) provided comprehensive follow-up studies. Meanwhile, Dronkers (2004) reviewed the empirical evidence of scholastic achievement differences among public, Catholic and Protestant schools in Europe.
A less clamorous line of debate on public and private schools is centered on the survival (or even the rise) of religious schools in continental Europe (but also in Australia). Despite the decreasing relevance of church and religion in daily life experienced by most European societies, religious schools have not dwindled away throughout Europe. On the contrary, the religious school sector in largely or increasingly secular states is either growing or strongly over-represented (France: Langouët and Leger 1994; Germany: Dronkers, Baumert & Schwippert, 2006; The Netherlands: Dijkstra, Dronkers & Karsten 2004). This holds not only for those societies where such religious schools were present traditionally (France, the old German Länder, The Netherlands) but also for those societies in which religious schools had been abolished during the communist regimes (like Hungary, see Dronkers & Robert, 2004). This trend might be explained by relating it to a possible higher teaching effectiveness of religious schools compared to public ones. Whereas religious schools might have abandoned or relegated the religious socialization of their pupils, they might still try to reach more non-cognitive educational goals that are valued by non-religious parents as well. A better educational administration, a stronger value-oriented community encompassing parents and schools and a more deliberate selection policy of religious schools might be the most important mechanisms in producing the higher average effectiveness of religious schools in Europe.
2. Public-private comparisons
Comparisons between the achievement of students in private and the public schools have been carried out mainly on a national basis. In the US, research based on the
Despite the prevalence of publicly funded private schooling in Europe, evidence on the extent to which private schools on the continent have been more or less effective in bringing about higher cognitive outcomes is relatively scarce. Nonetheless, some studies have indicated a potential advantage of attending a private-dependent or a religious school in Netherlands (Koopman and Dronkers 1994; Dijkstra, Dronkers et al. 1997; Sturm, Groenendijk et al. 1998), France (Langouët and Leger 1994) and Germany (Dronkers, Baumert et al. 2002; Dronkers and Hemsing 2005) on measures such as test scores, dropout and graduation rates. However, the private-dependent school advantage was far from straightforward (often depending in contextual circumstances) and often could not be replicated using different datasets. The analyses of the effectiveness differences between private and public schools are outside Europe and the USA more rare, although it is an emerging scientific literature in Latin-America (Somers, McEwan & Willms, 2004)
Although the differences in scholastic achievement between public and private-dependent schools are relevant for nearly all developed countries, little cross-national research has looked into these differences in a comparative way. Making use of the PISA 2000 survey, Dronkers & Robert (2008a; 2008b) have conducted a systematic comparison of the effectiveness of public, dependent and private-independent schools in 22 OECD countries. Their analysis has found that, albeit the larger part of the gross scholastic achievement differences between public and private-dependent schools can be explained by differences in their student intake and by the related differences in school composition, private government-dependent schools still have a higher net scholastic achievement in reading than comparable public schools with the same students, parents and social composition. Moreover, the private-dependent sector advantage was found to be universal, meaning that it was more or less equal in the various countries.
Dronkers & Robert (2008a; 2008b) also showed that the effects of private-dependent schools on educational performance deviate from those of private independent schools. This underlines that it is an error to lump private-dependent and private independent schools together as schools operating under comparable market-circumstances: positive and negative effect of both types will neutralize eachother (this mistake is made by for instance Vandenberghe & Robin (2004) in their analysis of the PISA 2000 data and by Somers, McEwan & Willms (2004) in their analysis of Latin-American private schools).
Another analysis of the same PISA 2000 data (Corten & Dronkers, 2006) suggests that private government-dependent schools are more effective for pupils from families with low levels of cultural possessions. They found no indication that private government-dependent schools were more favourable for children from higher social strata.
3. Unmeasured selectivity of school choice and school effectiveness
wealth, educational resources present at home, parental involvement in the pupil’s educational career, and so on (Coleman, Hoffer et al. 1982; Greeley 1982; Coleman and Hoffer 1987; Witte 2000; Yang and Kayaardi 2004; Goldring and Phillips 2008). More generally, when attendance of a school, whether public or private, is ‘free’ meaning both parental and school selection occur before a student can enrol, selectivity is always an issue. Wealthier, better informed, and better educated parents will presumably have an advantage in finding and in gaining access to the ‘best’ school for their child (Ball 1993; Ball, Bowe et al. 1995; Echols and Willms 1995; Ball 1997; Goyette 2008; Jarvis and Alvanides 2008).
Analyses in the school effectiveness tradition (Dronkers & Robert (2008a; 2008b) follow that tradition) assume that the measured parental and pupil variables will control for any selectivity induced by school choice processes. This assumption seems appropriate when comparing the effectiveness of public schools within and across countries, as most often public schools have fixed catchment-areas and involve virtually no parental school choice, aside from the indirect choice of residence.
But this assumption is questionable if it is applied to the choice between public and private schools, even in societies in which the choice between public and private government-dependent schools is hardly influenced by school fees (as in the Netherlands). A host of factors associated with parental and student background might be linked to both choice processes and outcomes, and this almost surely brings about unmeasured heterogeneity, which might or not might be solved by the measured parental and pupil variables. More generally, the fact that both parents and schools are relatively unconstrained in picking a school or a student amplifies self-selection problems.
To address the issue of selectivity, we propose a another approach, namely propensity score matching to explicitly disentangle school choice processes from school-effectiveness. In a first step, we estimate the likelihood of choosing a private-dependent school rather than a public one. The result assigns to each pupil a propensity score of choosing a private rather than a public school, based on the characteristics of the pupil, her parents and the features of the chosen school. The second step of the approach consists of estimating the effectiveness of non-public schools, based on a matched sample of pupils with similar propensities of choosing a private school but who nonetheless attended a public one.
In this article, we focus on the choice between public and private-dependent schools (private schools which get their financial resources mainly from the national, regional or local governments of their country) and on the corresponding differences in school effectiveness in the cognitive domain (reading)2.
4. Another approach to disentangle the relations between choice and effectiveness
To distinguish between school choice and school effectiveness processes, we employ a technique called propensity score matching.3 It has been used for several decades in
that the pupil will choose a private school. The propensity score is defined as follows (Rosenbaum & Rubin, 1983):
P(T) ≡ Pr {T = 1/S} = E{T/S}
where p(T) is the propensity of choosing a private school, T indicates that the pupil did or did not choose a private school (the treatment) and S is a vector of covariates influencing the private school choice.
The resulting propensity score is used to match4 pupils who did with those that
did not choose private schools, our treatment and control groups. Students in the treatment group that could not be matched based on their propensity score are discarded from subsequent analyses. The mean estimated difference in academic achievement between the matched treatment and control groups represents the effect of attending a private school on achievement for students with propensity scores within the range of the matched sample, i.e. the average treatment effect for the treated.
We want to stress that propensity score matching techniques are not a “magic bullet”. They only account well for selection if two assumptions are met. First, all observable variables influencing both the treatment – school choice - and the outcome – academic achievement- must be included in the propensity score model, i.e. there has to be conditional independence. Second, selection processes have to be captured well by variables predicting the propensity to experience the treatment of interest. But these issues arise no matter what method one uses, even the simplest. Thus, when comparing different modeling strategies, it is important to remember that every method has its own limitations. OLS regression analysis (which is most commonly used in school effectiveness analysis, multi-level models included) estimates the average treatment effect of private school attendance for the full sample when controlling for the other covariates. Propensity score matching restricts the available sample to treated and untreated cases that have comparable propensity scores. If there is no considerable overlap in the propensities of those in the treatment and the control group (like in most of our countries) the differences in educational achievement will not reflect the average treatment effect of attending a private school for the full sample, but only for a selective part, namely those pupils who have the possibility to actually choose a private school. From this perspective, the results of propensity score matching presented here should be seen as complementary to the earlier results, obtained through OLS regression.
The great advantage of using propensity scores lies in the fact that matching is performed on only one dimension instead of the all the variables on which the propensity score is computed (in this case, 15 pupil and school variables). Because of the large number of predictors, matching on all of the variables simultaneously would be virtually impossible. However, the same propensity score may result from very different values on the predictor variables entered in the logistic regression through which the propensity score is estimated.5 To account for this possibility, a more
highest parental occupational status, family wealth, immigration status and cultural possessions index). These five variables have been chosen based on theoretical considerations, i.e. they are thought to play a particularly important role in school choice selectivity (Ball 1993; Gorard 1999; Witte 2000). Eventually, the control case with the lowest Mahalanobis distance is chosen as a match. This type of matching allows for a greater weight to be assigned to the variables included in the Mahalanobis distance matching. Simultaneously, it ensures that pupils attending public schools match (as close as possible) pupils attending private-dependent schools not only on the propensity scores but also on the five social background variables on which the Mahalanobis distance is computed.
There are very few applications of propensity score matching in the study of the effects of private and public schools, but the first dates back more than 20 years and is used for the same topic: effectiveness differences between public and catholic schools in the USA (Hoffer, Greeley and Coleman, 1985; Morgan, 2001).
5. Data and Methods
Our analyses are carried out using the PISA survey. This dataset has the particular advantage of offering information both on school boards and funding sources. Thus, it enables the distinction between all of the three school types mentioned above, namely public, private government independent and private government dependent.6 Other
data-sets like TIMSS and PRILS allow only for the distinction between public and private schools and are, thus, less useful given the already established differences in effectiveness between private independent and private government-dependent schools (Dronkers & Robert, 2008a). We restrict ourselves in this article to the comparison between public and private-dependent schools.
Three waves of the PISA survey have been carried out so far, in 2000, 2003 and in 2006. Use has been made of all three waves by pooling them into one database.7 This strategy allows us to maximize the number of private-dependent
schools present in the database. We selected all the countries in Europe, other industrialized countries, Latin-America & Asia that have a minimum of 10 schools per category. We also delete all countries in which the private-dependent schools cater for less that 1 percent of the pupil population.8
We use only the score on the reading test as indicator of students’ indicator of his or her educational performance. The reading performance is measured in all the three waves fully, while the scores of the mathematic or sciences tests only partly or in fewer waves. Earlier analyses (compare the results of Dronkers & Robert (2008a) who use reading as indicator with Dronkers & Robert (2008b) who use math as indicator) have shown that the parameters of private and public schools do not vary substantially between these three indicators of educational performance.
The PISA data are cross-sectional data and they have no information about the length of the stay of the pupils at the current school, or about the characteristics of former schools of the students. This might lead to a misspecification of the effect of the characteristics of the current school, especially if all 15 year old pupils in a specific country have moved recently to another school.
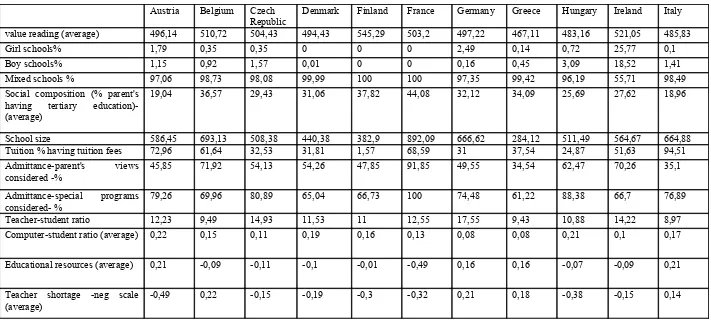
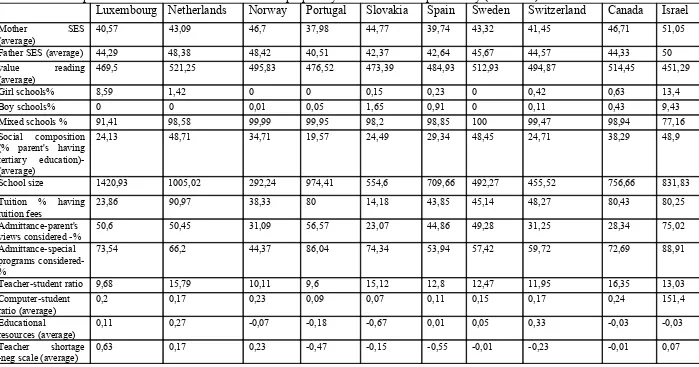
been incorporated to account for family background variation in the population of private and public schools. These students and parental characteristics were the most powerful in earlier analysis with the PISA data, while parental income (separate from household wealth) is not available in PISA. The school’s social composition (percentage of students having at least a parent with a university degree), the school’s size, its admission policies (whether it considers parental endorsement of the school’s educational philosophy and attendance of its special programs as criteria when admitting students), as well as variables related to the visible school’s resources, namely student-teacher ratios, computer-student ratios and a composite index of educational resources have been considered as potential factors influencing school choice on the school level. All of the included school characteristics are relatively visible to parents and therefore may play a role in shaping choice decisions. We did not include those school characteristics, which are less visible for parents (like teacher quality), because their role in the parental school choice process is random due to its unobservablity by parents. Finally, to gauge the potential deterrent effect that financial costs of attending a school might have, a tuition variable, i.e. whether the school charges or not tuition fees has been included.
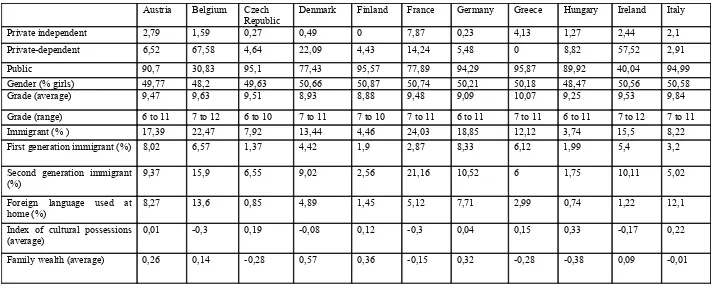
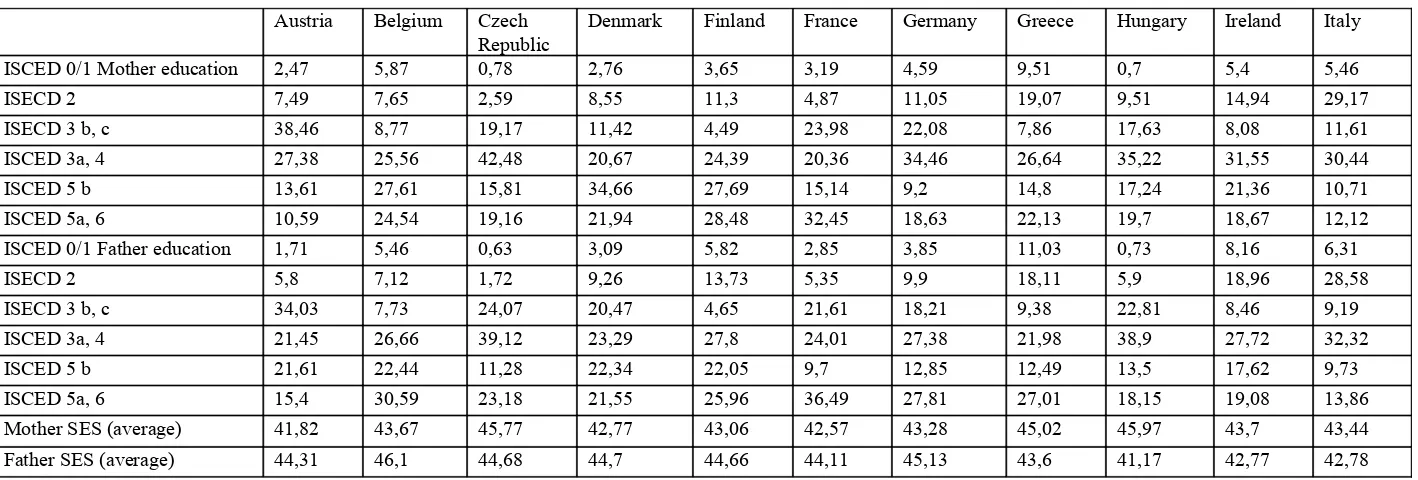
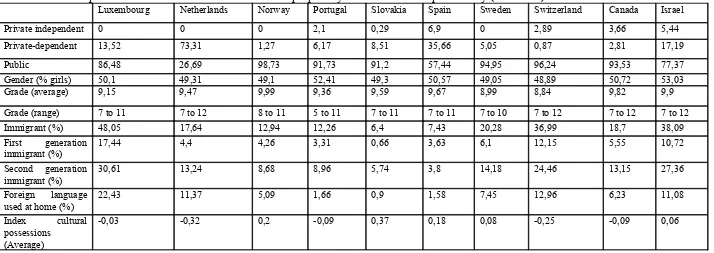
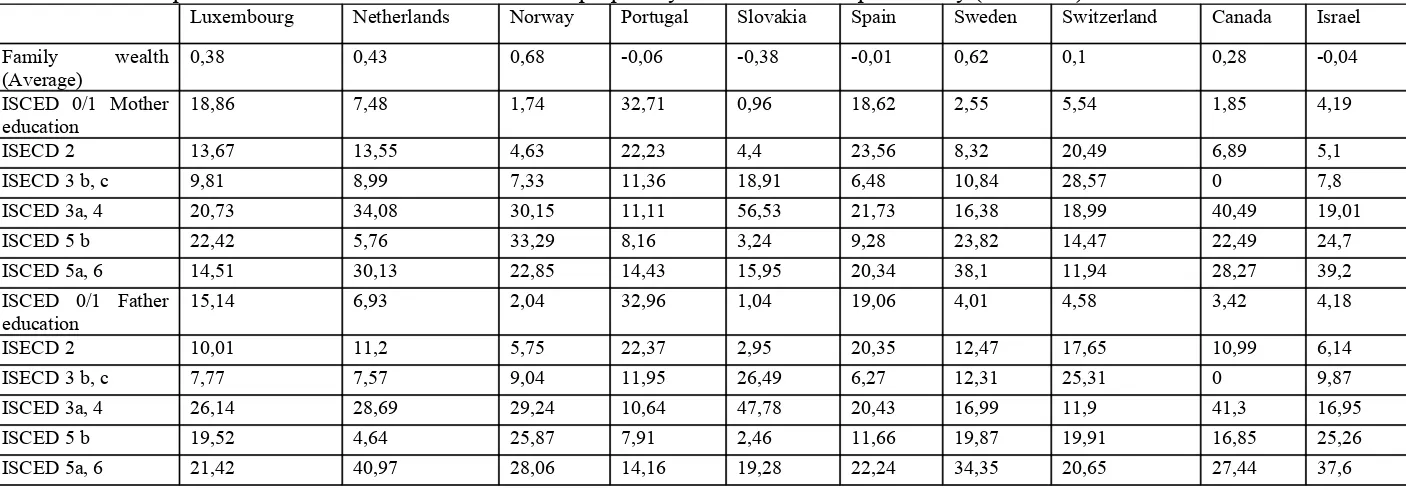
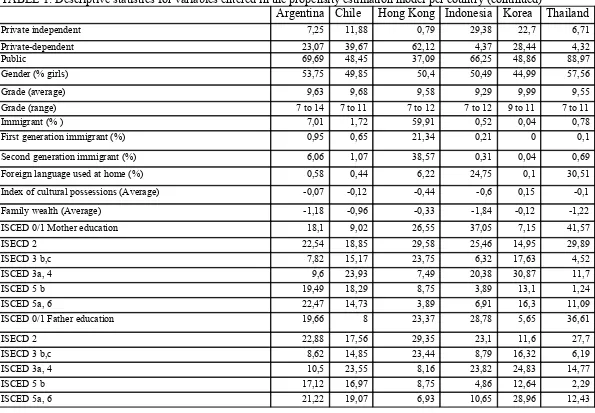
The characteristics of pupils, parents and schools of the countries with enough public and private-dependent schools are shown in table 1.
[About here table 1]
26 counties on four continents have enough public and private-dependent schools to be included in the analyses, although in some case, the private-dependent sector caters for a small percentage of all 15 year-olds (but always more than 1%).
6. Results for the choice of private-dependent schools versus public schools.
A set of 26 logistic regression equations including all the parent, pupil and visible school characteristics presented in section 5 has been used to predict the selection of a private-dependent school rather than a public one, for each country separately.
Table 2 shows the regression coefficients of these equations. Since we use multiple regressions that simultaneously include all of the predictors, the resulting coefficients can be interpreted as ‘net’ effects on the school choice.
[About here table 2]
The results indicate that, in general, the choice pattern between private-dependent and public schools differs across these 26 countries. Admission based on parents’ endorsement of the school’s philosophy is positively influencing the likelihood of choosing a private-dependent school in all countries, with the exception of Finland, Sweden and Indonesia. Parental endorsement figures in the admission policies of all private-dependent schools in France and Norway, therefore a coefficient could not be computed for this variable in these two countries. Admission policies based on participation in a special program are favouring the choice of a public school in nearly all countries, except in Belgium, the Netherlands, Sweden, Switzerland, Argentina, Chile, Indonesia where such policies increase the chance of a private-dependent school option.9 A high score on the socio-economic composition of
school except in France, the Netherlands, Norway, Portugal, Hong Kong, Indonesia, Korea and Thailand where it either has no effect or it actually increases the probability of a public school choice. A higher number of teachers per student in schools impacts positively10 on the likelihood of selecting a private-dependent school
only in Austria, Belgium, Czech Republic, Norway, but the same variable increases the odds of public school option in Germany, Hungary, Ireland, Portugal, Spain, Sweden, Switzerland, Canada, Argentina, Chile, Indonesia and Korea. The payment of tuition is positively associated with choice of a private-dependent school in most countries, but it clearly represents an obstacle to private school choice in France, Hungary, Italy and Portugal.
The gender of the pupil matters in the selection of a given school type in a substantial number of countries. Parents with a male child tend to choose private-dependent schools more often in Austria, Belgium, Czech Republic, Germany, Ireland, Luxembourg, Argentina, Korea and Thailand, while they will prefer a public school in Italy and Chile. Native parents11 choose more frequently private-dependent schools in
Belgium, Canada and Hong Kong, but they prefer public schools in Finland, France, Italy, Norway, Sweden and Indonesia. Interestingly, the mother’s educational level is positively related to choice of a public school in the Czech Republic Denmark, Germany, Ireland, Portugal, Sweden, Switzerland, Hong Kong and Indonesia, while the father’s educational level is hardly significant. The occupational status of both parents is positively related with the choice of a private-dependent school in Austria, Belgium, Czech Republic, Finland, Germany, Ireland, Luxembourg, Norway, Sweden, Canada and Hong Kong, but in Italy, the Netherlands and Korea higher parental occupational status is linked with the choice of a public school.
[About here figure 1]
Based on this huge variation in factors which affect the choice between public and private-dependent schools in the various countries, easy characterisations, such as choice always being driven by class, educational capital, fear of immigrants, wealth, school resources or selectivity, are simply misleading. In an attempt to systematize the variation in the effects of various pupil and school characteristics across countries, we have made use cluster analysis, using the country regression coefficients12 as input.
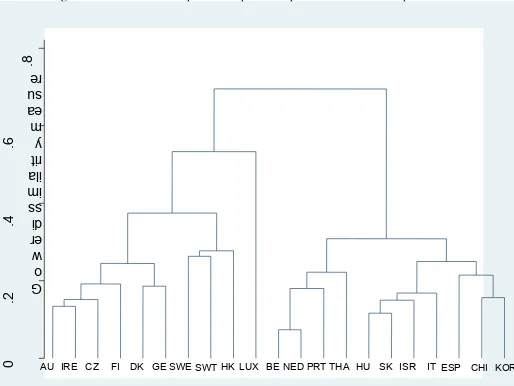
Figure 2 shows the country groupings that have emerged from the cluster analysis.13
Countries where coefficients are more similar are clustered closer together, while countries with more divergent coefficients are placed further away from each other. The cluster analysis suggests the existence of two clusters 14. The first cluster consists
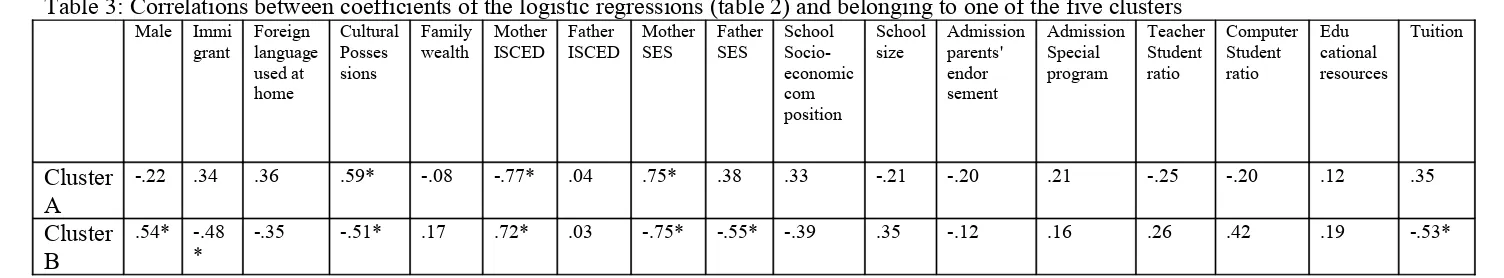
of Austria, Ireland, Czech Republic, Finland, Denmark, Germany, Sweden, Switzerland and Hong Kong. Table 3 shows that the private-dependent schools in these nine countries are chosen by pupils with more cultural possessions at home, lower educated mothers and mothers with higher occupational status. One might characterize the private-dependent school-choice in these countries as the choice of the upward mobile parents. The second cluster contains Belgium, the Netherlands, Portugal, Thailand, Hungary, Slovakia, Israel, Italy, Spain, Chile and Korea. Table 3 shows that the private-dependent schools in these eleven countries are chosen by male native pupils with less cultural possessions at home, higher educated mothers, parents with lower occupational status, and who are less likely to pay tuition. One might characterize the private-dependent school-choice in these countries as a choice for
[About here table 3]
The general conclusion of this section on the choice between private-dependent and public schools is that there is large variation between countries, much more than one might expect. Private-dependent school choice is not only or mostly based on opting for schools with the best teaching conditions (low student/staff ratio; a high socio-economic composition of the student body). It can also be driven by defensive motives (avoiding immigrants, lower tuition).
7. The effectiveness in reading achievement of private-dependent schools compared to that of public schools
In this section we present the results from the second step of the propensity score matching. We only compare pupils who have a more or less equal risks or propensities to go to a private-dependent versus a public school. We delete those pupils in private-dependent schools who have no comparable match among pupils in public schools. This leads to the loss of quite a large number of pupils in the sample, particularly in countries where the private-dependent sector is small or obviously skewed towards the better-off families.15 Table 4 summarizes the results of our
analyses and the number of matched pupils.
[About here table 4]
The first column gives the raw average difference in reading scores between pupils in private-dependent schools and public schools, without any control for covariates. Given the school-choice selectivity discussed in section 6, it is no surprise that the pupils of private-dependent schools in Austria, Belgium, Germany, Hungary, Ireland, Norway, Slovakia, Spain, Sweden, Switzerland, Canada, Argentina and Chile, have higher readings scores on average. Quite surprisingly though, pupils of private-dependent schools in Italy, Luxembourg, Hong Kong, Indonesia and Thailand score significantly lower compared to those in public schools. The second column gives the number of pupils involved in this simple comparison. Because these differences are not controlled for school-choice selectivity and parental background effects, they are not reflecting school effectiveness.
However, within a common range, the distributions of the propensity scores of pupils in private-dependent and public schools can be quite different and thus still produce biased results. Therefore, as a next step, we match each pupil attending a private-dependent school to one with a similar propensity score but attending a public school. Note that, the actual level of the propensity score is irrelevant for the making of the match, as long as the pupils of matched pair have the same propensity score (low or high), but attend different school types. This restriction strongly reduces the number of pupils/cases as can be seen in column 6, but the difference in reading score between the matched pupils (column 5) gives now a more valid indication of the true discrepancies in school effectiveness between private-dependent and public schools. The only significant positive differences in the reading score between pupils of private-dependent schools and public schools are registered in Belgium, the Czech Republic, Germany, Hungary, Ireland, Netherlands, Portugal, Canada, Argentina, and Chile. Pupils of private-dependent schools in Austria and Thailand score significantly lower than their counterparts in public schools. In the remaining countries the differences in the reading score between pupils of private-dependent schools and public schools is not significant. Note that this more strict control of the selectivity of school-choice changed the results for Austria (became negative), Czech Republic, Netherlands, Portugal (became positive), Italy, Luxembourg, Spain, Sweden, Hong Kong and Indonesia (became insignificant). This shows that controlling for the selectivity of school-choice is important for unmasking ‘true’ school effects.
Although propensity score matching has the advantage of requiring matching on only one dimension, i.e. the propensity score, it has the drawback that similar propensity scores can be the result of different combinations of parent, student and school characteristics. To further verify our results, we have used propensity score matching with Mahalanobis distance on a few key student background indicators. The Mahalanobis distance matching allows for a greater weight to be assigned to the variables on which the distance is computed. We chose to include five variables in the Mahalanobis distance computations, namely highest parental education, highest parental occupational status, family wealth, immigration status and cultural possessions index. This more refined analysis which combines matching on choice and additional controls for the five covariates (column 7) does not change the results much, compared with the analysis based on simple nearest neighbour propensity score matching (column 5). After applying this (stricter) form of control for school-choice induced selectivity, significant positive differences in the reading score between pupils of private-dependent and public schools persist in Belgium, Czech Republic, Germany, Hungary, Ireland, Portugal, Canada, Argentina, and Chile. Pupils of private-dependent schools in Finland, Italy, Korea and Thailand score significantly lower than pupils in public schools. In the remaining thirteen countries, the differences in reading scores between pupils of the two sectors are not significant. Note that different (stricter) method of control for the selectivity of school-choice changed the results for Austria and Netherlands (became insignificant), as well as for Finland, Italy and Korea (became negative).
Finally, no apparent relationship could be established between school choice and school effectiveness processes (Table 4). Both clusters derived based on the choice patterns contained countries with a more effective private-dependent sector, as well as countries where the public sector is more successful in raising the achievement outcomes of its pupils.
Propensity score matching can provide a useful tool to differentiate between the effects of school choice and those of school effectiveness. Making this distinction is crucial for a valid estimation of the school sector differentials in effectiveness, i.e. the gains in achievement that are brought about by the school itself rather than a consequence of its student intake.
The choice of private-dependent schools in these 26 countries varies by school characteristics, especially school composition, school-size, its admission criteria (both parental endorsement of the school’s values and participation in special programs), tuition payment and educational resources. We found two patterns of private- dependent school choice. The first one can be characterized as a choice of the upwardly mobile parents for private schools. The second one might be pictured as a preference for segregation by (lower-) middle class parents, through the use of the private-dependent sector.
We have also found large variation in school sector related effectiveness across countries. After having taken into account the differences between the dependent and public sectors generated by school choice processes, pupils at private-dependent schools in ten countries (Belgium, Czech Republic, Germany, Hungary, Ireland, Netherlands, Portugal, Canada, Argentina, and Chile) still achieved significantly higher than their counterparts in the public sector. Their observed higher reading scores cannot be explained by the school choice processes and this might be an indication of a higher effectiveness of private-dependent schools in these countries. However in Austria and Thailand (thus a small minority of the countries studied), pupils at private-dependent schools have lower reading scores than pupils in the public sector. Thus, in these two cases, the school choice processes hide the actual lower effectiveness of private-dependent schools, compared to the higher effectiveness of the public sector. Religious or ethnic motives might explain the parental preference for private-dependent schools, despite their lower effectiveness.
Our findings contradict neoliberal theories related to school choice and school effectiveness at least on two counts. On the one hand, we could not find any correlation, at the country level, between school choice and school effectiveness patterns. The lack of a choice-effectiveness link contradicts the existence of a universal consumer logic operating in school markets, whereby parents always choose the most effective schools for their children. In fact, in a number of countries parents chose to send their children to a private-dependent school despite the lower success of this type of schools in raising achievement.
On the other hand, we could not find any universal private-dependent schooling advantage. On the contrary, in the majority of the countries included in the analyses (Denmark, Finland, France, Italy, Luxembourg, Norway, Slovakia, Spain, Sweden, Switzerland, Israel, Hong Kong, Indonesia and Korea), we found no significant difference between the scores of pupils of private-dependent and public schools. These results also deviate from those of Dronkers & Robert (2008a; 2008b). They found, using a usual OLS multi-level regression containing corrections for student background variables and school composition, that private-dependent schools were more effective than public schools in all countries. This finding is not confirmed in this study, as higher achievement scores in the private-dependent sector emerged only for a (large) minority of the countries studied. However, our study contains a wider variation of countries than the range Dronkers and Robert (2008a) analyzed.
referring solely to the selectivity argument. Private-dependent schools remain significantly more effective than comparable public schools, in a substantial number of countries, even after complex adjustments and controls for their student intake.
Cross-national variation in both choice and effectiveness patterns related to the publicly funded private sector points to the potential role played by country specific institutional and social factors. Dissimilarities in the legal framework regulating the private-dependent schooling sector, as well as the general education system containing it, give rise to divergent opportunities and constraints to which private-dependent schools must adapt. In turn, the legal framework is often the result of prolonged social and political processes with deep historical roots. Also differences in religious and ethnic composition of public and private schools in the various countries, which we could not take into account, might explain these cross-national variation in choice and effectiveness. Moreover, in some countries, the cleavage between public and private-dependent schools might be deep for still relevant historical reasons, while in other countries students move now easily from public to private-dependent schools, or back.
Further cross-national analyses are needed to pinpoint the exact institutions and legacies that are involved in moulding both school choice and school effectiveness between the private and the public sectors.
Literature
Alexander, K. L. & Pallas, A. M. (1983). "Private Schools and Public Policy: New Evidence on Cognitive Achievement in Public and Private Schools." Sociology of Education
56(4): 170-182.
Ball, S. J. (1993). "Education Markets, Choice and Social Class: The Market as a Class Strategy in the UK and the USA." British Journal of Sociology of Education 14(1): 3-19.
Ball, S. J. (1997). "On the cusp: parents choosing between state and private schools in the UK: action within an economy of symbolic goods." International Journal of Inclusive Education
1(1): 1-17.
Ball, S. J., Bowe, R., et al. (1995). "Circuits of schooling: A sociological exploration of parental choice of school in social class contexts." Sociological Review 43(1): 52-78.
Bryk, A. S., Lee, V. E. & Holland, P. B. (1993). Catholic schools and the common good.
Cambridge (Mass.)/ London: Harvard University Press.
Chubb J. E & Moe T. M. (1990) Politics, Markets and America's Schools. Washington DC: Brookings Institution Press.
Coleman, J.S. & Hoffer, T. (1987). Public and private high schools. The impact of communities. New York: Basic Books.
Coleman, J. S., Hoffer, T. B. & Kilgore, S. (1982). High school achievement: Public, Catholic and other private schools compared. New York: Basic Books.
Corten, R. & Dronkers, J. (2006). "School Achievement of Pupils From the Lower Strata in Public, Private Government-Dependent and Private Government-Independent Schools: A cross-national test of the Coleman-Hoffer thesis." Educational Research and Evaluation 12:179-208.
Dehejia, R.& Sadek, W. (2002). “Propensity score matching methods for non-experimental causal studies.” Review of Economics and Statistics, 84: 151-161.
Dijkstra, A. B., J. Dronkers, et al. (1997). Verzuiling in het onderwijs. Actuele verklaringen en analyse. Groningen, Wolters-Noordhoff.
Dijkstra, A., Dronkers, J. & Karsten, S. (2004). "Private Schools as Public Provision for Education: School Choice and market Forces in the Netherlands." pp. 67-90 in Educating Citizens. International Perspectives on Civic Values and School Choice, edited by P. J. Wolf & S. Macedo. Washington DC: Brookings Institute Press.
Dronkers, J., (2004). "Do Public and Religious Schools Really Differ? Assessing the European Evidence." pp. 287-314 in Educating Citizens. International Perspectives on Civic Values and School-choice, edited by P. J. Wolf & S. Macedo. Washington DC: Brookings Institution Press.
Dronkers, J., Baumert J. & Schwippert, K. (2006). "Are German non-public secondary schools more effective in reaching cognitive and non-cognitive educational goals." International Journal for Educational Law and Policy 2:4-14.
Dronkers, J. & Hemsing, W. (2005). "Differences in Educational Attainment and Religious Socialization of Ex-Pupils from Grammar Schools with Public, Catholic, Protestant, and Private Backgrounds in the German State of Nordrhein-Westfalen during the 1970s and 1980s." International Journal of Educational Policy, Research, & Practice 5: 73-93.
Dronkers, J. & Robert, P. (2008a). "Differences in Scholastic Achievement of Public, Private Government-Dependent and Private-independent Schools: A Cross-National Analysis."
Educational Policy 22:541-577.
Dronkers, J. & Robert, P. (2008b). "School Choice in the Light of the Effectiveness Differences of Various Types of Public and Private Schools in 19 OECD Countries." Journal of School Choice 2:260-301.
Echols, F. H. & Willms, J. D. (1995). "Reasons for School Choice in Scotland." Journal of Education Policy10(2): 143-156.
Frisco, M. J., Muller, C. & Frank, F., (2007) “Parents’ Union Dissolution and Adolescents’ School Performance: Comparing Methodological Approaches” Journal of Marriage and Family 69: 721–741
Gamoran, A. (1996). "Student Achievement in Public Magnet, Public Comprehensive, and Private City High Schools." Educational Evaluation and Policy Analysis 18(1): 1-18.
Godwin, R. K. & Kemerer, F. R. (2002) School Choice Tradeoffs. Liberty, Equity, and Diversity. Austin: University of Texas Press.
Goldring, E. B. & Phillips, K. J. R. (2008). "Parent preferences and parent choice: the public-private decision about school choice." Journal of Education Policy23(3): 209-230.
Gorard, S. (1999). "Planning Ahead in a 'Market' for Schools: Predicting Patterns of School Choice." Evaluation and Research in Education13(3): 132-143.
Goyette, K. (2008). "Race, Social Background, and School Choice Options." Equity & Excellence in Education 41(1): 114-129.
Greeley, A. M. (1982). Catholic High Schools and Minority Students. New Brunswick, Transaction Books.
Hoffer, T. B. (1998). "Social Background and Achievement in Public and Catholic High Schools." Social Psychology of Education2(1): 7-23.
Hoffer, T., Greeley, A. M. & Coleman, J. S. (1985). Achievement Growth in Public and Catholic Schools. Sociology of Education, 58, 74-97.
Jarvis, H. & Alvanides, S. (2008). "School choice from a household resource perspective: Preliminary findings from a north of England case study." Community, Work & Family 11(4): 385-403.
Jeynes, W. (2002). "Educational Policy and Effects of Attending a Religious School on the Academic Achievement of Children." Educational Policy16(3): 406-424.
Koopman, P. & Dronkers, J. (1994). "De effectiviteit van algemeen bijzondere scholen in het algemeen voortgezet onderwijs." Pedagogische Studiën71(6): 420-441.
Langouët, G. & Léger, A. (1994). École publique ou école privée? Trajectoires et réussites scolaires. Paris: Editions Fabert.
Morgan, S. L. (2001). Counterfactuals, causal effect heterogeneity, and the Catholic school effect on learning. Sociology of Education, 74, 341-374.
Morgan, S. L. & Winship, C. (2007). Counterfactuals and Causal Inference. Methods and Principles for Social Research. New York, Cambridge University Press.
Neal, D. (1997). "The Effects of Catholic Secondary Schooling on Educational Achievement." Journal of Labor Economics15(1): 98-123.
Noell, J. (1982). "Public and Catholic Schools: A Reanalysis of "Public and Private Schools"" Sociology of Education55(2-3): 123-132.
Ramirez, F. O. & Boli, J. (1987). "The political construction of mass schooling: European origins and worldwide institutionalization." Sociology of Education 60:2-17.
Sammons, P., Hillman. J. & Mortimore, P..(1995) Key characteristics of effective schools: A review of school effectiveness research. London: Office for Standards in Education and Institute of Education.
Scheerens, J. & Bosker, R. (1997). The Foundations of Educational Effectiveness.
Kidlington/New York/Toyko: Pergamon.
Somers, M.-A., McEwan, P.J. & Willms, J. D. (2004) How Effective Are Private Schools in Latin America? Comparative Education Review, 48, (1): 48-69
Sturm, J., L. Groenendijk, et al. (1998). "Educational Pluralism- a historical study of so-called 'pillarization' in the Netherlands, including a comparison with some developments in South African education." Comparative Education 34 (3): 281-297.
Teddlie, C.& Reynolds, D. (2000). The international handbook of school effectiveness research. London: Falmer.
Vandenberghe, V. & Robin, S. (2004). "Evaluating the effectiveness of private education across countries: a comparison of methods" Labour Economics 11: 487-506.
Willms, J. D. (1985). "Catholic-School Effects on Academic Achievement: New Evidence From the High School and Beyond Follow-up Study." Sociology of Education 58(2): 98-114.
Witte, J. F. (2000). The Market Approach to Education. An Analysis of America's First Voucher Program. Princeton, New Jersey, Princeton University Press.
Yang, P. and N. Kayaardi (2004). "Who choses non-public schools for their children?"
Figure 1: Clusters of choice patterns of private-dependent schools versus public school
Source: pooled data PISA dataset for 2000, 2003 and 2006. Au=Austria; Be=Belgium; CHI=Chile; CZ=Czech Republic; DK=Denmark; ESP=Spain; FI=Finland; GE=Germany; HK=Hong Kong; ISR=Israel; IT=Italy; IRE=Ireland; KOR= Korea; LUX=Luxembourg; NED=Netherlands; PRT=Portugal; SK= Slovakia; SWE= Sweden; SWT= Switzerland; THA=Thailand;
0
.2
.4
.6
.8
G
o
w
er
di
ss
im
ila
rit
y
m
ea
su
re
TABLE 1: Descriptive Statistics for variables entered in the propensity estimation model per country
Austria Belgium Czech
Republic
Denmark Finland France Germany Greece Hungary Ireland Italy
Private independent 2,79 1,59 0,27 0,49 0 7,87 0,23 4,13 1,27 2,44 2,1
Private-dependent 6,52 67,58 4,64 22,09 4,43 14,24 5,48 0 8,82 57,52 2,91
Public 90,7 30,83 95,1 77,43 95,57 77,89 94,29 95,87 89,92 40,04 94,99
Gender (% girls) 49,77 48,2 49,63 50,66 50,87 50,74 50,21 50,18 48,47 50,56 50,58
Grade (average) 9,47 9,63 9,51 8,93 8,88 9,48 9,09 10,07 9,25 9,53 9,84
Grade (range) 6 to 11 7 to 12 6 to 10 7 to 11 7 to 10 7 to 11 6 to 11 7 to 11 6 to 11 7 to 12 7 to 11
Immigrant (% ) 17,39 22,47 7,92 13,44 4,46 24,03 18,85 12,12 3,74 15,5 8,22
First generation immigrant (%) 8,02 6,57 1,37 4,42 1,9 2,87 8,33 6,12 1,99 5,4 3,2
Second generation immigrant (%)
9,37 15,9 6,55 9,02 2,56 21,16 10,52 6 1,75 10,11 5,02
Foreign language used at home (%)
8,27 13,6 0,85 4,89 1,45 5,12 7,71 2,99 0,74 1,22 12,1
Index of cultural possessions (average)
0,01 -0,3 0,19 -0,08 0,12 -0,3 0,04 0,15 0,33 -0,17 0,22
TABLE 1: Descriptive statistics for variables entered in the propensity estimation model per country (continued)
Austria Belgium Czech
Republic
Denmark Finland France Germany Greece Hungary Ireland Italy
ISCED 0/1 Mother education 2,47 5,87 0,78 2,76 3,65 3,19 4,59 9,51 0,7 5,4 5,46
ISECD 2 7,49 7,65 2,59 8,55 11,3 4,87 11,05 19,07 9,51 14,94 29,17
ISECD 3 b, c 38,46 8,77 19,17 11,42 4,49 23,98 22,08 7,86 17,63 8,08 11,61
ISCED 3a, 4 27,38 25,56 42,48 20,67 24,39 20,36 34,46 26,64 35,22 31,55 30,44
ISCED 5 b 13,61 27,61 15,81 34,66 27,69 15,14 9,2 14,8 17,24 21,36 10,71
ISCED 5a, 6 10,59 24,54 19,16 21,94 28,48 32,45 18,63 22,13 19,7 18,67 12,12
ISCED 0/1 Father education 1,71 5,46 0,63 3,09 5,82 2,85 3,85 11,03 0,73 8,16 6,31
ISECD 2 5,8 7,12 1,72 9,26 13,73 5,35 9,9 18,11 5,9 18,96 28,58
ISECD 3 b, c 34,03 7,73 24,07 20,47 4,65 21,61 18,21 9,38 22,81 8,46 9,19
ISCED 3a, 4 21,45 26,66 39,12 23,29 27,8 24,01 27,38 21,98 38,9 27,72 32,32
ISCED 5 b 21,61 22,44 11,28 22,34 22,05 9,7 12,85 12,49 13,5 17,62 9,73
ISCED 5a, 6 15,4 30,59 23,18 21,55 25,96 36,49 27,81 27,01 18,15 19,08 13,86
Mother SES (average) 41,82 43,67 45,77 42,77 43,06 42,57 43,28 45,02 45,97 43,7 43,44
TABLE 1: Descriptive statistics for variables entered in the propensity estimation model per country (continued)
Austria Belgium Czech
Republic
Denmark Finland France Germany Greece Hungary Ireland Italy
value reading (average) 496,14 510,72 504,43 494,43 545,29 503,2 497,22 467,11 483,16 521,05 485,83
Girl schools% 1,79 0,35 0,35 0 0 0 2,49 0,14 0,72 25,77 0,1
Boy schools% 1,15 0,92 1,57 0,01 0 0 0,16 0,45 3,09 18,52 1,41
Mixed schools % 97,06 98,73 98,08 99,99 100 100 97,35 99,42 96,19 55,71 98,49
Social composition (% parent's having tertiary education)-(average)
19,04 36,57 29,43 31,06 37,82 44,08 32,12 34,09 25,69 27,62 18,96
School size 586,45 693,13 508,38 440,38 382,9 892,09 666,62 284,12 511,49 564,67 664,88
Tuition % having tuition fees 72,96 61,64 32,53 31,81 1,57 68,59 31 37,54 24,87 51,63 94,51
Admittance-parent's views
considered -%
45,85 71,92 54,13 54,26 47,85 91,85 49,55 34,54 62,47 70,26 35,1
Admittance-special programs considered- %
79,26 69,96 80,89 65,04 66,73 100 74,48 61,22 88,38 66,7 76,89
Teacher-student ratio 12,23 9,49 14,93 11,53 11 12,55 17,55 9,43 10,88 14,22 8,97
Computer-student ratio (average) 0,22 0,15 0,11 0,19 0,16 0,13 0,08 0,08 0,21 0,1 0,17
Educational resources (average) 0,21 -0,09 -0,11 -0,1 -0,01 -0,49 0,16 0,16 -0,07 -0,09 0,21
Teacher shortage -neg scale (average)
TABLE 1: Descriptive statistics for variables entered in the propensity estimation model per country (continued)
Luxembourg Netherlands Norway Portugal Slovakia Spain Sweden Switzerland Canada Israel
Private independent 0 0 0 2,1 0,29 6,9 0 2,89 3,66 5,44
Private-dependent 13,52 73,31 1,27 6,17 8,51 35,66 5,05 0,87 2,81 17,19
Public 86,48 26,69 98,73 91,73 91,2 57,44 94,95 96,24 93,53 77,37
Gender (% girls) 50,1 49,31 49,1 52,41 49,3 50,57 49,05 48,89 50,72 53,03
Grade (average) 9,15 9,47 9,99 9,36 9,59 9,67 8,99 8,84 9,82 9,9
Grade (range) 7 to 11 7 to 12 8 to 11 5 to 11 7 to 11 7 to 11 7 to 10 7 to 12 7 to 12 7 to 12
Immigrant (%) 48,05 17,64 12,94 12,26 6,4 7,43 20,28 36,99 18,7 38,09
First generation
immigrant (%)
17,44 4,4 4,26 3,31 0,66 3,63 6,1 12,15 5,55 10,72
Second generation immigrant (%)
30,61 13,24 8,68 8,96 5,74 3,8 14,18 24,46 13,15 27,36
Foreign language used at home (%)
22,43 11,37 5,09 1,66 0,9 1,58 7,45 12,96 6,23 11,08
Index cultural
possessions (Average)
TABLE 1: Descriptive statistics for variables entered in the propensity estimation model per country (continued)
Luxembourg Netherlands Norway Portugal Slovakia Spain Sweden Switzerland Canada Israel
Family wealth
(Average)
0,38 0,43 0,68 -0,06 -0,38 -0,01 0,62 0,1 0,28 -0,04
ISCED 0/1 Mother education
18,86 7,48 1,74 32,71 0,96 18,62 2,55 5,54 1,85 4,19
ISECD 2 13,67 13,55 4,63 22,23 4,4 23,56 8,32 20,49 6,89 5,1
ISECD 3 b, c 9,81 8,99 7,33 11,36 18,91 6,48 10,84 28,57 0 7,8
ISCED 3a, 4 20,73 34,08 30,15 11,11 56,53 21,73 16,38 18,99 40,49 19,01
ISCED 5 b 22,42 5,76 33,29 8,16 3,24 9,28 23,82 14,47 22,49 24,7
ISCED 5a, 6 14,51 30,13 22,85 14,43 15,95 20,34 38,1 11,94 28,27 39,2
ISCED 0/1 Father education
15,14 6,93 2,04 32,96 1,04 19,06 4,01 4,58 3,42 4,18
ISECD 2 10,01 11,2 5,75 22,37 2,95 20,35 12,47 17,65 10,99 6,14
ISECD 3 b, c 7,77 7,57 9,04 11,95 26,49 6,27 12,31 25,31 0 9,87
ISCED 3a, 4 26,14 28,69 29,24 10,64 47,78 20,43 16,99 11,9 41,3 16,95
ISCED 5 b 19,52 4,64 25,87 7,91 2,46 11,66 19,87 19,91 16,85 25,26
TABLE 1: Descriptive statistics for variables entered in the propensity estimation model per country (continued)
Luxembourg Netherlands Norway Portugal Slovakia Spain Sweden Switzerland Canada Israel
Mother SES
(average)
40,57 43,09 46,7 37,98 44,77 39,74 43,32 41,45 46,71 51,05
Father SES (average) 44,29 48,38 48,42 40,51 42,37 42,64 45,67 44,57 44,33 50
value reading
(average)
469,5 521,25 495,83 476,52 473,39 484,93 512,93 494,87 514,45 451,29
Girl schools% 8,59 1,42 0 0 0,15 0,23 0 0,42 0,63 13,4
Boy schools% 0 0 0,01 0,05 1,65 0,91 0 0,11 0,43 9,43
Mixed schools % 91,41 98,58 99,99 99,95 98,2 98,85 100 99,47 98,94 77,16
Social composition (% parent's having tertiary education)-(average)
24,13 48,71 34,71 19,57 24,49 29,34 48,45 24,71 38,29 48,9
School size 1420,93 1005,02 292,24 974,41 554,6 709,66 492,27 455,52 756,66 831,83
Tuition % having tuition fees
23,86 90,97 38,33 80 14,18 43,85 45,14 48,27 80,43 80,25
Admittance-parent's views considered -%
50,6 50,45 31,09 56,57 23,07 44,86 49,28 31,25 28,34 75,02
Admittance-special programs considered- %
73,54 66,2 44,37 86,04 74,34 53,94 57,42 59,72 72,69 88,91
Teacher-student ratio 9,68 15,79 10,11 9,6 15,12 12,8 12,47 11,95 16,35 13,03
Computer-student ratio (average)
0,2 0,17 0,23 0,09 0,07 0,11 0,15 0,17 0,24 151,4
Educational resources (average)
0,11 0,27 -0,07 -0,18 -0,67 0,01 0,05 0,33 -0,03 -0,03
Teacher shortage
-neg scale (average)
TABLE 1: Descriptive statistics for variables entered in the propensity estimation model per country (continued)
Argentina Chile Hong Kong Indonesia Korea Thailand
Private independent 7,25 11,88 0,79 29,38 22,7 6,71
Private-dependent 23,07 39,67 62,12 4,37 28,44 4,32
Public 69,69 48,45 37,09 66,25 48,86 88,97
Gender (% girls) 53,75 49,85 50,4 50,49 44,99 57,56
Grade (average) 9,63 9,68 9,58 9,29 9,99 9,55
Grade (range) 7 to 14 7 to 11 7 to 12 7 to 12 9 to 11 7 to 11
Immigrant (% ) 7,01 1,72 59,91 0,52 0,04 0,78
First generation immigrant (%) 0,95 0,65 21,34 0,21 0 0,1
Second generation immigrant (%) 6,06 1,07 38,57 0,31 0,04 0,69
Foreign language used at home (%) 0,58 0,44 6,22 24,75 0,1 30,51
Index of cultural possessions (Average) -0,07 -0,12 -0,44 -0,6 0,15 -0,1
Family wealth (Average) -1,18 -0,96 -0,33 -1,84 -0,12 -1,22
ISCED 0/1 Mother education 18,1 9,02 26,55 37,05 7,15 41,57
ISECD 2 22,54 18,85 29,58 25,46 14,95 29,89
ISECD 3 b,c 7,82 15,17 23,75 6,32 17,63 4,52
ISCED 3a, 4 9,6 23,93 7,49 20,38 30,87 11,7
ISCED 5 b 19,49 18,29 8,75 3,89 13,1 1,24
ISCED 5a, 6 22,47 14,73 3,89 6,91 16,3 11,09
ISCED 0/1 Father education 19,66 8 23,37 28,78 5,65 36,61
ISECD 2 22,88 17,56 29,35 23,1 11,6 27,7
ISECD 3 b,c 8,62 14,85 23,44 8,79 16,32 6,19
ISCED 3a, 4 10,5 23,55 8,16 23,82 24,83 14,77
ISCED 5 b 17,12 16,97 8,75 4,86 12,64 2,29
Mother SES (average) 43 33,82 38,04 33,96 41,18 33,34
FATHER SES (average) 41,86 38,69 38,9 34,16 44,37 34,72
value reading (Average) 403,48 432,18 525,45 377,15 536,61 429,48
Girl schools% 1,76 7,16 11,6 0,56 35,32 2,95
Boy schools% 1,2 5,48 5,29 1,44 18,4 0,41
Mixed schools % 97,03 87,36 83,11 98 46,28 96,65
Social composition (% parent's having tertiary education)-average
31,15 24,27 8,15 13,08 31,3 15,18
School size 631,4 1092,53 1046,02 635,55 1198,09 1687,19
Tuition % having tuition fees 78,74 85,57 89,51 61,22 98,99 46,76
Admittance-parent's views 67,06 62,65 82,33 72,8 40,27 80,39
Admittance-special programs 83,9 77,41 69,22 77,28 60,25 89,26
Teacher-student ratio 10,2 26,91 18,28 18,49 17,72 22,49
Computer-student ratio 80,9 51,68 4,97 19,25 0,25 1,8
Educational resources -0,03 -0,16 0,02 -0,58 0,16 -0,1
Teacher shortage (neg scale) -0,58 0,19 -0,07 0,96 -0,49 0,66
Table 2: The coefficients of the logistic regression predicting the choice of a private-dependent school relative to a public school per country, including tuition. Regression coefficients Gender Immigra nt Foreign language used at home Cultural possessio ns Family wealth Mother ISCED Father ISCED Mother SES Father SES School-soc composit ion School size Admissi on-parents' endorse ment Admissi on- special program Student-teacher ratio Compute r-student ratio Educatio nal resources Tuition EUROPE
Austria -0,906* (0,112) 0,275 (0,161) 0,400 (0,226) 0,018 (0,063) -0,024 (0,071) -0,032 (0,050) -0,023 (0,047) 0,009* (0,004) 0,006 (0,004) 2,17* (0,314) -0,001* (0,0002) 2,415* (0,132) -0,826* (0,176) -0,121* (0,022) -3,686* (0,600) 0,128* (0,052) 3,553* (0,236) Belgium -0,113*
(0,043) -0,683* (0,054) 0,541* (0,072) 0,045 (0,024) 0,072* (0,030) 0,013 (0,019) 0,022 (0,019) 0,002* (0,001) 0,001 (0,001) 0,761* (0,149) 0,0015* (0,000) 1,478* (0,050) -0,082 (0,050) -0,024* (0,008) 0,763* (0,184) 0,319* (0,024) 0,620* (0,043) Canada -0,068 (0,087) -0,177 (0,118) -0,515* (0,230) -0,064 (0,050) -0,020 (0,063) -0,053 (0,047) 0,038 (0,043) 0,007* (0,003) 0,008* (0,003) 5,710* (0,285) -0,003* (0,0001) 3,006* (0,115) -1,031* (0,116) 0,110* (0,015)
-10, 63* (0,658) 0,933* (0,045) Dropped ‡ Czech Republic -0,230* (0,098) 0,281 (0,174) 0,101 (0,592) 0,055 (0,056) 0,089 (0,059) -0,149* (0,063) -0,097 (0,060) 0,004 (0,004) 0,012* (0,004) 1,172* (0,268) -0,007* (0,0003) 1,498* (0,131) -0,470* (0,148) -0,108* (0,015) -2,866* (0,563) 0,119* (0,051) 2,510* (0,109)
Denmark -0,177 (0,110) 0,311 (0,199) -0,437 (0,376) 0,219* (0,061) -0,038 (0,067) -0,125* (0,053) 0,008 (0,054) 0,010* (0,004) -0,005 (0,004) 0,989* (0,318) -0,002* (0,0003) 2,245* (0,152) -0,910* (0,166) 0,030 (0,026) 2,617* (0,508) 0,198* (0,069) 5,246* (0,124) Finland -0,084
(0,102) 0,015 (0,262) 1,503* (0,363) -0,015 (0,061) 0,060 (0,075) -0,073 (0,044) 0,020 (0,043) 0,006* (0,003) 0,004 (0,003) 4,002* (0,332) 0,002* (0,0003) -1,149* (0,124) 1,531* (0,160) -0,248* (0,035) -12,88* (1,022) 0,364* (0,064) 2,749* (0,214)
France 0,076 (0,136) -0,047 (0,176) 0,942* (0,316) 0,145 (0,075) -0,022 (0,102) -0,045 (0,063) -0,013 (0,060) -0,0007 (0,004) -0,002 (0,005) 0,319 (0,492) -0,0001 (0,0001) Dropped † Dropped † -0,020 (0,031) 1,200 (0,783) 0,180* (0,075) -0,219* (0,142)
Germany -0,806* (0,112) 0,156 (0,187) -0,370 (0,387) 0,217* (0,066) 0,345* (0,071) -0,106* (0,052) -0,078 (0,050) 0,003 (0,004) 0,014* (0,003) 2,312* (0,344) -0,0003 (0,0002) 4,012* (0,251) -1,117* (0,235) 0,062* (0,014) 5,539* (0,874) 0,143* (0,053) 2,229* (0,112) Hungary -0,137
(0,089) 0,135 (0,207) -1,585 (1,052) 0,056 (0,057) -0,032 (0,062) 0,089 (0,050) 0,054 (0,054) -0,002 (0,003) -0,0007 (0,003) 1,858* (0,249) -0,003* (0,0002) 1,806* (0,103) -0,163 (0,`139) 0,102* (0,010) -1,063* (0,285) 0,203* (0,054) -0,408* (0,100) Ireland -0,477*
(0,065) -0,017 (0,091) -0,149 (0,332) 0,043 (0,035) 0,121* (0,045) -0,096* (0,026) 0,018 (0,024) 0,012* (0,002) 0,005* (0,002) 3,456* (0,267) -0,004* (0,0002) 1,546* (0,087) -1,957* (0,090) 0,094* (0,013) -21,97* (0,888) -0,294* (0,034) 1,708* (0,068)
Italy 0,353*
(0,111) 0,342* (0,167) 0,333* (0,148) -0,115 (0,068) 0,025 (0,079) 0,018 (0,048) -0,004 (0,048) 0,0002 (0,004) -0,014* (0,004) 2,224* (0,401) -0,004* (0,0003) 1,348* (0,124) -0,662* (0,131) 0,006 (0,020) 0,846* (0,268) 0,149* (0,057) -2,975* (0,122) Luxembourg -1,769* (0,202) 0,612* (0,175) -0,292 (0,231) -0,023 (0,084) -0,152 (0,100) -0,013 (0,053) -0,088 (0,057) 0,005 (0,005) 0,016* (0,006) 2,794* (0,753) -0,010* (0,0005) 7,527* (0,420) -8,054* (0,539) 0,024 (0,078) -23,28* (2,220) -0,804* (0,104) 5,560* (0,334)
Netherlands -0,112 (0,058) -0,464* (0,082) 0,011 (0,111) 0,040 (0,034) 0,034 (0,042) 0,003 (0,022) -0,012 (0,022) -0,005* (0,002) -0,003 (0,002) -0,393* (0,185) 0,0000 (0,0000) 1,343* (0,069) 0,085 (0,067) -0,005 (0,008) 1,226* (0,457) 0,244* (0,031) 0,230* (0,095) Norway 0,390
(0,249) 1,309* (0,371) -0,163 (604) 0,949* (0,175) -0,424* (0,169) -0,071 (0,130) -0,111 (0,136) 0,004 (0,009) 0,034* (0,009) -8,475* (0,938) 0,005* (0,001) Dropped ‡ Dropped ‡ -0,264* (0,078) 3,049* (1,022) -1,415* (0,163) 4,001* (0,672) Portugal 0,154
Slovakia -0,018 (0,090) -0,031 (0,181) -0,638 (0,750) -0,049 (0,059) 0,299* (0,067) -0,042 (0,054) -0,020 (0,052) -0,001 (0,003) -0,0000 (0,003) 2,494* (0,249) -0,004* (0,0003) 1,492* (0,091) -0,584* (0,101) -0,013 (0,016) -5,768* (0,967) 0,359* (0,068) -0,384* (0,147)
Spain 0,094
(0,078) -0,231 (0,157) -0,169 (0,361) -0,020 (0,048) 0,027 (0,056) 0,029 (0,027) -0,027 (0,027) 0,0036 (0,003) -0,004 (0,003) 0,577* (0,265) -0,001* (0,000) 1,631* (0,107) -1,245* (0,105) 1,267* (0,025) 11,090* (0,484) 0,151* (0,041) 3,310* (0,091) Sweden -0,177
(0,111) 0,732* (0,148) 0,306 (0,240) 0,266* (0,061) -0,174* (0,074) -0,154* (0,047) 0,004 (0,044) 0,014* (0,003) 0,012* (0,004) 4,478* (0,384) -0,020* (0,0005) -1,718* (0,152) 0,762* (0,137) 0,191* (0,015) 0,511 (0,356) 0,395* (0,067) -0,197 (0,128) Switzerland -0,330
(0,167) -0,236 (0,206) 0,013 (0,333) 0,295* (0,093) -0,154 (0,116) -0,236* (0,074) 0,108 (0,069) 0,009 (0,006) -0,010 (0,006) 2,382* (0,525) -0,0007* (0,0002) 0,598* (0,189) 2,033* (0,359) 0,090* (0,014) 0,061 (0,233) -0,230* (0,079) 2,123* (0,217)
OTHER INDUSTRIALIZED COUNTRIES
Canada -0,068 (0,087) -0,177 (0,118) -0,515* (0,230) -0,064 (0,050) -0,020 (0,063) -0,053 (0,047) 0,038 (0,043) 0,007* (0,003) 0,008* (0,003) 5,710* (0,285) -0,003* (0,0001) 3,006* (0,115) -1,031* (0,116) 0,110* (0,015)
-10, 63* (0,658) 0,933* (0,045) Dropped ‡ Israel -0,072 (0,105) 0,013 (0,110) -0,389 (0,200) 0,139* (0,063) -0,481* (0,067) -0,016 (0,057) -0,028 (0,051) 0,001 (0,004) -0,004 (0,003) 2,871* (0,294) -0,001* (0,0001) 0,143 (0,130) -0,336* (0,156) -0,012 (0,013) -0,008 (0,020) 0,124* (0,052) 0,270 (0,159) LATIN AMERICA
Argentina -0,626* (0,167) 0,233 (0,336) 0,760 (1,004) -0,164 (0,100) 0,232* (0,107) 0,090 (0,057) 0,094 (0,057) -0,003 (0,005) -0,002 (0,006) 6,365* (0,615) -0,009* (0,0006) 2,537* (0,279) -0,565 (0,322) 0,306* (0,024) 18,323* (2,896) -0,064 (0,072) Dropped ‡
Chile 0,178*
(0,076) -0,124 (0,294) -1,423 (0,774) 0,099* (0,047) 0,239* (0,053) 0,027 (0,032) -0,041 (0,031) 0,001 (0,003) 0,005 (0,003) 2,617* (0,329) -0,001* (0,000) 0,680* (0,104) 0,225* (0,097) 0,074* (0,006) 19,362* (1,636) -0,201* (0,038) 1,942* (0,126) ASIA
Hong Kong -0,074 (0,058) -0,147* (0,062) -0,193 (0,124) 0,335* (0,036) -0,007 (0,047) -0,307* (0,026) -0,226* (0,025) 0,019* (0,002) 0,012* (0,002) -2,223* (0,319) -0,0006* (0,0002) 0,047 (0,085) -1,664* (0,080) -0,019 (0,018) 3,935* (0,456) 0,521* (0,029) 1,760* (0,099) Indonesia -0,087
(0,152) Dropped ‡ 1,264* (0,404) -0,040 (0,089) -0,131 (0,076) -0,114* (0,061) -0,052 (0,060) 0,006 (0,007) 0,004 (0,007) -2,294* (1,024) -0,010* (0,0006) -0,578* (0,204) 1,301* (0,225) 0,112* (0,013) -0,006 (0,033) -0,363* (0,052) 2,735* (0,182) Korea -0,302*
(0,062) 0,058 (1,421) -2,170 (1,139) 0,036 (0,036) 0,053 (0,043) 0,030 (0,027) -0,008 (0,026) -0,009* (0,002) 0,0002 (0,002) -1,230* (0,220) -0,001* (0,0000) 0,946* (0,095) -0,094 (0,066) 0,129* (0,019) -1,192* (0,211) 0,063 (0,034) 3,727* (0,718) Thailand -0,256*
(0,095) -1,078 (1,017) 0,145 (0,110) -0,090 (0,051) 0,366* (0,054) 0,012 (0,043) -0,185* (0,043) 0,005 (0,005) 0,002 (0,004) -4,098* (0,449) 0,0005* (0,0000) 0,505* (0,150) -0,387* (0,175) -0,007 (0,009) 3,226* (0,944) 0,007 (0,041) 0,895* (0,102) Regression coefficients Gender Immigra nt Foreign language used at home Cultural possessio ns Family wealth Mother ISCED Father ISCED Mother SES Father SES School-soc composit ion School size Admissi on-parents' endorse ment Admissi on- special program Student-teacher ratio Compute r-student ratio Educatio nal resources Tuition
Table 3: Correlations between coefficients of the logistic regressions (table 2) and belonging to one of the five clusters
Male Immi
grant
Foreign language used at home
Cultural Posses sions
Family wealth
Mother ISCED
Father ISCED
Mother SES
Father SES
School Socio-economic com position
School size
Admission parents' endor sement
Admission Special program
Teacher Student ratio
Computer Student ratio
Edu cational resources
Tuition
Cluster A
-.22 .34 .36 .59* -.08 -.77* .04 .75* .38 .33 -.21 -.20 .21 -.25 -.20 .12 .35
Cluster B
.54* -.48
*
-.35 -.51* .17 .72* .03 -.75* -.55* -.39 .35 -.12 .16 .26 .42 .19 -.53*
Table 4: Effect of attending a private-dependent school vs. a public school on reading achievement Cluster
Simple reading score difference between private and public schools pupils
No of observed pupils
Reading score difference within the common
range of
propensity scores of private and public school pupils
No of observed pupils
Reading score difference of the private- nearest public school neighbour in propensity scores
No of pupils (private/ public)
Reading score difference of the private –public school pupils based on nearest neighbour and Mahalanibis distance
No of pupils (private/ public)
EUROPE
Austria A 19,39 (3,70)*** 7838 13,47 (3,73)*** 6488 -16,13 (7,51)* (627/389) -8,14 (6,79) (627/417) Belgium B 39,21 (1,63)*** 13560 38,64 (1,63)*** 13420 27,31 (2,83)*** (9684/ 3735) 24,82 (2,64)*** (9684/ 2529) Czech
Republic
A
Switzerland A 20,25 (6,63)** 15893 11,25 (6,62) 11034 -8,19 (9,96) (158/152) -2,32 (9,52) (158/155)
OTHER INDUSTRIALIZED
Canada 48,63 (2,92)*** 21606 46,21 (2,94)*** 14702 35,86 (6,14)*** (823/ 543) 31,60 (5,83)*** (823/556) Israel B 4,42 (4,68) 2462 3,96 (4,72) 2449 1,38 (7,83) (571/ 377) 5,44 (7,27) (571/ 400)
LATIN AMERICA
Argentina 54,33 (4,14)*** 2011 52,95 (5,33)*** 1178 83,36 (17,29)*** (694/ 168) 24,76 (11,23)* (694/203) Chile B 37,01 (2,85)*** 3718 31,05 (2,96)*** 3470 15,18 (6,14)* (1751/ 747) 23,03 (4,48)*** (1751 / 836)
ASIA
Hong Kong A -8,77 (1,73)*** 7872 -7,02 (1,77)*** 7704 -5,76 (3,75) (5120/ 1255) -4,39 (3,11) (5120/ 1341) Indonesia -29,32 (3,91)*** 4099 -9,92 (4,15)* 1924 -15,36 (7,93) (298/ 170) 0,15 (7,47) (298/ 187) Korea B -2,36 (2,31) 5034 -1,54 (2,33) 4932 -6,44 (3,43) (2073/ 1172) -6,45 (3,15)* (2073/ 1265) Thailand B -23,63 (3,30)*** 11196 -22,60 (3,37) *** 11009 -31,71 (4,72)*** (510/ 462) -21,39 (4,58)*** (510/ 454)
1This article is one of the products of the cross-national project „Religious education in a multicultural society: School
and home in comparative context”, directed by Emer Smith (Economic & Social Research Institute, Dublin) and financed by the European Commision within the 7th Frame Work (FP7-SSH-2007-1- REMC).
2 In subsequent studies, we will compare the choice/effectiveness gaps between public and private-independent schools,
as well as compare school effects concerning student attitudes on environmental issues and school climate. 3
We use for the description of this technique the article of Frisco, Muller & Frank (2007), who use this technique in their analysis of the effects of parental divorce on children’s well-being.
4 We use nearest neighbour and nearest neighbour with Mahalanobis distance matching;
5
Normally, this should not be a big problem; see Morgan & Winship (2007)
6 The PISA survey does not distinguish between denominational and non-denominational schools.
7 We could only use the first PISA wave for France, because the public data set of the second and third PISA wave do
not contain valid values for French public and private school indicator. We have to assume that this private-public distinction has become a state-secret, too annoying for the secular French Republic to be published.
8
There were too few charter schools in the USA (which are considered by PISA as private-dependent schools) to be included.
9 While this admission based on programs is necessary for all French and Norwegian private-dependent schools.
10
This is a negative coefficient in table 2, because the variable is the student-teacher ratio. 11
Based on country of birth of (one of) the parents outside the country of birth and/or the foreign language used at home.
12
Given the different measurement scales of variables, we multiplied the coefficient by the existing range in the sample to compute a maximum effect; also-the analysis uses the Gower measure and the Ward’s method of clustering;
13 We had to delete from the cluster analysis those countries (Argentina, Canada, France, Indonesia, Norway) for which
not all parameters are available. 14
Luxembourg is clearly a separate case, which has a few in common with the two clusters.
15 Information about the characteristics of the matched treated and control pupils and their parents is available from the