A NEURAL NETWORK FILTER TO ESTIMATE THE DOA OF
SMALL TARGETS
1LUO YANLING
1Asstt Prof., Department of information Engineering,
Chongqing university of science and technology , Chongqing, China
E-mail: [email protected],
ABSTRACT
Support vector machines (SVMs) are a set of related supervised learning methods used for classification and regression. In this paper, this method is applied into the oil-spills detection task in net radar which is a hot topic recently. It can achieve better detection performance than conventional phased radar. In this paper, the net radar signal model is studied. And then, the SVM is employed to detect oil spill in sea. At last, conclusion is drawn, in addition, some item for future research in presented.
Keywords: Support Vector Machine, signal processing, target detection, oil spill
1. INTRODUCTION
Net radar is a novel radar technique developed recently [1] which is divided into two kinds. One kind of net radar refers to as collated antenna net radar[2], the other kind of net radar is widely separated antenna net radar[3] which is also called multi-static net radar. For the first kind of net radar, Fishler[4] aimed at building the multi-static net radar to counter target’s RCS-fluctuating and improve the detection performance; Berkerman[5] proposed net radar can forming narrow beam; Fishler[6] verified that the CRB of MIMO radar is better than conventional phased radar.
While coding and signal processing are key elements to successful implementation of a net system, the communication channel represents a major component that determines system performance. A considerable volume of work has been performed to characterize communication channels for general wireless applications. However, because net systems operate at an unprecedented level of complexity to exploit the channel space-time resources, a new level of understanding of the channel space-time characteristics is required to assess the potential performance of practical multi-antenna links.
The second kind of net radar is widely researched [7,8,9]. In this kind of net radar, antennas transmit orthogonal signals. But the antennas are not separated widely as in first kind net radar. Usually, the distance between antennas is half of the wavelength. As it has been researched, the kind of
net radar has many advantages such as high resolution, low intercept probability etc. In this paper, we investigate the signal model and signal processing of the collated antenna net radar (in this paper, it is refer to as net radar). Then a simulation platform is founded to testify the advantage of net radar and some simulation result is presented.
This paper is organized as follows. First, signal model and signal processing of net radar are introduced in Section 2. Then the Support Vector Machine is described in section 3. In section 4, SVM is applied into signal processing in net-radar. Finally, some conclusions are drawn.
2. PROBLEM FORMULATION
It is assumed that the radar transmit array is composed of L1×L2 antennas. In net radar model,
the array is divided into L2 arrays. Each
sub-array has L1 antennas which transmits signal with
t
p power. The array is shown in figure 1.Contrarily, in conventional phased radar, each antenna send the same signal.
Figure 1 the antennas configuration
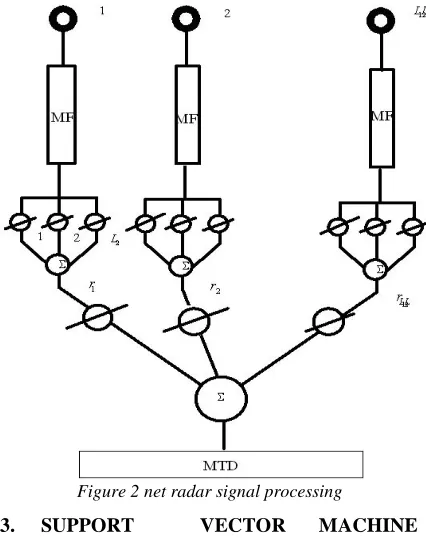
frequency of each send signal. The target echo is the sum of all transmitting signal. So, it includes all the send signal components. Processed by the match filters, each signal component is separated. Each transmit signal is obtained now. Those separated signals are multiplied by a coefficient and then sum up. This is equivalent to DBF at both transmitter and receiver.
[image:2.612.90.303.244.513.2]And then, the moving target detection (MTD) is employed to find the velocity of the target. At last, the constant false alarm is used to detect the target. This flow is demonstrated in figure 2.
Figure 2 net radar signal processing
3. SUPPORT VECTOR MACHINE
METHOD
Oil spill pollution is a major environmental threat for many countries in the world, which can cause serious damage to marine environment. On the other hand, Support Vector Machine (SVM) was first heard in 1992, introduced by Boser, Guyon, and Vapnik in COLT-92. Support vector machines (SVMs) are a set of related supervised learning methods used for classification and regression. They belong to a family of generalized linear classifiers. In another terms, Support Vector Machine (SVM) is a classification and regression prediction tool that uses machine learning theory to maximize predictive accuracy while automatically avoiding over-fit to the data. Support Vector machines can be defined as systems which use hypothesis space of a linear functions in a high dimensional feature space, trained with a learning
algorithm from optimization theory that implements a learning bias derived from statistical learning theory. Support vector machine was initially popular with the NIPS community and now is an active part of the machine learning research around the world. SVM becomes famous when, using pixel maps as input; it gives accuracy comparable to sophisticated neural networks with elaborated features in a handwriting recognition task. It is also being used for many applications, such as hand writing analysis, face analysis and so forth, especially for pattern classification and regression based applications.
The foundations of Support Vector Machines (SVM) have been developed by Vapnik and it gains popularity due to many promising features such as better empirical performance. The formulation uses the Structural Risk Minimization (SRM) principle, which has been shown to be superior, to traditional Empirical Risk Minimization (ERM) principle, used by conventional neural networks. SRM minimizes an upper bound on the expected risk, where as ERM minimizes the error on the training data. It is this difference which equips SVM with a greater ability to generalize, which is the goal in statistical learning. SVMs were developed to solve the classification problem, but recently they have been extended to solve regression problems.
In radar technique, Synthetic aperture radar (SAR) has become a valuable tool for marine oil spill monitoring, because of its all-weather and all-day capabilities. However, interpretation of marine SAR imagery is often ambiguous, and some other look-alike features often pose a fundamental challenge to the identification of oil spills and make the discrimination between oil spills and the look-alikes become a necessary procedure. This offers a good opportunity to reflect on key developments in the area during the past decade and also outline emerging trends.
excellent contributions from some of the world’s leading experts in the respective subjects.
The channel sounding process is then described for a specific narrowband MIMO system operating at 2.45 GHz and three representative indoor propagation scenarios. Useful plots of channel magnitude, phase, and capacity distributions are provided. This part will be especially useful for practicing engineers interested in channel sounding. We then discuss common simplified random matrix models of the MIMO wireless channel and their statistical properties. Going beyond the commonly assumed Rayleigh model, the chapter also explores geometric discrete scattering models and statistical cluster models, including an extension of the well-known Saleh–Valenzuela model. Parsimonious MIMO channel models facilitate system design, for they enable preliminary performance assessment via simulation. A comparison of capacity distributions obtained from measured versus model-based synthesized channels is included, and the impact of angle, polarization, and mutual coupling on channel capacity are illustrated.
In this paper, co-occurrence matrix method is employed to extract textural features of marine SAR image first, then these features are analyzed and optimized, and then Support Machine Vector (SVM) method is used to identify oil spills in SAR images. Experiments on several SAR images show that method proposed in this paper can improve the detection and identification of oil spill in SAR images. Among the many types of space-time codes, the class of orthogonal space-time block codes (OSTBCs)is special in many ways. It includes the celebrated 2×1 Alamouti code, which was instrumental in the development of the area, and quickly made it all the way to standards and actual systems. Orthogonal space-time block codes have numerous desirable properties, not the least of which is simple linear optimal decoding. By Gharavi-Alkhansari, Gershman, and Shahbazpanahi, covers both basic and advanced aspects of OSTBCs, with notable breadth and timeliness. The exposition is built around certain key properties of OSTBCs. For example, the fact that OSTBCs yield an orthogonal equivalent mixing matrix irrespective of the MIMO channel matrix (so long as the latter is not identically zero) enables a remarkably general performance analysis, even for non separable constellations. The chapter also covers important recent developments in the area, such as blind channel estimation for OSTBC-coded systems, and multiuser interference mitigation in the same context. OSTBCs have numerous desirable features,
but other linear space-time block codes may be preferable if the goal is to maximize the information rate. Early designs of the latter kind were based on maximizing ergodic capacity. Since diversity was not explicitly accounted for in those designs, the resulting codes could not guarantee full diversity.
4. OIL-SPILLS DETECTION IN NET-SAR
RADAR IMAGES BY SVM
SVM is a classification method derived from statistical learning theory and can provide good classification results from complex and noisy data. One of the theoretical advantages of SVM over other machine learning algorithms such as decision trees and neural networks is that it is designed to search for an optimal solution to a classification problem whereas others are designed to find a solution, which may or may not be optimal.
Firstly, working with neural networks for supervised and unsupervised learning showed good results while used for such learning applications. MLP’s uses feed forward and recurrent networks. Multilayer perceptron (MLP) properties include universal approximation of continuous nonlinear functions and include learning with input-output patterns and also involve advanced network architectures with multiple inputs and outputs.
There can be some issues noticed. Some of them are having many local minima and also finding how many neurons might be needed for a task. And all these can determine whether optimality of that NN is reached. Another thing to note is that even if the neural network solutions used tends to converge, this may not result in an unique solution. There are many linear classifiers (hyper planes) that separate the data. However, only one of these achieves maximum separation. The reason we need is that if we use a hyper plane to classify, it might end up closer to one set of datasets compared to others and we do not want this to happen and thus we see that the concept of maximum margin classifier or hyper plane as an apparent solution. The next illustration gives the maximum margin classifier example which provides a solution to the above mentioned problem.
local minima and better classification. Now we try to express the SVM mathematically and for this tutorial, we try to present a linear SVM. The goals of SVM are to separate the data with hyper plane and extend this to non-linear boundaries using kernel trick. For calculating the SVM, we see that the goal is to correctly classify all the data. In this equation x is a vector point and w is weight and vector. So to separate the data [a] should always be greater than zero. Among all possible hyper planes, SVM selects the one where the distance of hyper plane is as large as possible. If the training data is good and every test vector is located at radius r from training vector. Now if the chosen hyper plane is located at the farthest possible from the data. This desired hyper plane which maximizes the margin also bisects the lines between closest points on convex hull of the two datasets.
5. SIGNAL PROCESSING STEPS IN NET
RADAR SYSTEM
The configuration of net radar based on transmitting diversity is depicted in Figure 3. Now consider an net system with M transmit elements (or sub-arrays) and N receiving elements (or sub-arrays), transmitting orthogonal waveforms
1( ), 2( ), , M( )
S t S t S t
( )
M
S t SM−1( )t
φ
sin
d φ
( )
N
X t XN−1( )t
1( )
S t X t1( )
Figure 3The configuration of net Radar
Assuming narrow signals (this is not a necessary requirement, but simplifies the discussion) and isotropic elemental radiators, the aggregate waveform incidents upon any target can be represented as
1 1
( ) ( )
M
m m
m
q t β S t τ
=
=
∑
−(1)
Where, m (m 1) sind c
θ
τ = − ,
d
is the delay timefrom the transmit to the target. β1is the attenuate
factor, which is same for all transmitter. Then, the summation of all waveform is
1 1
( ) ( ) ( )
M
m m m
p t α S tα θ
=
=
∑
(2)
Where, θ is the target direction of arrival, α θm( ) is the transmit response vector of mth element.
The wave is reflected back to antenna. The n-th subarray received waveform is then
2 2
( )
(
)
( )
jnn n
x t
=
α
⋅
p t
−
τ
=
α
⋅
p t e
−φ(3)
Where, n 2 sin ( 1)
d n
π θ
φ
λ
= − . α2 is the sum of
the propagation attenuation and scatter coefficient, the received signal vector is then
2
( )t =α ⋅b( )θ ⋅p t( )+ ( )t
X V
(4)
Where,
1 2
( 1)
1 2
( ) [ ( ), ( ), , ( )]
( ) [1, , , ]
[ ( ), ( ), , ( )]
T N
j j N T
T N
t x t x t x t
b e e
v t v t v t
φ φ
θ − − −
= = =
X
V(t)
It is assumed that the radar transmit array is composed of L1×L2 antennas. In net radar system,
the array is divided into L2 arrays. Each
sub-array has L1 antennas which transmits signal with
t
p power.
The l sub-array transmit signal s tl( )which satisfy the orthogonal condition:
0
0
( ) ( ) 0
T
i j
s t s t dt= i≠ j
∫
(5)
Where T0is signal duration time. s tl( )may be different signal such as LFM, poly-phase signal, frequency code signal ,etc.
The OFDM-LFM signal is
0 2 0
1 ) 2 2 (
2 1
( ) ( ) j f t ( ) j f t t
p p
t
s t u t e rect e
T T
π
π + µ
= =
(6)
The phase code signal is
{
( )}
( ) ( ) jl n , 1, 2, ... , 1, 2, ...,
Where ,
1 / , 0 ( )
0,
T t T
a t
other
< < =
,{
1 2}
2 2 2
( ) , ,..., = 0, , 2 ,..., ( 1)
l n M M
M M M
π π π
φ ∈ψ ψ ψ ⋅ − ⋅
The frequency code signal is
{
1}
( ) ( ) , 1, 2, ,
0
N l
s tl pn t nT l L
n
−
= ∑ − =
= (8)
Where,
2
, 0
( )
0, l j f tn
l e t T
pn t
elsewhere
π ≤ ≤
=
(9)All these kinds of signal satisfy orthogonal condition
.
The probing signal design problem for the narrowband radar network radar has been addressed. Our approach to this design problem is similar to the mathematical approach and is different from the more pragmatically approach. Our main contributions are the following: i) we address the question of determining a desirable transmit beam pattern, and show how to obtain such a beam pattern; ii) we modify the beam pattern matching criterion in several ways; and iii) we outline an efficient Semi-definite Quadratic Programming (SQP) algorithm for solving the signal design problem in polynomial time (the recent full version also considers a convex optimization algorithm for solving the design problem, yet one that is less efficient than the SQP algorithm proposed herein). The Shuttle Radar Topography Mission (SRTM) using single pass IFSAR techniques (2 phase centers) obtained height information for vast regions of the Earth in February 2000 (nearly 80 percent of the Earth’s land surface). One antenna was located in the shuttle’s payload bay, the other on the end of a 60 meter mast that extended from the payload bay once the shuttle was in space. This resulted in Digital Terrain Elevation Data (DTED) that is widely used today and is the most completed high resolution digital topographic database of the Earth.
6. CONCLUSION
Net radar is a hot topic recently which gets more and more attention from researchers. It can achieve better detection performance than conventional
phased radar. In this paper, the Support Vector Machine is applied to sea spoil detection in sea.
REFRENCES:
[1] F. C. Schweppe, "Sensor array data processing for multiple signal sources," IEEE Trans. On
Inform. Theory Vol. 14, No. 3,
pp.294-305,1968.
[2] R. O. Schmidt, "Multiple emitter location and signal parameter estimation," IEEE Trans.,on Antennas Propagat., Vol. 34, No. 3, pp. 276- 280, 1986.
[3] S. S. Reddi, "Multiple source location- A digital approach," IEEE Trans. Aerosp. Electron. Syst., vol. AES-15, pp 95-105, 1979. [4] R. Kumaresan and D. W. Tufts, "Estimating
the angles of arrival of multiple plane waves,"IEEE Trans. Aerosp. Electron. Syst., vol.AES-19,pp. 134-139, 1983.
[5] L. C. Godara, "application of Antenna Array to mobile Communications,Part II: Beam-Forming and Direction-of-Arrivial Considerations" Proc.IEEE, vol.85,pp.1195-1245,1997
[6] I. Ziskind and M. Wax, "Maximum likelihood localization of multiple sources by alternating projection," IEEE Trans. on Acoust., Speech, Signal Processing, Vol. 36,No. 10,pp.1553-1560,1988
[7] K. Sharman, "Maximum Likelihood estimation by simulated annealing", Proc., ICASSP’88, New York,pp.2741-2744,1988
[8] P. Stoica and A. B. Gershaman, "Maximum-Likelihood DOA Estimation by Data-Supported Grid Search", IEEE Signal Processing Letters, vol.6,pp.273-275,1999 [9] P. Stoica and K. C. Sharman, "Maximum
Likelihood Methods for Direction-of-Arrivial
estimation", IEEE Trans.
Acoust.,Speech,Signal Processing, vol.38,pp.1132-1143,1990