DRUG TARGET PREDICTION BASED ON HUMAN HIV-1
PROTEIN-PROTEIN NETWORK
1
ZHAO LIPING 2XIAO XUAN 3JIA JIANHUA
1,3(
Jingdezhen Ceramic Institute Information Engineering Institute,Jingdezhen,333001,China)
2(
Jingdezhen Ceramic Institute mechanical and electrical ,Jingdezhen,333001,China)
E-mail:[email protected], [email protected],[email protected]
ABSTRACT
Up to now, there have no fundamental methods to treat HIV-1(Human Immunodeficiency Virus type1). We constructed a network by the primary gene and protein of hiv-1 and then the corresponding dominating set.
Considering the Network properties: degree, betweenness centrality, Characteristic path length and Clustering coefficient etc. This paper analyzes those two networks’ properties, so as to find out the cdkn2a
is a potential drug targets.
Keywords: Proten-Proten Network,Betweenness Centrality,Dominate Set
1. INTRODUCTION
The incidence of acquired immunodeficiency syndrome (AIDS) has increased over the past few decades. Up to now, nearly 34 million people have
been suffered from human immunodeficiency virus-1 (HIV-1) infection, and an estimated 2.7
million people were newly infected with the virus in 2010
(http://www.who.int/features/factfiles/hiv/facts/en/i
ndex3.html). But, the natural course of HIV-1 infection and the susceptibility to infection after
exposure are highly heterogeneous among individuals [1] .
In the past decades, the effective preventive
measures against HIV are population screening and prevention of HIV transmission. Such as
male circumcision, vaginal microbicide gel, pre-exposure prophylaxis(PrEP), and vaccination, etc. However, no one of those methods could
effectively treat AIDS[2].
The houman body is made up of proteins, which
is regulated by gene. Those genes and proteins composite a network.
A network is a set of nodes, and edges between
the nodes. Networks enable studying the properties of complex systems that emerge from interactions
among individual parts. Hence, networks have been used to model and analyze many real-world phenomena in numerous domains. Examples
include social, technological, transportation, information, financial,ecological, chemical, and
biological systems. We focus on protein-protein interaction networks, with the goal of understanding
complex protein functioning by studying protein as inter-connected systems rather than as a collection of individual constituents. Nodes in these networks
represent biomolecules, such as genes, proteins, and edges connecting the nodes indicate functional,
corresponding biomolecules.
2. DATA AND METHODS
2.1. Data capture
HIV genes (HIV) are human genes known to
interact with genes of the HIV virus that are available from HIV-1 Human Protein Interaction
Database(http://www.ncbi.nlm.nih.gov/RefSeq/H IVInteractions/) .
HIV proteins and its regulatory genes are shown
in Fig 1. We obtained the data from one of the
interactome databases-Biogrid, Intact or DIP, and we excluded the dataset focused on proteins of a specific biological function..
[image:2.612.178.433.246.409.2]Use the data of table 1 to build network shown in Fig 2 A.
Figure 1 Genomic Organization Of HIV-1(The Picture Come Form Internet)
Table 1 Gene And Protein Of HIV-1
gene Function Position Hiv-1
gag
precursor P55
Matrix protein Virus particles P17
shell Virus particles: nucleus P24
nuclear shell Virus particles:DNA P9
Virus particles P6
pol
protein Virus particles P10
reverse transcriptase P66
reverse transcriptase P51
env
Integrase precursor
P34 Gp160
Envelope surface glycoprotein Virus particles:surface Gp120
transmembrane protein Gp41
Vif infection cell P23
tat transcription infection cell P14
Rev Control RNA cutting and running P19
Vpu Control CD4-env interaction infection cell:surface P15
[image:2.612.118.502.441.742.2]Figure 2 A: Network Of HIV-1 Has 164 Nodes, Its Clustering Coefficient Is 0.522, Network Diameter Is 11, It Has 11036 Shortest Paths And Its Percentage Is 41%, Characteristic Path Length Is 4.702, Average
Number Of Neighbors Is 3.341.
B:core network has 22 nodes, its clustering coefficient is 0.569, network diameter is 7, it has 462 shortest paths and its percentage is 100%, characteristic path length is 3.156, average number of neighbors
is 4.091.
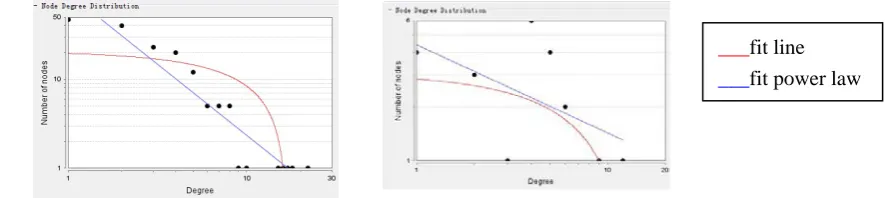
Figure3 Nodes Degree Distribution. Network Of HIV-1(Left) Panel ;Core Graph(Right) Panel
[image:3.612.84.529.335.434.2]A B
Figure 4 Clustering Coefficient Fit Line In The Form V=A+Bx Was Fitted,Power Law Has The Form V=Axb
A Network Of HIV-1 Coefficient Is 0.522; B Core Graph: Clustering Coefficient Is 0.569.
A B
___fit line
___fit power law
___fit line
___fit power law
[image:3.612.97.534.634.743.2]Figure 5 Betweenness Centrality: Power Law Has The Form V=Axb Coefficient As Follows:字体不同
A Network Of HIV-1: A=0.014,B=0.642,Correlation=0.169, R-Squared=0.056
B Core Graph:A=0.249,B=0.749,Correlation=0.212,R-Squared=0.033
[image:4.612.89.494.177.427.2]R-Squared Is Computed On Logarithmized Values.
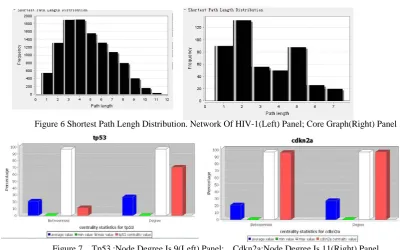
Figure 6 Shortest Path Lengh Distribution. Network Of HIV-1(Left) Panel; Core Graph(Right) Panel
Figure 7 Tp53 :Node Degree Is 9(Left) Panel; Cdkn2a:Node Degree Is 11(Right) Panel
Conclusion: the degree of a node is much more bigger, its betweenness value is bigger, and the node is more important. So, cdkn2a is a potential drug target.
2.2. Methods :Core graph construction and Network Parameter Estimation
2.2.1 Algorithm for constructing core graph[3]:
Let G(V,E) be a network, where V is the set of nodes of G and E is the set of edges of G. The algorithm starts with S=V, selects a node u with the
minimum degree in G[S], removes u from S only if the graph defined on S\{u} remains a connected
graph of G, and repeats the above steps for all nodes in S in order of their increasing degrees. Ues this method to construct the core graph of HIV-1
network shown in Fig 2 B.The network properties were computed using Cytoscape software
(http://dip.doe-mbi.ucla.edu/dip/Main.cgi). 2.2.2 Network properties.
Graphs. A graph G=(V,E) is a set of nodes V and a set of edges
E
⊆
V
×
V
. We considerundirected graphs:
(
u
,
v
)
∈
E
. The degree of anode in the network is the number of other nodes it
connected to.
Clustering coefficient. The clustering coefficient was first defined by Watts and Strogatz [4]. The
clustering coefficient, C, for a node is a notion of how connected the neighbours of a given node are
to the other nodes (cliquishness) [5]. The average clustering coefficient for all nodes in a network is taken to be the network clustering coefficient. In an
undirected graph, if a vertex vi has ki neighbors, k i
(k i - 1)/2 edges could exist among the vertices
within the neighbourhood (N i). The clustering
coefficient for an undirected graph G(V, E) (where V represents the set of vertices in the graph G and E
The average clustering coefficient characterizes the overall tendency of nodes to form clusters or
groups. C(k) is defined as the average clustering coefficient for all nodes with k links[5].
Characteristic path length. The characteristic path length, L, is defined as the number of edges in the shortest path between two vertices, averaged
over all pairs of vertices. It measures the typical separation between two vertices in the network. Intuitively, it represents the network’s overall
navigability [5] .
where dG (u, v) is the shortest path between u and
v in G.
Network diameter. The network diameter d is
the greatest distance (shortest path, or geodesic path) between any two nodes in a network. It can also be viewed as the length of the ‘longest’ shortest path in
the network.
where dG (u, v) is the shortest path between u and
v in G.
Betweenness centrality. The betweenness
centrality is the measure of vertex within a graph. For a given graph G(V,E), with n vertices, the betweenness CB (v) of a vertex v is defined as.
where
δ
st is the number of shortest path from sto t, and
δ
st(
v
)
is the number of shortest paths froms to t that passes from vertex v.The betweenness centrality analysis was performed for both the
networks [5] .
Power law distribution. For a given network the
power law distribution states the probability that a given node has k links,which is given by equation
p(k)~ k-
λ
, whereλ
is degree exponent.For smaller values ofλ
, the role of the ‘hubs’, or highly connected nodes, in the network becomesmore important. For
λ
>3, hubs are not relevant, while for 2<λ
<3, there is a hierarchy of hubs,with the most connected hub being in contact with asmall fraction of all nodes. Scale-free networks have a high degree of robustness against random
node failures, although they are sensitive to the failure of hubs [6]. The probability that a node is highly connected is statistically more significant
than in a random graph[5].
3. CONCLUSION
By analyzing the HIV-1 network and its performance of dominating sets, as shown in Fig2 to Fig 6, we can get the following conclusions: the
dominant clustering coefficient is greater than
HIV-1 network, the results of power law distribution and betweenness centrality are better than HIV-1 network.
The core graph shows the relationship between the degree of the node and betweenness centrality.
As shown in Fig 7, the greater the degree of the node, the greater the value of betweenness, and the nodes have greatest degree might be a new drug
target.
In this paper, the degree of tp53 and cdkn2a are
respectively 9 and 11, are bigger than the other nodes. So, these two nodes are more important.The degree and betweenness value of those nodes are
that:cdkn2a is a potential drug target.
REFERENCES
[1] Cao Y, Qin L, Zhang L, Safrit J, Ho DD (1995)
Virologic and immunologic characterization of long-term survivors of human
immunodeficiency virus type 1 infection. N Engl J Med 332: 201–208.
[2] Pantaleo G (1997) Immunology of HIV
infection. Res Immunol 148: 417–419.
[3] Dominating Biological Networks Tijana Milenkovic´1, Vesna Memisˇevic plos one August 26, 2011
[4] Watts DJ, Strogatz SH (1998) Collective
dynamics of ‘/small-world/’ networks.Nature 393: 440–442.
[5] Raman K (2010) Construction and analysis of protein-protein interaction networks. Automated Experimentation 2: 2.
[6] Barabasi A-L, Oltvai ZN (2004) Network biology: understanding the cell’s functional