http://dx.doi.org/10.4236/jgis.2014.66050
Effectiveness of Fuzzy Overlay Function for
Multi-Criteria Spatial Modeling—A Case
Study on Preparation of Land Resources
Map for Mawsynram Block of East Khasi
Hills District of Meghalaya, India
Priyanka Baidya, Dibyajyoti Chutia, Singuluri Sudhakar, Chandan Goswami, Jonali Goswami, Victor Saikhom, Puyam S. Singh, Kamini Kanta Sarma
North Eastern Space Applications Centre, Department of Space, Government of India, Umiam, India Email: [email protected]
Received 14 September 2014; revised 10 October 2014; accepted 5 November 2014
Copyright © 2014 by authors and Scientific Research Publishing Inc.
This work is licensed under the Creative Commons Attribution International License (CC BY).
http://creativecommons.org/licenses/by/4.0/
Abstract
Multi-criteria spatial modeling is one of the important components of spatial decision support system (SDSS). Multi-criteria spatial modeling often requires a common scale of values for diverse and dissimilar inputs to create an integrated analysis. Weighted overlay function is most com-monly used for site suitability analysis which identifies the most preferred locations for a specific phenomenon. However, weighted overlay function gives inconsistent and erroneous results for highly dissimilar inputs as it assumes that most favorable factors result in the higher values of raster, while identifying the best sites. This paper conveys the effectiveness of fuzzy overlay func-tion for multi-criteria spatial modeling. It is based on the principle of fuzzy logic theory which de-fines membership using Gaussian function on each of the input rasters instead of giving individual rank to them like in weighted overlay function. A case study on preparation of land resources map for Mawsynram block of East Khasi Hills district of Meghalaya, India is presented here. It was ob-served that fuzzy overlay function has given more satisfactory output in terms of site suitability while comparing with the result of weighted overlay function.
Keywords
1. Introduction
Spatial analysis in Geographic Information System (GIS) is a rapidly changing filed, which includes a variety of techniques, tools and different analytical approaches. Applicability or effectiveness of spatial analysis has been greatly improved by integration of various statistical methods for solving complex problem. The increasing abil-ity to capture and handle geo-spatial data conveys that spatial analysis is mainly occurring within data-rich en-vironment. However, spatial data come in many formats and it is not easy to arrive at a system of classification that is simultaneously exclusive, exhaustive, imaginative, and satisfying [1]. GIS facilitates an environment for managing the data and computing their spatial relationship.
Spatial analysis is an important component in multi-criteria spatial modeling. Multi-criteria spatial modeling often requires intervention of users for any need-based applications or services. The availability of relevant geo-spatial data and their influences or relevance are the main basis of spatial analysis for any kind of potential application. For example, the accessibility to services, facilities and amenities is an essential factor for evalua-tion of potential sites for infrastructure development [2] [3]. Spatial analysis has been effectively used to provide newer dimensions in identifying suitable sites for various horticultural crops and also for appropriate monitoring and management of land resources in an integrated manner with reference to agro-climatic condition [4]. Chutia 2010 developed an efficient election management system where multi-criteria modeling was used for identifica-tion of scientific locaidentifica-tion of polling staidentifica-tions [5]. Multi-criteria spatial modeling enabled by spatial analysis is one of the most efficient tools for development of spatial decision support system (SDSS). It not only improves the management, analysis and presentation of any SDSS, but also supports spatial analysis and modeling within the geographic and the other spatially defined data [6].
In this paper, we have demonstrated the applicability of multi-criteria spatial modeling for site suitability analysis. A case study on preparation of land resource map for Mawsynram block of East Khasi Hills district of Meghalaya, India is presented. Mawsynram block of Meghalaya has tremendous scope for expansion of horti-cultural and agro-hortihorti-cultural activities. Since the land holdings of this region are small, the cultivators should be encouraged to move from subsistence farming to high-valued crops like vegetables, fruit, medicinal and aro-matic plants. Cultivation of these crops requires more labour having knowledge of cultivation and need support of modern technologies, cold storage and marketing [7]. However, cultivators of the region need to be exposed scientifically about the capability of their own lands to make it more productive. Site suitability analysis of a land can be performed mainly based on the capability of the land, e.g. in terms of land use pattern, soil type, ground water prospect, climate and other scientific inputs. The main objective of this study is to establish the effectiveness of fuzzy logic for preparation of land resource map.
2. Study Area
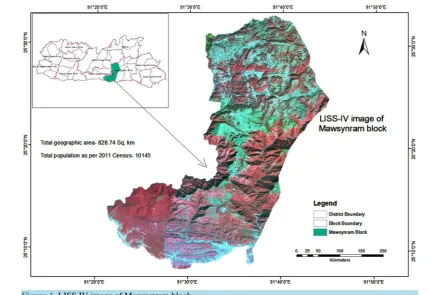
Mawsynram block of East Khasi Hills district of Meghalaya covers an area of 828.74 Sq.km with a total popula-tion of 45,262 as per 2011 census. Mawsynram is one of the 8 blocks of East Khasi Hills district lies between 25˚08'N & 25˚33'N Latitude and 91˚21'E & 91˚45'E Longitude. The Mawsynram town is located at 51 km away from the state capital Shillong. Mawsynram features a subtropical highland climate with an extraordinarily rainy and lengthy monsoonal season. Based on the data of a recent few decades, it appears to be the wettest place in the world, or the place with the highest average annual rainfall. Mawsynram receives nearly 12 m of rainfall in an average year, and the vast majority of it falls during the monsoon months. The block has tremendous poten-tial for expansion of both horticultural and agro-horticultural activities considering the typical geographical ter-rain and climate. Figure 1 depicts the satellite image of Mawsynram block as captured by LISS IV sensor of Resourcesat-1 satellite.
3. Datasets and Methodology
3.1. Datasets UsedFigure 1. LISS IV image of Mawsynram block.
of land use is given inTable 1 and the corresponding land use map of Mawsynram block is shown inFigure 2.
3.2. Methods
We have adopted multi-criteria spatial modeling using weighted overlay function and fuzzy overlay function. Total four input layers, LULC, LCAP, GWP and SWP have been incorporated in the spatial model with their respective influence values and weightages. Higher value of influence in weighted overlay function indicates the importance of a layer in a particular site suitability analysis. For example, LULC and LCAP are given higher in-fluences as compared to SWP and GWP while recommending intensive agriculture. On the other hand, fuzzy overlay function is not based on influence value; it requires weightage of fuzzy membership value to decide the suitable area. The proposed site suitability map for land resources planning is comprised of intensive agriculture (IA), agro-horticulture (AH), horticulture (H), aforestation (AF) and no change (NC). NC is basically comprised of built up area, water bodies, forest and non-culturable wastelands for which analysis was not carried out. Proximity to the existing roads and settlements is another important parameter while finalizing suitable sites. Total agricultural land in the study area is 5860.48 ha, whereas area falling under culturable wasteland is 31225.43 ha. Culturable wasteland is nothing but mainly comprised of scrublands, forest blank and tree clad areas (open) and few pockets of existing wastelands. Major influence was given to the agricultural land while recommending intensive agriculture followed by horticulture and agro-horticulture areas. On the other hand, culturable wasteland is more relevant as compared to the other land use classes for recommendation of aforesta-tion, horticulture and agro-horticulture areas.
3.2.1. Weighted Overlay
Figure 2. Land use map of Mawsynram block.
Table 1. Existing land use statistics.
Land Use Classes Area (ha)
Agricultural Land 5860.48
Built Up 5657.06
Forest Blank 9.83
Scrub Forest 13.25
Tree Clad Area-Closed 38513.55
Tree Clad Area-Open 20618.73
Wastelands 10610.77
Water Bodies 1590.29
Total 82873.96
( )
m1 li* l lf x =
∑
=W I (1)where, m is the number of input raster,
Wli is the weightage value of i-th pixel of l-th layer, Il is the percentage influence of l-th layer.
to-gether. Weighted Overlay assumes that more favorable factors result in the higher values in the output raster, therefore identifying these locations as being the best. The flow chart of spatial modeling is given in theFigure 3.
3.2.2. Fuzzy Overlay
Fuzzy overlay analysis is based on set theory, where a set generally corresponds to a class. Fuzzy overlay analy-sis reclassifies or transforms the data values to a common scale, but the transformed values represents the prob-ability of belonging to a specified. In weighted overlay and weighted sum, the values are on a ratio scale of pre-ference, with the higher values being more favourable, unlike possibilities of membership as they are in fuzzy overlay. The combining analysis step in fuzzy overlay analysis quantifies each location’s possibility of belong-ing to specified sets from various input rasters. The equation usbelong-ing fuzzy Gaussian function can be given as:
( )
( )21* 2
f x f
x e
µ = − −
(2)
where, the inputs to the equation f1 and f2 are the spread and the midpoint respectively.
Midpoint can be user-defined value with a fuzzy membership of 1. The default is the midpoint of the range of values of the input raster. Spread defines the membership of the Gaussian function. It generally ranges from 0.01 to 1. Increasing the spread causes the fuzzy membership curve to become steeper. Fuzzy overlay analysis quan-tifies the possibilities of each cell or location to a specified set based on membership value. The flow chart of multi-criteria spatial modeling using fuzzy overlay function is given in theFigure 4.
4. Results and Discussion
The main objective of this study is to establish the effectiveness of fuzzy logic for multi-criteria site suitability analysis. Here, site suitability analysis outputs the recommended areas based on certain criteria as discussed in the earlier sections. Both weighted overlay and fuzzy overlay function were used in the multi-criteria model. Any overlay function in a multi-criteria spatial model is considered to be effective if it satisfies all the input cri-teria for identification of suitable sites. Discussions on statistical summary of results followed by comparative evaluation of both the overlay functions are illustrated next.
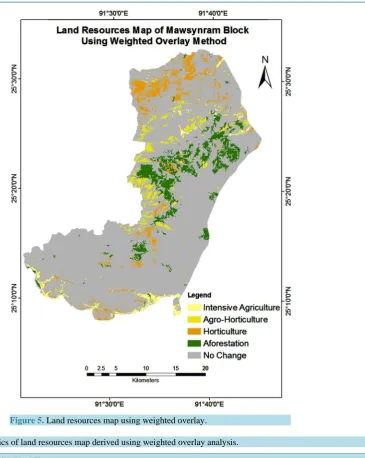
Area statistics of land resources map derived from weighted overlay analysis is given in Table 2. Out of 5860.48 ha of existing agricultural land, intensive agriculture is proposed in 2992.37 ha areas. Major portion of the agricultural land is found suitable for intensive agriculture. However the land has tremendous potential for expansion of other agro-horticultural and horticultural activities. Out of 31225.43 ha of culturable wasteland, approximately 11760.76 ha area is found suitable for expansion of land resources planning activity. The area mentioned under “No Change” category (Table 2andTable 3) are not feasible for above activities because of type of current land uses (e.g. barren rocky areas). Result of weighted overlay analysis shows that major portion of the culturable wastelands is cultivable and has good potential for mainly horticultural and other agro-horti- cultural activities. Around 123.86 ha areas of culturable wastelands are found suitable for intensive agriculture. The land resources map prepared using weighted overlay is depicted in theFigure 5.
[image:5.595.177.453.558.607.2]Figure 3. Flow chart of multi-criteria spatial modeling using weighted over-lay function.
Figure 5. Land resources map using weighted overlay.
Table 2. Area statistics of land resources map derived using weighted overlay analysis.
Details on Existing Land Uses
and Culturable Wastelands Areas (in Ha) Recommended for
Class Area (Ha) Aforestation Agro-Horticulture Horticulture Intensive Agriculture No Change
Agricultural Land 5860.48 00.00 989.73 1878.38 2992.37 00.00
Culturable Wastelands 31225.43 5586.23 2917.24 3133.43 123.86 19464.67
Other Forest Areas 38513.55 480.22 00.00 00.00 00.00 38033.33
Total 56134.79 6066.45 3906.97 5011.81 3116.23 38033.33
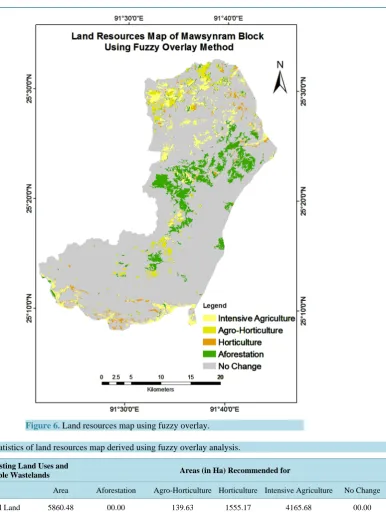
Figure 6. Land resources map using fuzzy overlay.
Table 3. Area statistics of land resources map derived using fuzzy overlay analysis.
Details on Existing Land Uses and
Culturable Wastelands Areas (in Ha) Recommended for
Class Area Aforestation Agro-Horticulture Horticulture Intensive Agriculture No Change
Agricultural Land 5860.48 00.00 139.63 1555.17 4165.68 00.00
Culturable Wastelands 31225.43 4758.85 2604.44 1981.04 5.47 21902.8
Other Forest Areas 38513.55 762.99 00.00 00.00 00.00 37750.55
Total 53723.83 6521.84 2744.07 3536.21 4171.15 37750.55
areas for aforestation.
Some of the experimental observations made during the investigation are illustrated below:
• Most of the areas recommended by fuzzy overlay analysis are found fulfilling the criteria considered for po-tential sites as compared to weighted overlay analysis. The spatial distribution of recommended areas of land resources map derived using fuzzy overlay function is found more suitable as compared to the weighted overlay function while examining the existing input layers like land use, land capability and ground water prospects.
• Though fuzzy overlay analysis is computationally more expensive than weighted overlay analysis, but it gives more accurate and consistent results.
• In many instances, weighted overlay analysis either overestimated or underestimated the potential sites. For example, large portion of agricultural areas are wrongly recommended for horticulture, however, existing agriculture land is more suitable for intensive agriculture.
In view of all, fuzzy overlay is found to be a better alternative than other overlay functions. The result pre-sented here is quite encouraging, but, further research is needed to improve the performance of fuzzy overlay analysis based on statistical methods and observations.
Acknowledgements
Authors are grateful to North Eastern Space Applications Centre, Dept of India, Govt. of India, Umiam-793103, Meghalaya, India for providing necessary supports during the study. Authors also acknowledged ESRI for using their software and literatures.
References
[1] Upton, G.J. and Fingelton, B. (1985) Spatial Data Analysis by Example Volume 1: Point Pattern and Quantitative Data.
Biometrical Journal, 28, 664.
[2] Knox, P.L. (1980) Measure of Accessibility as Social Indicators: A Note. Social Indicators Research, 7, 367-377.
http://dx.doi.org/10.1007/BF00305607
[3] Sénécal, G. (2002) Urban Spaces and Quality of Life: Moving beyond Normative Approaches. Policy Research Initia-tive, 5, 306-318.
[4] Goswami, J., Chutia, D. and Sudhakar, S. (2012) A Geospatial Approach to Climatic Zone Specific Effective Horti-cultural Planning in East Khasi Hills District of Meghalaya, India. Journal of Geographic Information System, 4, 267- 272. http://dx.doi.org/10.4236/jgis.2012.43032
[5] Chutia, D. (2010) Application of Geospatial Technologies for Development of an Efficient Election Management Sys-tem in Meghalaya. Journal of Geomatics, 5, 115.
[6] Oledzki, J.R. (2004) Geoinformatics: An Integrated Spatial Tool, Miscellanea Geographica Warszawa. Miscellanea Geographica—Regional Studies on Development, 11, 323-331.
http://www.wgsr.uw.edu.pl/pub/uploads/mcg04/35oledzki.pdf
[7] Neog, A.K. (2006) WTO and Agriculture Development in Backward Regions. In: Deb, B.J. and Ray, B.D., Eds.,