© 2018, IRJET | Impact Factor value: 6.171 | ISO 9001:2008 Certified Journal | Page 4712
Study on Effect of Openings in Seismic Behavior of Masonry Structures
Nila. N. D
1, Sivan P. P
2, Ramya K. M.
31PG Student, M-tech Structural Engineering, Sreepathy Institute of Management and Technology, Vavanoor, India 2Assistant Professor, Department of Civil Engineering, Government Engineering College, Thrissur, India 3Assistant Professor, Department of Civil Engineering, Sreepathy Institute of Management and Technology,
Vavanoor, India
---***---Abstract:
From beginning of civil construction masonry structure has a leading role due to its low cost, high fire-resistant capacity, good sound and mainly easily availability. This type of buildings is very vulnerable during earthquake and sometimes the entire structure may have collapsed. So, in earthquake prone areas proper monitoring should be given for the masonry structures. Various analytical and experimental studies are carried out in this field.The main aim of this study is to find the effect of opening in the URM structures corresponding to the seismic action. For this different length to breadth ratio (L=B, L=1.2B, L= 1.4B, L=1.6B, L=1.8B, L=2B) of 1150 sq. Ft. biaxially asymmetric buildings plans are taken. Here in this plans the built-up area of all structures are same but the percentage of the opening will change according to the type of plan. These plans are modelled and analyzed with the help of 3MURI software. Then the performance point of all the building is determined with the help of pushover cure obtained from the software and a comparative study of all buildings were carried out.
Key Words: Unreinforced Masonry, Effect of Opening, Pushover Analysis, Performance Point.
1 INTRODUCTION
Masonry is a composite material, which contains both brick units and mortar. It is one of the main techniques used to construct the building units from olden days. The masonry constructions are very durable and often require little maintenance that makes them very useful for the construction purpose. As similar to concrete, masonry structures have high compressive strength and low tensile strength. Generally, masonry is a elastic, non-homogeneous and anisotropic material composed of two different materials, bricks and mortar. It is very weak in tension due to the weak bond between them. The strength and the durability depend on the quality of materials, mortar and the workmanship.
The masonry structures are commonly classified as
• Unreinforced masonry
• Reinforced masonry
• Confined masonry
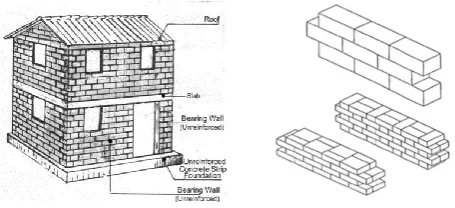
An unreinforced masonry building (Figure 1: UMB, URM building) is a building where load bearing walls or other structural members are made of bricks which are binded together by cement mortar that are not provided with reinforcing material. URM structures are vulnerable to collapse in an earthquake, they will produce cracks when comes under earthquake. They have little ability to withstand lateral force during heavy rain and wind.
Fig1: Unreinforced masonry
[image:1.595.324.552.307.411.2]Reinforced masonry construction (figure:2) consisting of load- bearing walls into which suitable metal (normally steel) are introduced and bonded together to get a composite material capable of resisting the compressive stresses, tensile and shear stresses which obtain in a structure. Reinforcement in walls are at required intervals both horizontally and vertically is used. The size, quantity, spacing etc. of the reinforcement is calculated by the upcoming loads on the structure.
Fig 2: Reinforced grouted cavity masonry construction system
© 2018, IRJET | Impact Factor value: 6.171 | ISO 9001:2008 Certified Journal | Page 4713 effective in enhancing the stability, integrity, and ductility of
the masonry walls and lead to better seismic performance of masonry buildings compared to other forms of construction.
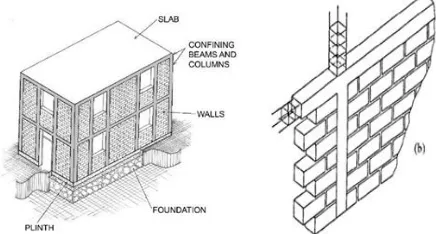
Fig 3: (a) A confined masonry building unit (b) Reinforced concrete bond beams and columns
1.1 Types of Failures
Vibrations caused by the earthquakes generate additional loading on the structure and the Shear stresses developed will cause damage to structural elements. The masonry is under compression and weak in resisting bending and shear, hence the final result will be the collapse of the structure. The different failures modes of masonry are:
a) Sliding shear failure
b) Diagonal cracks
c) Non-structural failure
d) Failure due to overturning
2. LITERATURE REVIEW
M. Shariq et.al 2007 [1] studied the influence of openings on seismic performance of masonry structures. In that study finite element analysis were carried out on a single storied masonry building unit with varying aspect ratios and different opening positions. The variation of maximum tensile stress and maximum shear stress are studied to compare the behavior of the structure. In the study it was observed that the maximum principal tensile stress occurs in short wall and maximum shear stress occurs in long wall.
N. Augenti and A. Romano 2008 [2] The paper discusses about some seismic design methods using three software’s RAN, SAM and 3MURI.The study analyses the basic hypotheses, the calculus procedures, the criteria and the applicative capabilities of these three After comparing it was found out that the main difference in these software’s are obtained at the modelling stage itself. The RAN method allows a linear static seismic analysis for each story of the building, SAM Method uses the nonlinear static analysis and the 3MURI method allows to carry out linear and non-linear static analyses
A. Penna, et.al. 2008 [3] the paper studied non-linear macro-element analyses that are used for the analysis of masonry structures under seismic loads. This modelling method has been implemented in the TREMURI software with non-linear static and dynamic analysis procedures. In this paper, modelling strategies are presented with an accurate macro-element approach without heavy computational load and are developed for the analysis of both building and bridge structures. An experimental comparison was also done using a building from Barcelona. The result of this study shows that the non-linear macro-element modelling of 3-dimensional masonry buildings supplies reliable results in comparison with experimental data. Its seismic analysis capabilities make the TREMURI program a valid tool both for research activity and engineering practice.
Fulvio Parisi and Nicola Augenti 2013 [4] In this paper the effects of irregularities on the seismic capacity of unreinforced masonry (URM) walls with openings are studied. Their regular masonry walls include (i) openings of different sizes, (ii) openings misaligned in the horizontal and/or vertical direction, or (iii) a variable number of openings per story. The irregular buildings lead to non-uniform distribution of gravity loads and also resulting in premature collapse of the building. The methodology of this paper includes the macro- element modelling of URM walls with openings. There are different macro- elements such as (i) Pier panels (ii) Spandrel panels (iii) Joint panels and the failure modes of the macro-elements mainly depend on the relative strength between masonry components, applied axial forces and the boundary conditions. In this paper a Static Push over Analysis is conducted on a two-story URM wall with openings. The results of the study show that the seismic capacity of the URM walls significantly reduces with increase in the geometric irregularity.
Sharmin Reza Chowdhury, et.al. 2012 [5] the study was conducted using finite element software, ETABS. The results show that the Stiffness of the structures is affected by the size of the openings as well as their locations. The opening placed in plane of loading is more critical than that of opening in shear wall placed out of plane of loading.
V. Vysakh et.al. 2013[6] this paper study about different methods of determination of performance point in capacity spectrum method. The capacity spectrum method is one of the widely accepted method used for the calculation of performance point. There are three capacity spectrum methods named A, B and C. Method A is the direct application theory while method B is based on the assumption of constant post yield slope, which are used in software’s like ETABS and SAP2000. Procedure C is purely graphical method.
[image:2.595.51.269.128.245.2]© 2018, IRJET | Impact Factor value: 6.171 | ISO 9001:2008 Certified Journal | Page 4714 530-02, IBC 2000, NZS 4230:1: 1990, Eurocode 6 and IS
1905-1987. When comparing the properties of brick units in different places India shows relatively lower strength values. Experimental studies were carried out, here three different types of brick units and three mix proportions of mortar were considered for the study. In bricks, two types of wire cut bricks and one type of country burned bricks were used for the investigation. The results obtained that the mechanical properties of mortar reduce with lower mix proportions of mortar.
3. METHODOLOGY
After a brief description of the adopted models (L=B, L=1.2B, L=1.4B, L=1.6B, L=1.8B, L=2B) and analytical validation, this paper focus on the effect of openings on biaxially asymmetrical URM structures during an earthquake. Different types of analysis methods are there for the study of masonry structures. Finite element modelling analysis is a most suitable method to analyze the structure because it gives more finite and accurate result. Inelastic strength and deformation demands can be determined by using nonlinear static analysis or push over analysis. Here 3-dimensional modelling and analysis of the structure is going to do by using the software 3MURI. The displacement and shear of the building will get from the pushover curve this helps to find the performance point of the building. It will help to compare the performance of all models and can identify which building has more performance against earthquake.
4. MODELING AND ANALYSIS OF URM STRUCTURE USING 3MURI
3MURI is an analytical software developed for the structural and seismic analysis of masonry building. It is mainly based on the equivalent frame modelling approach incorporating several macro-element models for the simulation of masonry and non-masonry structural members. The macro-element analysis mainly consists of masonry piers, spandrel strips. It will give all possible failure mechanisms like composed flexural and axial load, tensile shear and sliding shear. The reduction of the section (induced by cracking) helps to evaluate the stiffness degradation which involves the panels stress variation generated by external actions. Both nonlinear static and dynamic analyses of a 3D building can be done by using this software and this also provide a clear understanding result.
The building considered for the numerical analysis is a biaxially asymmetric building plan. It is a one-story building with a total height of 3m. (in Figure 4) shows the L=B plan view. According to this modify the plans to L=1.2B, L=1.4B, L=1.6B, L=1.8B, L=2B are modelled and analyzed by using 3Muri software. The wall thickness is 24 cm.
[image:3.595.351.543.72.263.2]
Fig 4: building plan1
The center of mass and center of rigidity of all plans are calculated. These are depending on the story height, shape of the structure and the openings. The difference of center of mass and center of rigidity will give the eccentricity of the building.
The rigidity of walls in X and Y direction and the center of gravity of corresponding walls will give the eccentricity in that particular direction.
(1)
Here K and x are the rigidity of individual walls and center of gravity respectively
Mass of the building and corresponding CG gives the COM of the building
(2)
Here M and x are mass of the walls and floors and corresponding CG respectively.
The material properties of all plans are same and that are given below:
Table 1: Building parameters
Description Values
Unit weight of masonry 1920 kg/m3
Safety factor, Ym 3
The compressive strength of mortar, fm 2.96 N/mm2
The compressive strength of masonry, fk 2.46 N/mm2
Initial shear strength, fvk0 0.29 N/mm2
© 2018, IRJET | Impact Factor value: 6.171 | ISO 9001:2008 Certified Journal | Page 4715
Young’s modulus, E 1800 N/mm2
Rigidity modulus, G 250 N/mm2
Floor finish 1 kN/m2
Dead loads, Gk 1.0 kN/m2
Accidental loads, Qk 2.0 kN/m2
Table 2: size of openings provided
1 2 3 4
WINDOWS 500 X 1350m 100 X 1350 150 X 1350 200 X 1350
DOORS 750 X 2100 900 X 2100 1050 X
2100
1200 X 2100
VENTILATIONS 300 X 300 300 X 300 300 X 300 300 X 300
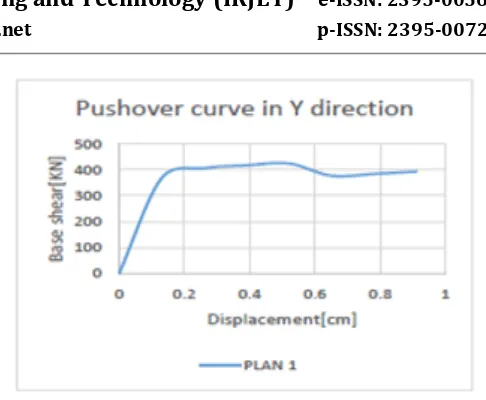
[image:4.595.311.554.42.242.2]By using the parameters given in table (1) the plan is modelled in 3MURI software. The meshes are generated automatically and after completing the analysis we will get a pushover curve in terms of force and displacement. It is a plot of base shear vs lateral displacement.
Fig 5: 3D model of plan 1
Fig 6: Pushover Curves in X and Y direction 4.1 PERFORMANCE POINT
It is a point where capacity curve and demand curve coincide. Both of these curves are mutually dependent. In the case of a capacity spectrum, where displacement increases the period of the structure lengthens. At the performance point both the capacity and demand are equal. So, there is a need of covert them in to a common scale i.e. Spectral acceleration vs. spectral displacement. This format of plotting is known as Acceleration – Displacement Response Spectra (ADRS). Each point on a response spectrum curve has associated with unique spectral acceleration, Sa, spectral velocity Sv, spectral displacement Sd and period T. To convert from Sa vs. T found in building codes to ADRS format, it is necessary to determine the value of Sdi for each point on the curve using the following equation;
(3)
Based on push over curve, base shear (V) and roof
level displacement (𝛿) is converted to points Sai and Sdi respectively.
(4)
Where, 𝛼𝑖 is the modal mass coefficient
(5)
Where, PF1is the participation factor and ∅1 is roof
[image:4.595.40.556.401.781.2]© 2018, IRJET | Impact Factor value: 6.171 | ISO 9001:2008 Certified Journal | Page 4716 Fig 7: capacity vs. demand curve
[image:5.595.45.284.502.658.2]5. RESULT AND DISCUSSION
Fig 8: Comparison of performance of building in long and short wall direction
Fig 9: Biaxially asymmetric buildings with varying opening size
6. CONCLUSIONS
The seismic analysis helps to study about the behavior of building under earthquakes. This works includes the seismic response of biaxially asymmetrical building with different opening sizes and position. The findings are listed below:
To make the masonry walls resistant to the earthquake
we have to give proper attachments between the masonry panels at their junctions.
The seismic capacity of the URM walls significantly
reduces with increase in the geometric irregularity.
The symmetrical buildings have high performance
during earthquake than asymmetrical or biaxially asymmetrical buildings
The Biaxially asymmetric building shows better
performance than other buildings in their long wall direction
When opening percentage in wall increases from 3 to 7,
40% reduction in the shear carrying capacity
The buildings with openings at the center of walls have
30-40% higher performance than the buildings with openings at other positions
The buildings with small openings withstand higher
range of loads than the buildings with large opening sizes
Failure mechanism depends on the eccentricity, wall
openings, Presence of encirclements, wall density …etc.
ACKNOWLEDGEMENT
I would like to express my deepest appreciation to all those who provided me the possibility to complete this paper. A special gratitude I give to my guide, Mrs. Ramya K.M & Mr. Sivan P.P., whose contribution in stimulating suggestions and encouragement, helped me in writing this paper.
REFERENCES
[1] M. Shariq et.al “Influence of openings on seismic
performance of masonry building walls”, Building and Environment 43 (2008) 1232–1240, March 2007
[2] N. Augenti and A. Romano, “seismic design of masonry
buildings through macro- elements”, 14th International Brick and Block Masonry Conference, Sydney- Australia. 2008
[3] A. Penna, et.al. “Seismic assessment of masonry
structures by non-linear macro element analysis” (2008)
[4] Fulvio Parisi and Nicola Augenti “Seismic capacity of
irregular unreinforced masonry walls with openings”, International Association for Earthquake Engineering, (2013).
[5] V. Vysakh, Dr. Bindhu, and K.R. Rahul Leslie, 2013
© 2018, IRJET | Impact Factor value: 6.171 | ISO 9001:2008 Certified Journal | Page 4717 Spectrum Method”, International Journal of Innovative
Research in Science, Engineering and Technology, An ISO 3297: 2007 Certified Organization, Volume 2, Special Issue 1, December 2013
[6] Rui Marques and Paulo B. Lourenco, “Unreinforced and
confined masonry buildings in seismic regions: Validation of macro – element models and cost analysis”, Engineering structures, January 2014, pp 52-67
[7] G. Muthukumar and Manoj Kumar (2014) “Influence
of Opening Locations on the Structural Response of Shear Wall”, Hindawi Publishing Corporation Journal of Nonlinear Dynamics
[8] Tianyi Yi, et.al, “Lateral Load Tests on a Two-Story
Unreinforced Masonry Building”- Journal of Structural Engineering © ASCE, 2006.132;643-652, 2006
[9] Jitendra K. Bothara, et.al. “Seismic performance of an
unreinforced masonry building: an experimental investigation”, Earthquake Engineering and Structural Dynamics, Earthquake Engng Struct. Dyn. 2010; 39:45– 68, 2009
[10] J. Snoj, M. Osterreicher and M. Dolsek, “Experimentally
supported modeling of an existing masonry building by measuring ambient and forced vibrations”, Proceeding of 15th World Conference of Earthquake Engineering, LISBOA 2012
[11] Oltion Korini and Huseyin Bilgin 2012 “A new modelling
approach in the pushover analysis of masonry structures”, International Students’ Conference of Civil Engineering, ISCCE 2012, Epoka University, Tirana, Albania
[12] Naida Ademovic and Daniel V. Oliveira, “Seismic
assessment of a typical masonry residential building in Bosnia and Herzegovina”, Proceeding of 15th World Conference of Earthquake Engineering, LISBOA 2012
[13] Sergio Lagomarsino, et.al., “TREMURI program: An