© 2017, IRJET | Impact Factor value: 5.181 | ISO 9001:2008 Certified Journal | Page 914
Partial Replacement of Course and Fine Aggregate By
Plastic Waste and Bed Ash
Chandrakant S.Bhashakhetre
1,Abhijit N. Chalkhure
2,Shradhesh R. Marve
3,Nilesh T. Wadhai
41
Associate Professor Department of Civil Engineering, Shri Sai College of Engg. & Tech.,Bhadrawati,MH, India.
2,3,4Assistant Professor Department of Civil Engineering, Shri Sai College of Engg. & Tech., Bhadrawati, MH, India.
---***---Abstract -
Concrete is the key element in the world of construction and is used at a very high rate worldwide. although the components of concrete are costly the replacement of second costly component i.e. Coarse aggregate by waste burnt plastic can reduce the cost and even help to reduce the problems produced by the disposal of waste plastic. Most of the failure in concrete structures occurs due to failure of concrete by crushing of aggregate .PCA’s which have low crushing values will not be crushed as easily as the stones aggregate .Since a complete substitution for NCA was not found feasible , a partial substitution with carious percentage of PCA was done. Both volumetric and grade substitution was employed in this investigation. However substitution by weight may serve costly hence the employment of investigation should be done based on volume. Further the bed ash is generated in a large quantity which may be used as substitution of natural sand, if it is found suitable for structural concrete it may reduce the uses of natural sand and thus reduce the problem caused due to exaction of sand from river bed. The basic idea deals with achieving the aim to produce concrete that may serve the desired characteristics and also help to reduce environmental hazard.Key Words: Fly Ash, Bed Ash, Plastic Waste, Aggregate, Natural Fine Aggregate (NFA
)
1. INTRODUCTION
A previous in literature survey has indicated that, thermal power plant bottom ash would be a potential fine aggregate in concrete. The thermal power plants are the main source of power generation in India. These thermal power plants have been generating about two thirds of the power demands of the country. There are about forty major thermal power plants in India. World at present produces around approximately 1528 Million Tons of coal fly ash when India at present produces around 120 Million Tons of Ash per annum. The beneficial use of fly ash in concrete is the preferable option for safe and economical utilization of millions tons of fly ash. There is a critical need to find new methods for using fly ash for its highest and best use. The major obstacle in use of bottom ash in a concrete is that the chemical properties of coal bottom ash are different from place to place and are depends upon the origin of the raw material. It was found that water absorption of bottom ash which is received from Elkhart thermal power plant Nasik was around 10% greater than natural sand that indicates
that the porosity of fly ash is high. Malhotra (1996) reported that at least 70 % of total fly ash is generally suitable for use as a cement replacement in concrete
.
2. METHODOLOGY
The methodology of the project deals with the series of operation performed for completion of project. For the purpose of ease the project was divided in two Phases as stated:
I-(Material testing): It involves material testing for checking the suitability of the material as a construction material.The entire test was conducted on processed samples to get desirable output. II-( Cube Testing): It involves a series of operations
including material sorting, processing , batching , mixing , shuttering , curing and testing under standard conditions.
2.1. - (Material Testing)
The property of any composite material is highly influenced by the characteristics of its component. Thus the properties of the component are tested for various parameters such as Durability, Hardness, Porosity, Water absorption capacity , Impact resistance , gradual load resistance , Gradation and other such parameters . The basic elements of construction and testing of the cubes for specific reading can be obtained only if the results of quality checks are nearby the standard range.
a) Tests on coarse aggregate:
Test for specific gravity: Apparatus: Pycnometer
Pycnometer: It’s a glass jar with a brass cap with hole to drain water one’s the sample is saturated.
© 2017, IRJET | Impact Factor value: 5.181 | ISO 9001:2008 Certified Journal | Page 915 It’s a simple glass container with water tight arrangement by
rubber rings, a conical copper top cap. It weights nearly 660gm.
Observations:
1. Weight of empty pycnometer (W1) = 660gm
2. Weight of pycnometer+weight of aggregate (W2) = 960gm
3. Weight of pycnometer+weight of water weight of water (W3) = 1680gm
4. Weight of pycnometer+ weight of water (W4) = 1480gm.
Formula:
Specific Gravity = (W2-W1)/ {(W2-W1)-(W3-W4)}
Calculations:
[image:2.595.301.562.227.440.2] [image:2.595.300.560.257.681.2] [image:2.595.29.289.287.463.2]Specific Gravity = (960-660)/ {(960-660)-(1680-1480)} = 3 Hence for SAMPLE A specific gravity was 3.
Table No. 2.1Observations for three samples are detailed below:
Sr.no W1 (gm.
) W2 (gm. )
W3 (gm. )
W4 (gm. )
Specific gravity
Average value
SAMPLE A 660 960 1680 1480 3
(3+2.88+2.87 5)/3
=2.918
SAMPLE B 660 920 1650 1480 2.88
SAMPLE C 660 890 1630 1480 2.875
Result: The specific gravity of the given coarse aggregate is found to be 2.918 which are nearly to the standard values.
b)Test on Sieve analysis:
The test was conducted on the basis of sieves available and size of aggregate chosen as preferable size of aggregate is 20MM.hence sieves with pore size less than 20MM is taken into consideration.
Apparatus: IS a sieve for coarse aggregate
Figure No.2.3 IS sieves for coarse aggregate
I.S Sieves for sizes less than 20 MM was preferred for sieve analysis as the aggregate to be used is of size range 20MM and less. The sieves mesh is made of square pores in metal sheet instead of wire mesh as they me break easily during sieving action.
Observations:
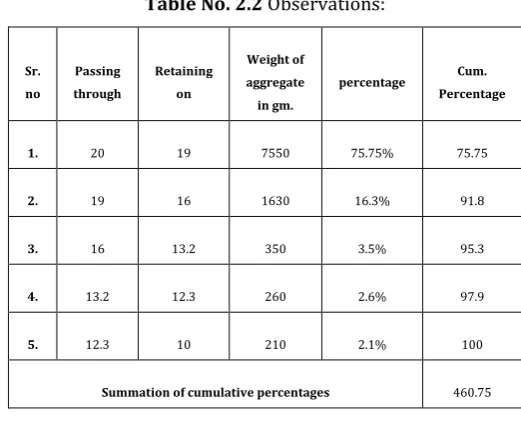
[image:2.595.54.270.597.745.2]1. Initial weight of sample taken (W) = 10kg. Observation table: 1. for Sample A
Table No. 2.2 Observations:
Sr. no
Passing through
Retaining on
Weight of aggregate in gm.
percentage Cum. Percentage
1. 20 19 7550 75.75% 75.75
2. 19 16 1630 16.3% 91.8
3. 16 13.2 350 3.5% 95.3
4. 13.2 12.3 260 2.6% 97.9
5. 12.3 10 210 2.1% 100
Summation of cumulative percentages 460.75
2. for Sample B
Table No. 2.3 Observation:
Sr. no
Passing through
Retaining on
Weight of aggregate in gm.
Percentage Cum. Percentage
1. 20 19 6970 69.7% 69.7
2. 19 16 2100 21% 90.7
3. 16 13.2 330 3.3% 94
4. 13.2 12.3 310 3.1% 97.1
5. 12.3 10 290 2.9% 100
Summation of cumulative percentage 451.5
Result: Maximum percentage of aggregate is retained on 19MM IS sieve, fluctuation in readings are seen due to presence of chippings and flaky material.
© 2017, IRJET | Impact Factor value: 5.181 | ISO 9001:2008 Certified Journal | Page 916 Average value = 4.555+5 = 9.555 (additional 5 for sieves
with zero retained weight i.e. 80,40,20,4.75,2.36 mm.
Test on Crushing value:
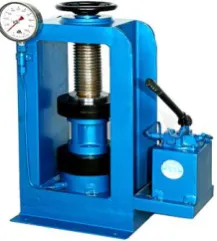
[image:3.595.110.219.195.316.2]Apparatus: Compression testing machine
Figure No.2.4Compression Testing Machine
The compression testing machine used for the test was hand operated with a maximum reading of 1000 KN, however a load of 400 KN was to applied within 10 minute time.
CTM confirming to IS 14858-2000 should be used for best results.
Observations:
1. Weight of mould (WM) = 10940gm
2. Weight of Mould+aggregate (WT) = 14460gm
3. Weight of sample A (Y) = (WT-WM) = (14460-10940) =
3520 gm.
4. Weight of sample A after test (Wa) = 2390gm
5. Weight of sample to be sieved (W) = 1130gm
6. Weight of sample passed through 2.36MM IS sieve(X) = 980gm
Formula:
Crushing value = [weight of sample passing 2.36 MM sieve]/ [Total weight of sample taken]
= (X/Y) x100
= {(980)/ (3520)}x100 = 27.84
Hence crushing value for Sample A is found to be 27.84
Table No.2.4Observation table for other samples:
Result: Hence the average crushing value computed from 3 samples of varying weight is found to be 28.305.
[image:3.595.194.555.259.791.2] Test for flakiness Index: Apparatus: Thickness gauge
Figure No. 2.5 Thickness Gauge Table No. 2.5Observation table:
S.no
Passing through IS sieve
Retaining on IS sieve
Weight of fraction consisting
at least 25 pieces
Thickness gauge sizes of
10.6 in (MM)
Weight of aggregate passing through gauge
1. 65 50 0 33.9 0
2. 50 40 361 27 0
3. 40 25 10410 21.45 108
4. 25 20 4500 13.5 1108
5. 20 16 2083 10.8 500
6. 16 12.5 82 8.55 316
7. 12.5 10 0 6.75 21
8. 10 6.3 0 4.89 0
Summation 17421 2053
Sr.no Y(gm.) Wa(gm.) W(gm.) X(gm.) Crushing value Average value
Sample
A 3520 2390 1130 980 27.84
(27.84+27.575+2 9.5)/3 =28.305
Sample
B 3300 2430 1060 910 27.575
Sample
© 2017, IRJET | Impact Factor value: 5.181 | ISO 9001:2008 Certified Journal | Page 917 Calculation: Flakiness index = {Total weight passing
through gauge}/ {Total weight of sample}
= {(2053)/ (17420)}*100 = 11.78%
Result: The flakiness index of sample is found to be 11.78%.
A) Tests on Plastic coarse aggregate (PCA)
Test for crushing value :
Observations:
1. Weight of mould (WM) = 10940gm
2. Weight of Mould + aggregate (WT) = 11300gm
3. Weight of sample A (Y) = (WT-WM) = (11300-10940) = 360
gm.
4. Weight of sample A after test (Wa) = 300gm
5. Weight of sample to be sieved (W) = 60gm
6. Weight of sample passed through 2.36MM IS sieve(X) = 40gm
Formula:
Crushing value = [weight of sample passing 2.36 MM sieve]/ [Total weight of sample taken]
= (X/Y)x100
= {(40)/ (360)}x100 =11.11%
[image:4.595.298.567.183.330.2]Hence crushing value for Sample A is found to be 11.11%. Table No.2.6Observation table for other samples:
Result: Hence the average crushing value computed from 3 samples of varying weight is found to be 10.235
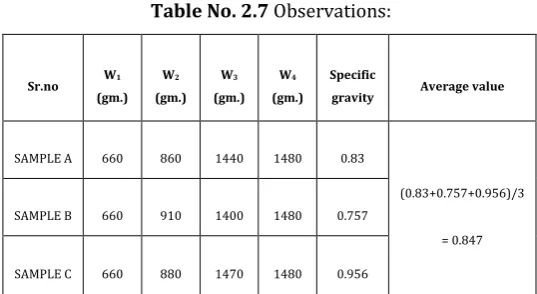
Test for specific Gravity: Observations:
1. Weight of empty pycnometer (W1) = 660gm
2. Weight of pycnometer+weight of aggregate (W2) = 860gm
3. Weight of pycnometer + weight of water weight of water (W3) = 1440gm
4. Weight of pycnometer+ weight of water (W4) =1480gm.
Formula:
Specific Gravity = (W2-W1)/ {(W2-W1)-(W3-W4)}
Calculations:
Specific Gravity = (860-660)/ {(860-660)-(1440-1480)} = 0.83
Hence for SAMPLE A specific gravity was 0.83.
Table No. 2.7 Observations:
Sr.no W1 (gm.)
W2
(gm.) W3
(gm.) W4
(gm.)
Specific
gravity Average value
SAMPLE A 660 860 1440 1480 0.83
(0.83+0.757+0.956)/3
= 0.847
SAMPLE B 660 910 1400 1480 0.757
SAMPLE C 660 880 1470 1480 0.956
Result: The specific gravity of the given coarse aggregate is found to be 0.847.
B) Tests for Fine aggregate:
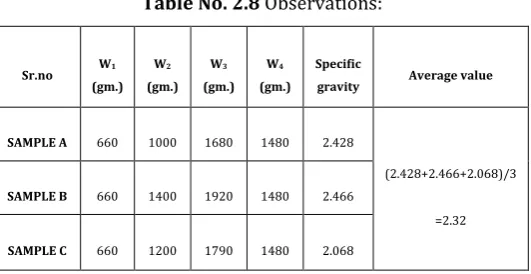
Test on Specific Gravity: Observations:
1. Weight of empty pycnometer (W1) = 660gm
2. Weight of pycnometer + weight of aggregate (W2) =
1000m
3. Weight of pycnometer + weight of water weight of water (W3) = 1680gm
4. Weight of pycnometer+ weight of water (W4) =1480gm.
Formula:
Specific Gravity = (W2-W1)/ {(W2-W1)-(W3-W4)}
Calculations:
Specific Gravity = (1000-660)/ {(1000-660)-(1680-1480)} = 2.428
Hence for SAMPLE A specific gravity was 2.428.
Sr.no Y(gm.) Wa(gm.) W(gm.) X(gm.)
Crushing
value Average value
Sample
A 360 300 60 40 11.11
(11.11+7.692+1 1.904)
/3 =10.235
Sample
B 390 340 50 30 7.692
Sample
© 2017, IRJET | Impact Factor value: 5.181 | ISO 9001:2008 Certified Journal | Page 918 Table No. 2.8 Observations:
Sr.no W1 (gm.)
W2
(gm.) W3
(gm.) W4
(gm.)
Specific
gravity Average value
SAMPLE A 660 1000 1680 1480 2.428
(2.428+2.466+2.068)/3
=2.32
SAMPLE B 660 1400 1920 1480 2.466
SAMPLE C 660 1200 1790 1480 2.068
Result: The specific gravity of the given coarse aggregate is found to be 2.32
3.RESULT
& CONCLUSIONS
A. Comparison between workability: The workability of the concrete under same amount of water is a necessary factor to study the amount of compaction required at the site. Further it determines whether the machine compaction is required or not if the concrete so obtained has a low workability.
CHART NO.1- Comparison in Workability of mixtures
0 5 10 15 20 25 30
SM20 B10M20 B15M20 P5M20 P10M20 CM20
Workability
Workability of
Mixture
The study of compressive strength of the cubes showed that maximum compressive strength achieved at the end of 21 days was for coarse aggregate replaced concrete with 10% of plastic coarse aggregate, the comparative strength of the cube was found to be 1.57% more than that of the Ordinary M20 grade. While the combine replacement of showed drastic decrease in strength by 10.27%.
The workability of the Bed ash containing samples were found to be more than that of the ordinary cubes with excess of water requirement, further the workability of the concrete reduced when plastic coarse aggregate where introduced.
The effects of the additives are mostly positive although the use of bed ash more than 10% showed decrease in compressive strength.
On the other hand substitution of Bed ash up to 10% showed increase in flexural strength by 14.8 %.And other samples of substitution showed decrease in flexural strength.
In all the use of Bed ash is beneficial upto 10% ,while the use of plastic aggregate up to 10% is possible. However the combined replacement of the coarse and fine aggregate by bed ash and plastic aggregate is not beneficial.
REFERENCES
1. Anzar Hameed ,” REPLACEMENT OF NATURAL SAND
WITH EFFICIENT ALTERNATIVE”, MirAnzar Hamid Mir Int. Journal of Engineering Researches and Applications, March 2015.
2. Dilip Kumar , Aashish Gupta,” USE OF BOTTAM ASH IN THE REPLACEMENT OF FINE AGGREGATE FOR MAKING CONCRETE”, International Journal Of Current Engineering and Technology, December 2014.
3. GaurawVerma, Mohd. Aafaq khan and Mr.
Abhishekkumar, “ EFFECT OF WASTE PLASTIC AS PARTIAL REPLACEMENT OF AGGREGATE IN
CONCRETE”,International Research Journal of
Engineering and Technology (IRJET),, 2 Feb 2016.
4. International Journal of Current Engineering and Technology, vol.4, No.6 (Dec 2014)
5. IS code for material testing:
a)IS 10262-2009 – Concrete design – for estimation of water and characteristic strength
b)IS 383-1970- for specification for fine aggregate from natural sources for concrete
c)IS 12269-1987-for Portland cement,53 grade specification
d) IS 2386-1963- for methods of test of coarse aggregate
6. T.Subramani,V. K. Pugal,”EXPERIMENTAL STUDY ON PLASTIC WASTE AS A COARSE AGGREGATE FOR STRUCTUURAL CONCRETE”, International journal of Application or Innovation in Engineering & Management(IJAIEM) 5 May 2015
7. Y.Aggrawal and S.M Gupta,”EFFECT OF BOTTAM ASH AS A REPLACEMENT OF FINE AGGREGATE”,P.Aggrawal , Asian journal of civil engineering (Building and housing), 2007.
W
o
rka
bi
lity
in
C
M