© 2017, IRJET | Impact Factor value: 5.181 | ISO 9001:2008 Certified Journal | Page 1547
LTE Handover Parameter Optimization for Self-Configuring and
Self-Healing networks
Meghashree D
1, N Shesha Prasad
21
M.Tech Student,
2Associate Professor
Department of Electronics and Communication Engineering, BNM Institute of Technology, Bangalore, India
---***---Abstract -
This paper includes an optimization ofparameters for LTE Handover. Self-Configuring and Self- Healing networks are considered, and parameter optimization is done for the same considering Omnidirectional, Patterned ASCII 2D, Patterned ASCII 3D, Patterned NSMA antennas .The result of optimization is shown in terms of Throughput and Network delivery delay for each of the antennas. Conclusions are drawn out by comparing all the antennas and results are tabulated.
Key Words: Self-Configuring Network, Self-Healing
Network, LTE, handover, time to trigger, hysteresis
1. INTRODUCTION
Long Term Evolution (LTE) is a 4G wireless broadband technology developed by the Third Generation Partnership Project (3GPP) as an extension of UMTS. LTE is mainly designed for high speed data applications both in the uplink and downlink. LTE network offers about 300Mbps data rate in the downlink and about 75 Mbps in the uplink.
Self-configuration mechanism is the capability to configure automatically a newly deployed station to achieve the necessary basic configuration for network operation. Whereas the self-optimize is the process where the User Equipment (UE) and the base station (eNB) measurements are employed to automatically optimize the network operations. Self-healing refers to the capability of the network to detect fault, diagnose them and to perform fault recovery action.
A. Different types of Antenna’s
Antenna is an electrical device which converts electric power into radio waves, and vice versa. It is usually used with a radio transmitter or radio receiver. In transmission, a radio transmitter supplies an electric current oscillating at radio frequency to the antenna's terminals, and the antenna radiates the energy from the current as electromagnetic waves (radio waves). In reception, an antenna intercepts some of the power of an electromagnetic wave in order to produce a tiny voltage at its terminals
which is applied to the receiver to be amplified. Antennas can be designed to transmit and receive radio waves in all horizontal directions equally (omnidirectional antennas) or preferentially in a particular specified direction (directional antennas). Omnidirectional antenna is the basic antenna which yields the same antenna gain irrespective of the direction of the transmitted or received signal. The Patterned antenna transmits or receives according to a particular pattern specified in the pattern file. Antenna pattern files can be specified in Open-ASCII (2-D and 3-D) and NSMA formats, in addition to the traditional format.
B. LTE Handover in SON
A handover is a process in which connected cellular call is transferred from one cell site to another without disconnecting the session. By adopting the Self-Organizing Network (SON) feature, the LTE handover management for the serving cell and the neighbouring cell can be optimized. These optimizations were important in order to minimize HO failure rate. HO process in LTE can be observed through the Eventa3. Eventa3 is defined as the triggering event when a neighbouring cell offset becomes better than the serving cell. The parameter that define trigger include: a3offset, Hyteresisa3 (Hys) and Time-To-Trigger (TTT) values. The role of a3offset is to ensure the serving cell look better than its current measurement in comparison to neighbouring cell. Meanwhile Hysteresisa3 role is to make the measured neighbouring cell look worse than measured to ensure it is really strong before the User Equipment (UE) decides to send a measurement report to initiate a HO. Time-To-Trigger’s role is to avoid HO Ping-Pong effect. There are three ways of optimizing HO in LTE by:
1) Modifying the parameter a3offset and hysteresisa3, 2) Changing the parameter Time-To-Trigger and 3) Modifying the parameter filter coefficient for eventa3.
C. Types of handover procedure in downlink
© 2017, IRJET | Impact Factor value: 5.181 | ISO 9001:2008 Certified Journal | Page 1548
for UEs in active mode which are the S1 and X2 handoverprocedures. The X2-handover procedure is normally used for the inter-eNodeB handover to balance network load and prevent interference. In the preparation phase, the UE needs to send measurement reports periodically to the source eNodeB. Based on these reports, the source eNodeB will decide to which target eNodeB the UE should be handed over. Besides the measurement reports, other criteria are also considered by the source eNodeB before a control message is sent to the target eNodeB to prepare for the handover. Upon receiving the control message requesting to prepare for handover, the target eNodeB will prepare a buffer for the UE. Once the preparation phase is completed, a handover command control message is sent by the source eNodeB to the UE in the execution phase to notify the UE that it is going to be handed over to another eNodeB.
Upon receiving the message, the UE will disconnect itself from the source eNodeB and request for connection with the target eNodeB. At the same time, the source eNodeB forwards all packets of the UE to the target eNodeB. These packets are queued by the target eNodeB in the UE buffer. Once the UE has successfully connected to the target eNodeB, the target eNodeB transmits all the buffered packets of the UE followed by the incoming packets from the target gateway. The handover procedure moves to the completion phase after the UE sends to the target eNodeB a handover complete message that indicates this handover is completed. The main purposes of the completion phase are to release all the resources used by the UE at the source eNodeB and to notify the upper layer to switch the path of the packet to the target eNodeB. Therefore, the target eNodeB needs to inform the source eNodeB to release all resources from the UE and the target MME to execute path switching to the target eNodeB, respectively.
2. Methodology
In this section, the process of optimizing the Eventa3 parameters is discussed. There are two phases in the methodology, where in the first phase the value of Hysteresisa3 (Hys) is fixed to 4dB while the values of Time-To-Trigger (TTT) are set at 40ms, 80ms, 160ms, 256ms, 320ms and 480ms. The first simulation was run with the value of Hysteresisa3 is set at 4dB while Time-To-Trigger is set at 40ms. The performance of handover algorithm was observed and data regarding the network performance was recorded and tabulate.
Then in the next phase the value for Time-To-Trigger is permanently set to 320ms, while the values of Hysteresisa3 were varied. The values of Hysteresisa3 start at 0.5dB up to 5dB. The topology setting was reset for the next part of handover optimization testing. First, the value of TTT was set to 320ms and the Hys value is set at 0.5dB. The
simulation was run and the results from this simulation were recorded.
The simulations were repeated with different values of Hys until the value reached 5dB. Finally, all the recorded results were analyzed to evaluate the LTE network performance in terms of throughput and delay when the handover parameters were being optimized.
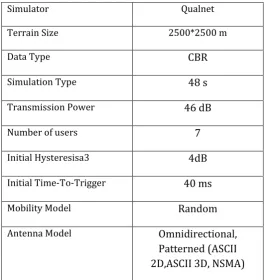
[image:2.595.301.566.330.611.2]Table -1 shows the required parameter setting and configuration required for running the LTE HO scenario in Qualnet. The network simulation scenarios are set as shown in the table. The simulation time was set for 48 seconds to observe the overall network performance as well as the arrival time for all UE. The initial starting operating value for Hys is 4dB and TTT is 40ms. These initial HO parameter values are selected since it already gives a good system performance for fixed HO point.
Table -1: Simulation Parameter
Simulator Qualnet
Terrain Size 2500*2500 m
Data Type
CBR
Simulation Type
48 s
Transmission Power
46 dB
Number of users
7
Initial Hysteresisa3
4dB
Initial Time-To-Trigger
40 ms
Mobility Model
Random
Antenna Model
Omnidirectional,
Patterned (ASCII
2D,ASCII 3D, NSMA)
© 2017, IRJET | Impact Factor value: 5.181 | ISO 9001:2008 Certified Journal | Page 1549
Table -2: Modification of Hys and TTTHys(dB) TTT(ms)
First Phase of Simulation
4
40 80 160 256 320 480
Second Phase of Simulation
0.5
320 1.0
2.0 3.0 4.0 5.0
3. Simulation Results
This section consists of results of simulation. In total there was 49 simulation runs including the initial simulation to observe the handover performance before deciding the best optimize handover parameters. For each type of antenna 12 simulation are run by varying TTT and Hys and the results are tabulated and graphs are analyzed.
A. Simulation Scenario
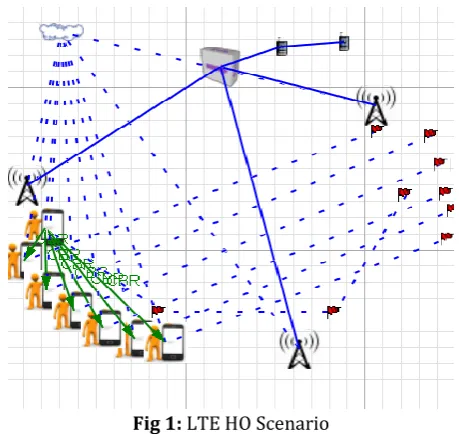
The above HO optimization has been studied by using simulation scenario that consists of 7 radio cells organized for 3 base stations site within the area of 2.5km x 2.5km. Fig 1 shows the LTE network simulation scenario developed by using the QualNet network simulator. Node 1 is their SGWMME node. SGWMME is the combination node between the Serving Gateway (SGW) and Mobility Management Entity (MME). SGW shall forward the data that come from base station and packet data network gateway. MME is used to control the high-level operation such as choosing the right SGW for the UE and authenticating them. MME also responsible to control the mobility between the LTE networks with other access networks.
Node 2, node 3 and node 4 are eNB1, eNB2 and eNB3 respectively that represent the base station. Meanwhile node 12 is their core network (CN). The purpose of CN is to communicate with the outside world network through their packet data network. Internet, private corporate network and etc. are the example of the packet data network of outside world.
As the simulation starts, each UE move towards their destination. As they approach eNB1, all UEs make radio connection to base station as all UEs have a stable connection with eNB1 as all are still in the eNB1 network
coverage. However, after roaming far away from the eNB1 station, the UE starts to lose the network coverage. At this time, a UE measurement report has been sent to the nearest cells in order to allow HO process. After the confirmation between the target cell and the UE, all UEs start to release their connection and perform the HO process at different time as they come closer to their target base station.
Fig 1: LTE HO Scenario
Fig.1 shows a LTE handover scenario. There are 3 base stations placed on the canvas to cover the entire space on the canvas.7 UE’s are placed near eNB 1. As they start to move towards their destination, they consequently handover from one eNB to the nearby eNB.
Node 1 is the SGW/MME. Node 12 is the CN from which control signals are fetched. UE’s are arranged in such a way that some of them get signals from one base station and others get signals from next neighbouring base station.
Self –Configuring scenario is considered first, in a way that it starts receiving signals automatically from nearby base stations as they start to move from source to destination.
Same scenario is considered for Self-Healing networks, the only change is that one of the base station is turned off. The results are compared with previous network and results are drawn.
B. Optimization for Self-Configuring networks
[image:3.595.323.553.194.411.2]© 2017, IRJET | Impact Factor value: 5.181 | ISO 9001:2008 Certified Journal | Page 1550
Chart -1: Throughput for fixed HysChart -2: Network delivery delay for fixed Hys
Chart-1 shows that for a fixed Hys value of 4db, Patterned NSMA antenna shows better throughput than all other antennas. The performance of all the antennas gradually increases among the eNB’s. Patterned 3D antenna is the poor performer.
Chart-2 shows network delivery delay for fixed Hys of 4db. Delay is minimum for Patterned 3D antenna which undergoes less congestion due to the less coverage area it spreads. Patterned NSMA is the next best performer even after covering the required area.
Chart -3: Throughput for fixed TTT
Chart -4: Network delivery delay for fixed TTT
Chart-3 shows throughput values for fixed TTT parameter. Patterned 2D antenna shows better throughput for eNB1 and eNB2. Patterned NSMA shows better performance for eNB3.On an average Patterned NSMA antenna shows better throughput for each of the base stations.
Chart-4 shows the network delivery delay for fixed TTT value. Patterned 3D shows lesser delay, Patterned NSMA and 2D shows almost equal delivery delay for successful HO.
C. Optimization for Self-healing networks
Same scenario was used for Self-Healing network, but eNB1 was disabled so as to create a self-healing environment. eNB1 is disabled by setting its Transmission power to zero. Here mobile nodes automatically connect to near-by eNB’s while travelling from source to destination. Considering individual antenna’s and for each antenna 12 simulation was run. Throughput and network delivery delay values are noted down. The results are clubbed and comparison are drawn out for all the antennas.
Chart-5 shows Throughput value for constant Hys parameter. As the eNB1 is disabled, throughput across eNB1 remains zero. Patterned NSMA antenna shows better throughput for varying TTT.
© 2017, IRJET | Impact Factor value: 5.181 | ISO 9001:2008 Certified Journal | Page 1551
Chart -5: Throughput for fixed HysChart -6: Network delivery delay for fixed Hys
Chart-7 shows the throughput value for fixed TTT. Patterned NSMA and Omnidirectional antenna shows better throughput for varying Hys parameter.
Chart -7: Throughput for fixed TTT
Chart-8 shows network delivery delay for fixed TTT. Patterned NSMA and Patterned 2D shows minimum delay with varying Hys parameter. It is to be observed that for self-healing networks, since eNB1 is disabled, all the UE automatically fetch signals from other nearby base stations.
The throughput of Self-Configuring networks are more
compared to Self-Healing networks as there are more dropped out signals in case of Self-Healing. Network delivery delay for Self-Healing networks is more as they are highly congested.
Chart -8: Network delivery delay for fixed TTT
4. Conclusion
The work carried out includes optimizing LTE handover parameters for Self-Configuring and Self-Healing networks considering Omnidirectional and different types of patterned antennas. It is observed that the performance of patterned NSMA and Omnidirectional antenna are better for the Throughput , and Patterned NSMA and Patterned 2D antennas are better for considering network delivery delay. Patterned 3D antenna is the poor performer.
Acknowledgement
My sincere thanks to my guide Mr. N Shesha Prasad, Associate Professor, BNMIT, Bangalore and Kedareeswari G, Senior Software Engineer and staff members of Nihon Communication Solutions (P) Ltd, Bangalore for their most valuable suggestions in conducting this project.
REFERENCES
[1] Ili Nadia Md Isa, Mohd Dani Baba, Ruhani Ab Rahman, Azita Laily Yusof , “Self-organising network based handover mechanism for LTE Networks”, International Conference on Computer, Communication, and Control Technology , 2015.
[2] I. Ismail, M.D. Baba and R.E. Zaini, “Femtocell: A Survey on Development in LTE Network System”, Proceeding of Int Conf on Innovative Trends in Multidisciplinary Academic Research (ITMAR), 20-21 Oct 2014.
© 2017, IRJET | Impact Factor value: 5.181 | ISO 9001:2008 Certified Journal | Page 1552
[4] Asghar, M.Z.; Hamalainen, S.; Ristaniemi, T., "Self-healingframework for LTE networks," Computer Aided Modeling and Design of Communication Links and Networks (CAMAD), 2012 IEEE 17th International Workshop on , vol., no., pp.159,161, 17-19 Sept. 2012
[5] Zia, N.; Mitschele-Thiel, A., "Self-organized neighborhood mobility load balancing for LTE networks," Wireless Days (WD), 2013 IFIP , vol., no., pp.1,6, 13-15 Nov. 2013
[6] Ewe, L.; Bakker, H., "Base station distributed handover optimization in LTE self-organizing networks," Personal Indoor and Mobile Radio Communications (PIMRC), 2011 IEEE 22nd International Symposium on , vol., no., pp.243,247, 11-14 Sept. 2011.
[7] Sinclair, N.; Harle, D.; Glover, I.A.; Irvine, J.; Atkinson, R.C., "Parameter Optimization for LTE Handover Using an Advanced SOM Algorithm," Vehicular Technology Conference (VTC Spring), 2013 IEEE 77th , vol., no., pp.1,6, 2-5 June 2013.
[8] Huaining Ge, Xiangming Wen, Wei Zheng, Zhaoming Lu. Bo Wang, “A History-based Handover Prediction for LTE Systems”, Computer Network and Multimedia Technology, 2009 CNMT 2009 Int Symposium on, pp 1-4, 18-20 Jan 2009.
AUTHOR’S
BIOGRAPHY
Meghashree D, Did her B.E. from BCE, Shravanabelagola, Karnataka,
India and M.Tech
in VLSI and Embedded Systems from BNMIT, Bangalore, Karnataka, India. This paper is based on the project work carried out under the guidance of Associate Professor N Shesha Prasad.