© 2018, IRJET | Impact Factor value: 6.171 | ISO 9001:2008 Certified Journal | Page 4174
A parametric study on fragility analysis of fixed and flexible base
structure under earthquake forces
Anupama Rani
1, Vivek Singh
21
Assistant Professor, Dept. Of Civil Engineering, JIMSEMTC Greater Noida, U.P, India
2Assistant Professor, Dept. Of Civil Engineering, JIMSEMTC Greater Noida, U.P, India country
---***---Abstract -
A simplified fragility analysis of a steel building frame is presented which can be used for preliminary estimate of its probability of failure. The risk analysis procedure uses the format of probabilistic Risk Analysis (PRA). Probabilistic Risk Analysis (PRA) procedure is presented in regions for which a very little recorded earthquake data is available. The first part of study considers site specific response spectra for regions, where little or no earthquake data is recorded is taken into account which is considered as seismic input. In the second part of the study a simplified PRA procedure is used for obtaining the probability of failure of the structure. The steel building frame is modelled as a 2D frame and Pushover analysis is then carried out to identify the pattern of hinges formation by using SAP 2000. The proposed method of analysis is applied to a 9-storey steel building frame for obtaining its probability of failure .The response of the steel frame is obtained by response spectrum method of analysis for multi-degree of freedom system. The fragility curves for the frame failure were generated for a number of parametric variations. The parameters include base flexibility of the structure, height of the structure, coefficient of variation of the uncertainty factors, variation of ductility factor, inelastic action, concentration of hinges, earthquake input and soil conditions etc. The study shows that all the parameters considered in the study have considerable effect on the probability of failure.Key Words: Probability of failure, Probabilistic Risk Analysis, Response Spectra, Pushover Analysis, Fragility Curves, Ductility Factor, Hinges, Soil conditions
1.INTRODUCTION
The geographical statistics of India showed that almost 54% of the land is vulnerable to earthquakes. Amongst the natural hazards, earthquakes are the most destructive. Earthquakes occur due to sudden transient motion of ground due to the release of elastic energy .They can cause large scale loss of life, property, and disrupts essential services such as water services such as water supply, sewerage systems, communication and power, transport etc. The aftermath of which destabilise the economic and social structure of the nation. The structural analysis of earthquake engineering is a hectic task because the problem is dynamic and usually non – linear and the input data (structural properties and ground motions) are random and uncertain.
The recent devastating earthquakes have exposed the vulnerability of the buildings in India. The Bhuj earthquake
(2001) demonstrated that the medium through which seismic waves propagate amplifies the ground motion. Hence, the local sites effect is always to be considered. A mitigation plan is aimed at providing appropriate steps in minimising the damages and loss of lives, by identifying vulnerable structures, which are not properly designed and constructed or which have lost their strength due to passage of time. Knowing the seismic risk for a structure can allow for proper budgetary planning, raise public awareness, and help with assessment and allocation of the necessary manpower for mitigation and disaster management operations, educate the public and professionals on preparedness and mitigation, prioritize retrofit applications, perform damage and loss estimations, and make good retrofit decisions for civil structures .
The hazard analysis consists of the process of quantitatively estimating the ground motion at a site or region of interest based on the characteristics of surrounding seismic sources. The hazard analysis is either a curve showing the exceedance probabilities of various ground motions at a site, or a hazard map that shows the estimated magnitude distribution of ground motions having a specific exceedance probability over a specified time period for a region. Local site effects are essential for determining the ground motion parameters as well as the potential of liquefaction and ground failure. The influence of the underlying soil on the local amplification of earthquake shaking is called the site effect. For this reason local site conditions are often considered in the development of a site-specific response spectrum in order to be used in the structural analysis and design.
A timely assessment is necessary to establish the need for strengthening/retrofitting of the structures to enhance their strength to withstand major hazards. Seismic vulnerability analysis of structures in regions of moderate to high seismicity, therefore, received considerable attention in recent years. Seismic risk analysis of all important and speciality structures like hospitals, nuclear power plants, long span bridges, dams, lifeline structures etc., are now invariably carried out in zones of high seismicity.
1.1 Vulnerability Analysis of Structures
© 2018, IRJET | Impact Factor value: 6.171 | ISO 9001:2008 Certified Journal | Page 4175 motion intensities. The main objective of vulnerability
analysis is to determine the probability of failure of structures, failure being defined by some criteria. Different forms of vulnerability analysis of structures for seismic forces include analysis for probability of first passage failure, probability of joint or component failure, determination of damage probability matrix and probabilistic risk assessment. The latter is commonly performed by using the Probabilistic Risk Analysis (PRA) procedure. PRA procedure has been widely accepted as a powerful method for the determination of safety of structures against seismic hazard.
Probability of first passage failure deals with the probability of exceedance of a threshold level of stress for any response quantity of interest, for the first time over an interval of time. This is obtained by using the method of crossing analysis of the random vibration theory. Probability of joint or component failure deals with the probability of exceedance of the limit state of the joint or component of the structure for the possible earthquakes in future. Probabilistic Risk Assessment (PRA) procedure has three components namely, (i) Development of input (ii) Fragility analysis of structure, and (iii) Seismic risk evaluation of structures.
Vulnerability of structures to ground motion effects is often expressed in terms of fragility curves or damage functions that take into account the uncertainties in the seismic demand and structures capacity. A fragility analysis is an effective tool for risk assessment and vulnerability of structural systems. Fragility is the probability that a structure will exceed a certain damage level under certain ground motion intensity. The fragility analysis refers to the analysis of structures for finding their probabilities of failure for a given level of the peak ground acceleration. Fragility curve is an indicator of risk/vulnerability of the structure associated with certain level of peak ground acceleration during an earthquake. Rigorous fragility analysis is highly complex and computationally intensive. The complexity of the analysis involves many factors such as consideration of soil structure interaction, correct failure mode and failure criteria and different types of uncertainties involved in the risk analysis. As a result, several simplifications are made in the analysis. Since the fragility analysis for the complete structure is difficult to perform, either the main components of the structure or the idealised bare frame model of the structure are analysed.
Construction of fragility curves provides the key element in the estimation of the probability of various damage states in buildings as a function of seismic intensity. Fragility curves show the probability of a system reaching a limit state as a function of some measure of seismic intensity such as peak ground acceleration PGA. Fragility curves have become universal tools for determining the conditional probability of failure or the probability that structural demand (structural response) caused by various levels of seismic motions exceeds the capacity of the structure to resist a given damage state. The fragility curves are often generated assuming the demands of the structure follow a lognormal distribution. A fragility is defined as a conditional probability which provides the probability of a structure reaching or exceeding a specified limit state under a given earthquake intensity
level (i.e., spectral acceleration at the building fundamental period in the case of seismic hazards). As such, fragility curves are a measure of performance in probabilistic terms.The fragility of a structure is given as
Pf = P [ Sd/Sc ≥ 1 ] where, Sd = Structural Demand Sc = Structural Capacity The fragility curve, is a graphical representation of the seismic vulnerability of a structure. Fragility curves provide a graphical representation of exceeding a drift or damage state as a function of one or more seismic intensity measures (IM). An IM is the reference ground motion parameter against which the probability of exceedance of a given limit state is plotted. IMs are generally correlated well with the severity of ground shakings with the most common IMs for use in building loss assessment being: Spectral acceleration (Sa ),Peak Ground Acceleration (PGA),Peak Ground Velocity (PGV)
© 2018, IRJET | Impact Factor value: 6.171 | ISO 9001:2008 Certified Journal | Page 4176 which was the major focus to reduce the threats to the life
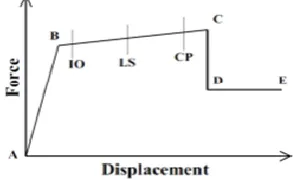
safety are also being considered. Such performance objectives may vary from ‘Collapse Prevention’ for the rare event of a large earthquake to an ‘Operational Level’ for frequent earthquakes of moderate size. The various performance levels along with their force-displacement characteristics are given below (shown in Fig 1)
The lateral force is applied at the deformed state of the general loading from point A. No hinges will formed before point B where structure will shows linear behaviour and after that one or more hinges will start to form. Software will shows hinges with following remarkable indication:
Immediate Occupancy (IO) – yielding of steel, significant cracking of concrete and non-structural damage will arises
Life Safety (LS) - damage of structural and non-structural components will starts. We have to make essential circulation routes accessible to minimize risk of injury and causality for this stage.
Collapse Prevention (CP) – This point ensure a small risk of partial or complete building collapse by limiting structural deformations and forces to the onset of significant strength and stiffness degradation.
Point C is the indication of ultimate capacity of the structure and Point D indicate residual strength for the structure. Complete failure will occur at point E.
Fig -1: Performance Levels of Building
Recent interests in the development of performance based codes for the design or rehabilitation of buildings in seismic active areas showed that an inelastic procedure commonly referred to as the pushover analysis is a viable method to assess damage vulnerability of buildings. Basically, a pushover analysis is a series of incremental static analysis carried out to develop a capacity curve for the building. Based on the capacity curve, a target displacement which is an estimate of the displacement that the design earthquake will produce on the building is determined. The extent of damage experienced by the structure at this target displacement is considered representative of the damage experienced by the building when subjected to design level ground shaking. Pushover analysis is a static, nonlinear procedure using simplified nonlinear technique to estimate seismic structural deformations. It is an incremental static analysis used to determine the force-displacement relationship, or the capacity curve, for a structure or structural element. The pushover analysis of a structure is a static non-linear analysis
under permanent vertical loads and gradually increasing lateral loads. The equivalent static lateral loads approximately represent earthquake induced forces. A plot of the total base shear versus top displacement in a structure is obtained by this analysis that would indicate any premature failure or weakness. The analysis is carried out up to failure, thus it enables determination of collapse load and ductility capacity. On a building frame, plastic rotation is monitored. Output generates a static-pushover curve which plots a strength-based parameter against deflection. Results provide insight into the ductile capacity of the structural system, and indicate the mechanism, load level, and deflection at which failure occurs.
Case Study of Non-Linear Static Analysis using SAP 2000 The recent advent of performance based design has brought the nonlinear static pushover analysis procedure to the forefront. Pushover analysis is a static, nonlinear procedure in which the magnitude of the structural loading is incrementally increased in accordance with a certain predefined pattern. With the increase in the magnitude of the loading, weak links and failure modes of the structure are found. Static pushover analysis is an attempt by the structural engineering profession to evaluate the real strength of the structure and it promises to be a useful and effective tool for performance based design. The ATC-40 and FEMA-273 documents have developed modelling procedures, acceptance criteria and analysis procedures for pushover analysis. These documents define force deformation criteria for hinges used in pushover analysis. As shown in Fig. 1, five points labelled A, B, C, D, and E are used to define the force deflection behaviour of the hinge and three points labelled IO, LS and CP are used to define the acceptance criteria for the hinge. (IO, LS and CP stand for Immediate Occupancy, Life Safety and Collapse Prevention respectively.) The values assigned to each of these points vary depending on the type of member as well as many other parameters defined in the ATC-40 and FEMA-273 documents. Pushover analysis is an efficient way to analyze the behaviour of the structure, highlighting the sequence of member cracking and yielding as the base shear value increases. This information then can be used for the evaluation of the performance of the structure and the locations with inelastic deformation. The primary benefit of pushover analysis is to obtain a measure of over strength and to obtain a sense of the general capacity of the structure to sustain inelastic deformation. The performance of the structure is evaluated based on the results obtained from the pushover analysis.
1.2 Need and Objective for Present Study
[image:3.595.91.238.410.500.2]© 2018, IRJET | Impact Factor value: 6.171 | ISO 9001:2008 Certified Journal | Page 4177 study is undertaken.The primary objective of the study is to
develop a simplified vulnerability analysis technique for buildings and structures in regions where enough earthquake data is not available, though the region is seismically active. The sensitivity of the seismic vulnerability of the structures to important parametric variations also forms an important part of the present investigation.
In specific terms the objectives of the study are : To find the capacity of frame and position of the last hinge formed leading to the failure of structure for a particular mechanism by pushover analysis. To present a simplified probabilistic risk analysis method for evaluating the fragility curves for steel building structures subjected to seismic excitation. To study the effect of base flexibility on the probability of failure of the structure. To study the effect different types of soils (soft and hard) on the probability of failure of the structure. To study the sensitivity of the probability of failure with the variation of some important parameters like uncertainty factors, ductility factor and variation of the height of the structure etc.
2. PROBABILISTIC RISK ASSESSMENT (PRA)
PROCEDURE FOR THE DEVELOPMENT OF
FRAGILITY CURVE
Seismic PRA procedure has three components namely: Development of site specific input, Fragility analysis of structure and Seismic risk evaluation of structure.PRA procedure for calculation of fragility curves requires: Seismic input, Determination of uncertainty factors and Determination of probability of failure.The response spectrum at different PGA (0.03g, 0.08g, 0.13g, 0.18g, 0.23g, 0.28g )as per IS 1893 corresponding to the free field ground motion is taken as the input to the structure. The fragility analysis refers to the analysis of structures for finding their probabilities of failure for a given peak ground acceleration (PGA). Thus, a fragility curve is an indicator of risk/vulnerability of the structure associated with certain level of peak ground acceleration (PGA) during an earthquake and it is a graphical representation of Peak Ground Acceleration (PGA) Vs Probability of failure of a structure under earthquake forces.
For the purpose of the study, the building frame is considered to be resting on a soil layer overlying a rock bed. The response spectrum at different PGA (0.03g, 0.08g, 0.13g, 0.18g, 0.23g, 0.28g )as per IS :1893-2002 corresponding to the free field ground motion is taken as the input to the structure.Both soft and hard soil conditions are considered for defining the seismic input to the structure. Response spectrum method of analysis is carried out to determine the mean response of both fixed and flexible base frame. Uncertainties considered in the risk analysis include those arising due to variation of ground motion, material properties, modelling, approximate method of analysis, energy dissipation because of ductile behaviour of structural elements. The probability of failure is obtained by first order second moment theory of reliability. An extensive parametric study is carried out on a nine storey steel frame to investigate
the effect of important parameters on the probability of failure.
The PRA procedure is explained by the flow chart shown in Fig.2. For obtaining the probability of failure, not only different uncertainties are to be included in the analysis but also most critical failure mechanism is to be identified which provides maximum probability of failure. Determination of probability of failure by including all uncertainty factors and by performing a rigorous non linear analysis tracing all possible mechanisms of failure is highly complex and computationally intensive for a multi degree framed structure subjected to combined vertical and earthquake lateral load. Therefore, some simplifications are made in the analysis procedure to develop a method, which can be readily used in practice for obtaining a preliminary estimate of the probability of failure as mentioned in the introduction. These simplifications are similar to those adopted by Takeda et al., 1989. The response spectrum at different PGA ( 0.03g, 0.08g, 0.13g, 0.18g, 0.23g, 0.28g )as per IS 1893 corresponding to the free field ground motion is taken as the ground input to thestructure at the bedrock level. Uncertainties of the free field ground motion due to uncertainties in input bedrock motion, soil properties are incorporated by defining a coefficient of variation for the response spectrum ordinates. Using the site specific response spectrum, response spectrum analysis is carried out to obtain a set of equivalent lateral loads. For this purpose, the structural properties and the superimposed dead and live loads are assumed to have their median values.
2.1 Seismic Input
The response spectrum at different PGA (0.03g, 0.08g, 0.13g, 0.18g, 0.23g, 0.28g )as per IS 1893 corresponding to the free field ground motion is taken as the input to the structure. Overlying soil medium resulting in the modified free field ground motion. For flexible base frame, the response spectrum analysis is carried out by the simple model that replaces the soil by an equivalent spring dashpot system. The soil damping and stiffness corresponding to the degrees of freedom shown in Tables 4.3 are considered frequency independent and are given by Veletsos and Wei, 1971.
KX = 8G r0 / (2-μ) ; CX = 4.8G r0 / (2-μ)
Kθ = 8G r0 / 3(1-μ) ; Cθ = 0.4G r03/ 3(1-μ)
KXθ = 8G r02/ (2-μ) ; CXθ = 0.4 G r02/ (2-μ)
Where, G is the shear modulus of rigidity, μ is Poisson ratio kept as 0.3. Depending upon value of V, representing the soil condition, the value of G is determined. As a result, both soil stiffness and damping vary with different soil conditions.
For the combined lateral and vertical loads, probability of failure for (full or partial) the collapse of the frame for an assumed mechanism of failure is determined by an equivalent lateral analysis. Determination of the probability of failure requires the computation of moment at a section of potential plastic hinge formation. This is carried in the following way.
© 2018, IRJET | Impact Factor value: 6.171 | ISO 9001:2008 Certified Journal | Page 4178 C. Moment Mc at section C is produced due to the
superimposed vertical and lateral loads and the plastic moments acting at the plastic hinges. Probability of failure for the assumed mechanism is determined based on the computed moment Mc, the moment capacity of section C and different uncertainties considered in the analysis. In this manner, probability of failure can be determined by assuming some other hinges to form at the last for the same mechanism of failure. The one which gives the highest value of the probability of failure (Pf) is considered for
determining Pffor the assumed mechanism.
2.2
Capacity of the Frame
A pushover analysis is performed to find the capacity of the frame by subjecting a structure to a monotonically increasing pattern of lateral loads, representing the inertial forces which would be experienced by the structure when subjected to ground shaking. Under incrementally increasing loads various structural elements may yield sequentially. Using pushover analysis a non linear force-displacement relationship can be determined.
2.3
Modelling Approach
The general finite element package SAP 2000 has been used for the analysis. A 2D dimensional model of structure has been created to undertake the non linear analysis. Beams and column are modelled as non linear frame elements with lumped plasticity at the start and the end of each element. SAP 2000 provides default-hinge properties and recommends PMM hinges for columns and M3 hinges for beams as described in FEMA-356.
2.4
Pushover Analysis
After designing and detailing the steel frame structure, a non linear pushover analysis is carried out for evaluating the structural seismic response. Pushover analysis is a static, nonlinear procedure in which the magnitude of the structural loading is incrementally increased in accordance with a predefined pattern. With the increase in the magnitude of the loading, weak links and failure modes of the structure are found. The loading is monotonic with the effects of the cyclic behaviour and load reversals being estimated by using a modified monotonic force – deformation criteria and with damping approximations. Static pushover analysis is an attempt by the structural engineering profession to evaluate the real strength of the structure and it promises to be a useful and an effective tool for performance based design. The applied lateral loads were accelerations in the x direction representing the forces that would be experienced by the structure when subjected to ground shaking. Under incrementally increasing loads some elements may yield sequentially. Consequently, at each event, the structures experience a stiffness change as shown
in Fig. 1, where IO, LS and CP stand for Immediate Occupancy, Life Safety and Collapse Prevention respectively.
2.5
Key Elements of The Pushover Analysis
Definition of plastic hinges: In SAP 2000, nonlinear behaviour is assumed to occur within frame elements at concentrated plastic hinges. The default types include an uncoupled moment hinge, an uncoupled shear hinge and a coupled axial force and biaxial bending moment hinges.
Definition of the control nodes: Control node is the node used to monitor displacements of the structure. Its displacement versus the base- shear forms the capacity (pushover) curve of the structure.
Developing the pushover curve: It includes the evaluation of the force distributions. To have a displacement similar or close to the actual displacement due to earthquake, it is important to consider a force displacement equivalent to the expected distribution of the inertial forces. Different forces distributions can be used to represent the earthquake load intensity. Estimation of the displacement demand: This is a crucial step when using pushover analysis. The control is pushed to reach the demand displacement which represents the maximum expected displacement resulting from the earthquake from the earthquake intensity under consideration.
Evaluation of the performance level: Performance evaluation is the main objective of a performance based design. A component or action is considered satisfactory if it meets a prescribed performance. The main output of pushover analysis is in terms of response demand versus capacity. If the demand curve intersects the capacity envelope near the elastic range, then the structure has a good resistance. If the demand curve intersects the capacity curve with little reserve of strength and deformation capacity, then it can be concluded that the structure will behave poorly during the imposed seismic excitation and need to be retrofitted to avoid future major damage or collapse.
2.6
Response Analysis of the Frame
© 2018, IRJET | Impact Factor value: 6.171 | ISO 9001:2008 Certified Journal | Page 4179 these storey shears, lateral load acting on the frame is back
calculated. For obtaining these lateral loads, the mean value of the material properties and the 50th percentile normalised response spectrum are used. The mean value of any response quantity is then obtained by performing a static analysis of the frame having plastic hinge (for determining the collapse state) under the computed lateral loads and the vertical loads.
2.7 Uncertainty Factors Considered for the
Evaluation of the Probability of Failure
As described before, the load action i.e. moment at any section of the frame is a random variable due to a number of uncertainties associated with earthquake loading, material properties, method of analysis etc. Similarly, the moment capacity of the section is also a random variable influenced by many uncertainties like uncertainty of material strength, ductility at the joints, damage concentration effect etc. The uncertainties can be defined as;
Factor F1 caters to the uncertainty of the input motion. The median value is unity and the logarithmic standard deviation β1 is taken as the ratio of two response values ( r84 and r50 ) corresponding to the input median value of PGA and median plus one standard deviation value is calculated as
β 1 = ln (r84 / r50)
Factor F2 caters to the uncertainty of the material property. The logarithmic standard deviation β2 is evaluated in the same manner as that for factor F1 .
Factor F3 caters to the uncertainty of the structural modelling which includes simplified model being used for soil structure interaction. The coefficient of variation of F3 ranges between 0.15 to 0.2 as obtained from several studies on the effect of structural modelling on response Takeda et al., 1989.
F4 is the factor accounting for the uncertainty resulting from the simplification of the method of analysis like, nonlinear analysis being replaced by equivalent linear analysis; dynamic analysis being replaced by equivalent static analysis etc. The coefficient of variation of F4 is assumed in the range of 0.1 to 0.15 Takeda et al, 1989.
The factor F5 , the energy absorption factor, caters to uncertainty due to the energy absorption during nonlinear excursion of a SDOF system. The median value is generally taken to be proportional to the Newmark's formula (2μ −1) with reduction factor of 0.6, where μ is the ductility factor. The coefficient of variation is taken about 0.2 Takeda et al, 1989.
F6 represents the uncertainty due to damage concentration effect of MDOF systems. The median value of F6 is taken between 0.6 to 1.25 Takeda et al, 1989. The coefficient of variation is assumed to be 0.1 Takeda et al, 1989.
2.8 Determination of Probability of Failure and
Fragility Curve
The load action i.e. moment at a section of the frame is a random variable due to a number of uncertainties associated
with earthquake loading, material properties, method of analysis etc. Similarly, the moment capacity of the section is also a random variable influenced by uncertainties like uncertainty of material strength, ductility at the joints and sections where plastification takes place, damage concentration effect etc. Although a rigorous nonlinear analysis is not performed the effect of ductility is introduced in the equivalent linear analysis by increasing the moment capacity of the section, where plastic hinge forms, by the energy absorption factor which is a function of the ductility. The moment induced at a section (called Resistance R) is a random variable considered to be a product of five random variables and is given by
R = M F1 F2 F3 F4
where, M is a random variable denoting the internal moment at the section produced by the vertical load, lateral load and internal plastic moments acting at the plastic hinges. M is considered as a random variable because of the uncertainties involved in the vertical load and plastic moments acting in the plastic hinge. F1, F2, F3 and F4 are the independent random variables representing deviations of the actual response from M. These deviations are produced due to uncertainties in earthquake loading, material properties, modelling and method of analysis. The random variables F1, F2, F3 and F4 are assumed to be log normally distributed having median value as unity. The lognormal standard deviation of resistance
σln R is given by
σln R = (β12 + β22 + β32 + β42 + βm2 )1/2
in which βi , i = 1 to 4 is the coefficient of variation of random variables Fi , i = 1 to 4 and βm is equal to the coefficient of variation of M which is also assumed to be log normally distributed. Similarly, capacity of the section is written as
C = Mp F5 F6
where, Mp is the random variable denoting the moment capacity; F5 and F6 are the two random variables representing deviations from the actual strength capacity to resist induced moment at the section. F5 and F6 are defined later. All the three random variables are assumed to be log normally distributed. Therefore, logarithmic standard deviation of C can be written as
σ ln C =(β52 + β62 + βMp2 )1/2
in which β5, β6 and βMp are coefficients of variation of F5, F6 and Mp respectively. The median values of F5, F6 and Mp are specified
First order second moment (FOSM) technique is used to calculate the probability of failure by assuming both resistance (R) and capacity (C) to be log normally distributed and by defining the probability of failure as
© 2018, IRJET | Impact Factor value: 6.171 | ISO 9001:2008 Certified Journal | Page 4180 Pf = P(C<R)
Pf = P[(C-R < 0)] = Ф (-β) = 1- Ф (β)
Where ,
in which C and R are median values of C and R respectively and Ф (β) is the reliability index. Probability of failure can be obtained from Ф (β), Ranganathan, 1990.
The following steps are adopted when performing the analysis:
(I) Potential sections of plastic hinges are identified for the expected mechanisms of failure of the frame (partial or total). This is obtained by a pushover analysis. The section where last hinge is formed is noted.
(II) The uncertainties involved in the problem are considered by multiplying relevant response, capacity and input parameters with some random factors.
(III) Probability of failure is calculated by the first order second moment (FOSM) theory of reliability.
(IV) By a limited trial search, the condition for which the maximum probability of failure is obtained is identified.
3. NUMERICAL STUDY
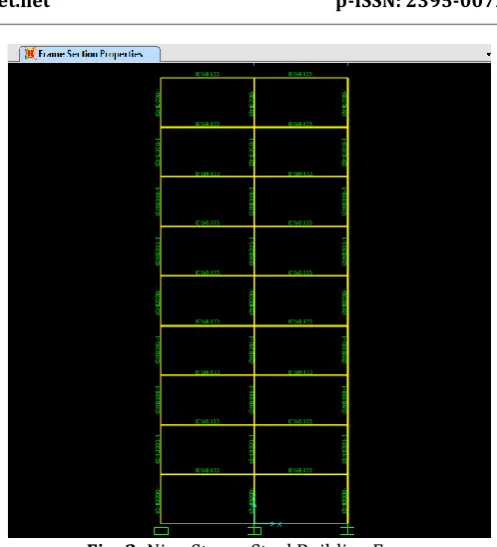
[image:7.595.305.554.59.333.2]To illustrate the use of PRA procedure, a nine storey steel frame shown in Fig. 2 is considered. The properties of the steel frame are shown in Table 4.1.
Table -1: Properties of the nine storey steel frame
Outer columns from 1st
floor to 9th floor ISHB 300 Inner columns from 1st
floor to 9th floor ISHB 300
All beams ISWB 300
Equal bay width 6.0 m Storey height 3.0 m Grade of steel Fe 415 Moment Capacity of the
bottom storey columns (for fixed base)
447.86 KN-m
Moment Capacity of the
beams (for fixed base) 299.2 KN-m
Fig -2: Nine Storey Steel Building Frame
For flexible base frame, response spectrum analysis is carried out by replacing soil by an equivalent spring dashpot system. The constants of equivalent spring and dashpot for the frames are shown in Table -2.
Table -2: Equivalent spring and dashpot coefficients for soil
VS = 80 m/s Linear
(kN/m)
Rotational
(kN-m/rad)
Coupled
(kN-m /rad)
Stiffness 1.72 x10⁴ 1747.422 540.819
Damping 8.58 x10² 0.3494 27.0409
Table -3: Natural frequencies of the fixed and flexible base nine storey steel frame (in Hz)
Freq.( Hz) Flexible base(Hz) Fixed Base (Hz)
1st 0.13314 0.13390
2nd 0.15324 0.15835
3rd 0.8803 0.86920
4th 0.91012 0.94782
5th 2.03870 2.21037
6th 2.27477 2.38464
7th 2.33653 2.38780
8th 2.41276 2.59433
9th 2.47392 2.62259
[image:7.595.67.262.493.658.2]© 2018, IRJET | Impact Factor value: 6.171 | ISO 9001:2008 Certified Journal | Page 4181 excitation. The frame is designed for lateral load as per
[image:8.595.306.558.97.351.2]IS:1893-2002 (for gravity loading) and probabilities of failure are computed considering the gravity load to remain constant. The frame is so designed that it may have a very high probability of failure for some soil conditions for PGA levels greater than 0.1g at the bedrock level. Such illustrative example is considered in order to show how drastically the probability of failure can change with the change in soil condition. The mean value of the ductility factor for steel frame is taken as 4.0. The upper and lower limits of the magnitude of earthquake in Richter scale are taken as 9 and 5 respectively for illustrative purposes only. The response spectrum at different PGA (0.03g, 0.08g, 0.13g, 0.18g, 0.23g, 0.28g) as per IS 1893 corresponding to the free field ground motion is taken as the input to the structure.
Table -4: Sensitivity analysis of different parameters (β1 to β6) at PGA=0.23g for soft soil
S.No. β1 β2 β3 β 4 β 5 β 6 Probabilit
y of failure
1 0.49 0.46 0.3 0.15 0.14 0.25 0.14917
2 0.49 0.30 0.3 0.15 0.14 0.25 0.12302
3 0.49 0.46 0.15 0.15 0.14 0.25 0.13567
4 0.49 0.46 0.30 0.30 0.14 0.25 0.16109
5 0.49 0.46 0.30 0.15 0.20 0.25 0.15386
6 0.49 0.46 0.30 0.15 0.14 0.10 0.14007
[image:8.595.28.290.297.504.2]7 0.49 0.46 0.30 0.30 0.20 0.25 0.16354
Table -5: Sensitivity analysis of different parameters (β1 to β6) at PGA=0.23g for hard soil
S.No. β1 β2 β3 β 4 β 5 β 6 Probability
of failure
1 0.49 0.46 0.3 0.15 0.14 0.25 0.01390
2 0.49 0.30 0.3 0.15 0.14 0.25 0.00734
3 0.49 0.46 0.15 0.15 0.14 0.25 0.01017
4 0.49 0.46 0.30 0.30 0.14 0.25 0.01831
5 0.49 0.46 0.30 0.15 0.20 0.25 0.01539
6 0.49 0.46 0.30 0.15 0.14 0.10 0.01101
7 0.49 0.46 0.30 0.30 0.20 0.25 0.01970
Table -6: Effect of ductility factor at PGA 0.23g
Fig -3: First mode shape of fixed nine storey steel frame
Fig -4: Third mode shape of fixed nine storey steel frame
It is seen from the figures that the values of rotation and the translation at the base for these six modes are considerable. As a result, significant values of equivalent modal damping are achieved for these modes. In the same figure, the frequency of fixed and flexible conditions is also shown. It is seen from the figure that the first frequency of the flexible base frames is 5% less than that of the fixed base frame.
Ductility
factor 2 3 4 5
Probability
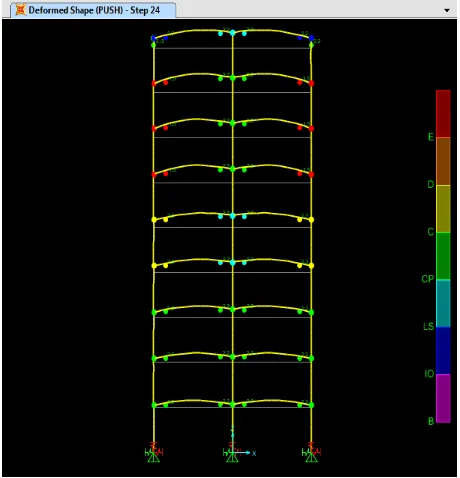
[image:8.595.350.516.400.575.2] [image:8.595.28.294.536.707.2]© 2018, IRJET | Impact Factor value: 6.171 | ISO 9001:2008 Certified Journal | Page 4182 Fig -5: Plastic hinge formation in fixed base frame at 0.23g.
Fig -6: Plastic hinge formation in flexible base frame at 0.23g.
Chart -1: Fragility Curve for Fixed Base Frame for Hard Soil
Chart -2: Fragility Curve for Fixed Base Frame for Soft Soil
[image:9.595.35.265.374.613.2] [image:9.595.318.565.486.651.2]© 2018, IRJET | Impact Factor value: 6.171 | ISO 9001:2008 Certified Journal | Page 4183 Chart -4: Comparison Between Fragility Curves for Different
Base Conditions at 0.23g (for Hard Soil)
Chart -5: Comparison Between Fragility Curves for Different Base Conditions at 0.23g (for Soft Soil)
Chart -6: Comparison between fragility curves for a nine storey and a four storey building.
3. CONCLUSIONS
Vulnerability analysis of structures for regions having no or little earthquake data is presented. For this purpose, a simplified probabilistic risk analysis of flexible base building frames is presented. The soil is replaced by equivalent spring dashpot system having frequency independent stiffness and damping coefficients. An equivalent modal damping for each mode of vibration for the flexible base frame is determined by using an energy approach. The equivalent lateral load for the seismic effect for the flexible base frames are obtained with the modified frequency and modal damping on the frame due to soil structure interaction SSI effect. Response spectrum of the free field ground motion as seismic input is used for the analysis of the structure. The probabilities of failure are calculated by considering uncertainties arising from the variation of ground motion, material properties and modelling and analysis procedure of the structure. The probability of failure is presented in the form of fragility curves. A nine storey frame is analysed to show the effects of base flexibility, soil condition, and variation of height on the fragility curves.
The results of the parametric study lead to the following conclusions
(1) Base flexibility has a considerable influence on the probability of failure of the building frames; it significantly reduces the probability of failure by almost 94% (calculated for soft soil).
(2) Soil condition also has a great effect on the probability of failure of building frames. We found that soft soils usually amplify ground shaking increasing the probability of failure of the building .Hence, If an earthquake is strong enough and close enough to cause damage, the damage will usually be more severe on soft soils.
(3) Mean value of the ductility factor has a pronounced effect on the probability of failure. It decreases the probability of failure almost by 15% when increased from 4 to 5. Therefore, the value of the ductility must be properly selected while designing a structure.
(4) Large structures or high rise buildings are more affected by low-frequency, or slow shaking and their probability of failure increases with an increase in height. Hence, height has a significant effect on the probability of failure. Thus, on soft (long-period) ground, it would be best to design a short, stiff (short-period) building.
© 2018, IRJET | Impact Factor value: 6.171 | ISO 9001:2008 Certified Journal | Page 4184
REFERENCES
[1] A. Kumar., M. Bertogg and S.Tschudi, (August1-6,
2004),”Vulnerability parameters for probabilistic Risk Modeling- Lesson learned from earthquake of last decade”, 13th world conference on earthquake engineering, Canada.
[2] A. Pomonis., A. Kappos., F. Karababa and G.
Panagopoulos (2009), “Seismic Vulnerability and Collapse Probability Assessment of Buildings in Greece”. Second International Workshop on Disaster Casualties 15-16 June 2009, University of Cambridge, UK.
[3] A.A.S.K Behzadafshar., B. Esfandiyari and R.Rajablou
(2010),”Non-Linear site response evaluation procedure under the strong motion-A case study of M.A Sharghi, Province, Iran,”Scientific Research and essay vol.5(16), PP.2257-2274.
[4] A.P Sithram., T.G Divya (2007), ”Site amplification
studies for Banglore city”, Indian Geotechnical Society, Chennai, India.
[5] Abbiss (1989), “Seismic Amplification-Mexico City”,
Earthq. Engg and Struc. Dyn. Vol.18, pp79-88.
[6] Chang, S.Yih., C.Hsiung., S.Shing (1988) ,“Distribution of
seismic hazard and risk analysis of buried pipelines in Taiwan”, Journal of the Chinese Institute of Engineers, Vol 11, n 1, pp11-23
[7] Costantino., C.J. and Gu., Y.T (1991)., “Seismic risk
assessments of small earth dams”, Proc 3 US Conf Lifeline Earthquake, Publ. by ASCE, New York, NU, USA., pp 704-713.
[8] G.M. Calvi., R. Pinho., G. Magenes., J.J. Bommer., L.F.
Restrepo-vélez and H. Crowley (2006)., “Development of seismic vulnerability assessment methodologies over the past 30 years “. iset Journal of EarthquakeT, paper no. 472, vol. 43, no. 3, September 2006, pp. 75-104 .
[9] H. O. Soliman., T. K. Datta (1995), “Response of over
ground pipelines to random ground motion”. Civil Engineering Department, Indian Institute of Technology, Hauz Khas, 110016, New Delhi-110016, India (Received March 1995; accepted April 1995)
[10] J.A Clark., Lee, C.H., Savage, W.U (1991).,
“Seismic/geological risks as factors in prioritizing gas pipeline system replacement”, Proc 3 US Conf Lifeline Earthquake, Publ by ASCE, New York, NY, USA, pp 206-215.
[11] K.J Bathe and E.L Wilson (1987),” Numerical methods on
finite element analysis”, Prentice Hall.
[12] M. P. Romo., M. J. Mendoza and S. R. Garcí (1989),
“Geotechnical factors in Seismic Design of Foundations State of-the-art Report”.
[13] R.A. Khan., T.K. Datta., and S. Ahmad (2005), ” Reliability
Analysis of Fan Type Cable Stayed Bridges against First Passage June 2005, volume 4, issue 1, pp 83-94Failure Under Earthquake Forces “. Earthquake engineering and engineering vibration,.
[14] Shinozuka., M.Takeda (1989),”A Seismic PRA Procedure
in Japan and its application to a Building’s Performance Safety Estimation, Part 3,Estimation of Build and Equipment Performance Safety.Proc. of icossar’ 89,pp. 637-644.
[15] T. Naqvi., T. K. Datta and G.V. Ramana (2010), “Fragility
analysis of concrete building structures “ . International
Journal of Earth Sciences and Engineering 729 issn 0974-5904, vol. 03, no. 05, October 2010, pp. 729-743
[16] V. Furumoto., M.Sugito., and K.Yashiro (2004)., “A simple
conversion factor of seismic intensities from engineering-rock surface to soil surface”. 13th world conference on earthquake engineering Vancouver, B.C., Canada August 1-6, 2004 paper no. 686.
[17] V.V. Bolotin,(1993) ,“Seismic risk assessment for
structures with the Monte Carlo simulation”, Probabilistic Engineering Mechanics,, Vol 8, n 3-4, pp169-177..
[18] W.W Hays (1987), “Amplification of the Earthquake