A Comparative Analysis of PSNR value for Images
using Wavelet Based Thresholding Methods
Nik Shahidah Afifi Bt Md
Taujuddin
Faculty of Electrical and Electronic Engineering
Universiti Tun Hussein Onn Malaysia
86400 Parit Raja, Batu Pahat, Johor, Malaysia
Rosziati Bt Ibrahim
Faculty of Computer Science and Information Technology UniversitiTun Hussein Onn Malaysia, 86400 Parit Raja, Batu Pahat, Johor,
Malaysia [email protected]
Suhaila Bt Sari
Faculty of Electrical and Electronic Engineering
Universiti Tun Hussein Onn Malaysia
86400 Parit Raja, Batu Pahat, Johor, Malaysia
Abstract— Thresholding is a process of shrinking the small absolute coefficients value while retaining the large absolute coefficient value. It will produce finer reconstruct signal. Since this method is taking the condition that the amplitude of wavelet transform coefficients signals are much larger than noises, so the unconsidered noise will be removed while holding the significant signal. This paper examine several thresholding methods namely VisuShrink (Hard Threshold), VisuShrink (Soft Threshold), BayesShrink, OTW SURE-LET and NeighShrink SURE. These five methods are implemented on standard test images and medical images to perceive its’ different performance based on the Peak Signal-to-Noise Ratio (PSNR) value.
Keywords— Wavelet, Thresholding, Peak Signal to Noise Ratio (PSNR)
I. INTRODUCTION
In image processing field, the reconstructed image is always facing with the noisy, incomplete and blurry problem. From the previous work, we can find some denoising methods mainly on spatial-domain and wavelet-domain filter. Some example for spatial-domain filter are Mean filter, Median filter, Alpha-trimmed filter and Wiener filter. While the Wavelet-domain filters are VisuShrink, SureShrink, BayesShrink, OTW SURE-LET and NeighShrink SURE.
Wavelet-domain filter gains it popularity because it can perceive a signal in different resolution or in different window. Wavelet is a flexible tool with rich mathematic content and has enormous potential in many applications and greatly being used in the field of digital images. Wavelet algorithm work as signal processing in such a way like the human vision do. It provides a much more precisely in digital image, movies, color image and signal. It also has widely used in data compression, fingerprint encoding and also image processing.
II. RELATED WORK
A. Concept of Thresholding
In the wavelet transform, the noise energy is distribute in all wavelet coefficients, while the original signal energy is found in some of the coefficients. Therefore, the signal energy is found much larger than noise energy. So, small coefficients can be considered as caused by noise while large coefficients are triggered by significant signal features.
Based on this idea, thresholding process is proposed. Thresholding is a process of shrinking the small absolute coefficients value while retaining the large absolute coefficient value. It will produce finer reconstructed signal. Since this method is taking the condition that the amplitude of wavelet transform coefficients signals are much larger than noises, so the unconsidered noise will be removed while holding the significant signal.
Threshold also can be define as the Peak Absolute Error (PAE) accepted for image reconstruction [1]. Hard and soft threshold are the common operator used in conjunction with DWT. Donoho is the person who first introducing the word ‘de-noising’ to explain the process of noise reduction in threshold [2].
Figure 1: The above image shows the noisy step signal while the below image shows the clean step signal (spine biorthogonal 3/9 wavelet). The left image: signal. The middle image: its wavelet representation. The right image: final result [3].
The wavelet coefficient for hard threshold, Hh, is performed as in equation (1):
(1)
where y(i) is the wavelet coefficients, λ is the specified threshold.
Figure 2: Hard threshold function [4]
In the hard threshold, all the coefficient with higher magnitude than the selected threshold will be retain the same while the rest is set to zero. However, it produce the artifact appearance because of the region created around zero where the coefficients are considered insignificant.
With better image recovery in mind, the soft threshold is proposed to reduce the gap between the remaining and discarded coefficients.
For soft threshold, Hs, the coefficients is expressed as in equation (2):
(2)
The elements with absolute value is lower than the threshold value will be set to zero and then the other coefficient will be shrunk. sgn(*) is a sign function. Refer to equation (3)
[image:2.595.56.291.55.189.2](3)
Figure 3: Soft threshold function [4]
In soft thresholding, the coefficient with higher magnitude than the selected threshold will be supressed towards zero while the rest will be set to zero. This activity lead to over smoothing effect at the reconstructed image which will cause a poor PSNR value.
There are two types of thresholding; global and level dependent threshold. Global threshold imply single threshold value globally to all wavelet coefficient while level dependent threshold use different threshold value at different level.
Threshold value estimation is very crucial. If the threshold value set too small, it will adopt noise into the signal. While, if the threshold value is too high, the important coefficients value will be screened out leading to deviation condition [5].
III. WAVELET-BASED THRESHOLDING METHODS Donoho and Johnstone have done a lot in wavelet thresholding. They first invented the VisuShrink that using the hard thresholding [6] and soft threshold [2] rules. The universal threshold is defined as equation (4)
(4) Where the σ is the noise variance present in the signal and n is the number of pixel in the image. For unknown σ, one can be replace by MAD/0.6745, where MAD is median absolute value of the finest scale wavelet coefficients.
The main disadvantage of VisuShrink is it not considering the mean square error, the image is over smoothed, removing too many coefficients and cannot remove the speckle noise. VisuShrink is using the global thresholding scheme where only single threshold value is apply at entire wavelet coefficients.
The BayesShrink [7] method apply subband dependent, which means that threshold value is selected independently at each band of resolution in the wavelet decomposition. It is adaptive with data-driven threshold capability and use merely the same concept with the soft threshold.
The Bayes threshold value, tb in BayesShrink is generated by using Bayesian mathematical framework. It is define as equation (5)
(5) Where σ2 is the noise variance and σs is the signal variance without noise.
[image:2.595.309.556.56.137.2]different subband is shrinked independently while the threshold and window size is remain unchanged. The wavelet coefficients is thresholded according to the magnitude of the squared sum of all wavelet coefficients, local energy inside the neighbouring window. NeighShrink outstrip the PSNR performance of VisuShrink and SureShrink.
Another popular approach is NeighShrink SURE was proposed by [9]. It is an extended version of NeighShrink where it can determine the optimal threshold and neighbouring window at every subband using Stein’s Unbiased Risk Estimate (SURE) where it significantly increase the denoising performance.
[10] have developed the Orthonormal Wavelet Thresholding Stein’s Unbiased Risk Estimate Linear Expansion of Threshold (OTW SURE-LET) that also applying the Stein’s Unbiased Risk Estimate (SURE) method. It directly parameterize the denoising process with unidentified weights. It also calculating the unidentified weights by solving the linear system equation.
IV. RESULT AND ANALYSIS
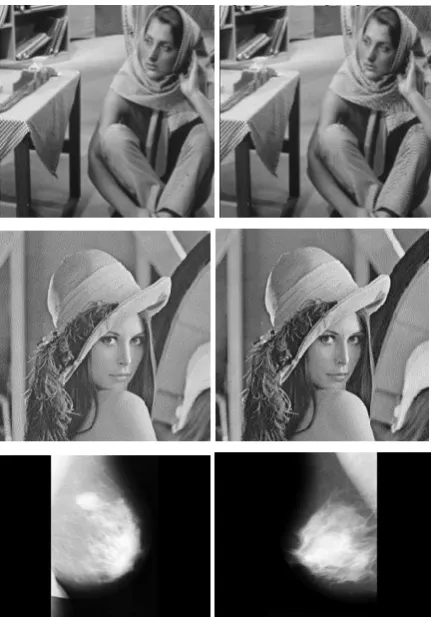
Simulation of the wavelet-based thresholding methods are carried out on Matlab R2012a platform. The standard test images with different image format are used to evaluate the differences if any. We use Lena.bmp, Lena.png, Barbara.bmp and Barbara.png of size 512x512.
While for the medical image we use two different breast images (mdb001.pgm and mdb322.pgm) retrieved from MIAS MiniMammographic Database, the database owned by the Mammographic Image Analysis Society and can downloaded for free at http://www.mammoimage.org/databases/. The name ‘pgm’ is an acronym for ‘Portable Gray Map’ representing a grayscale graphic image.
Figure 4: Test images with different format. From left to right, top to bottom: Barbara.bmp, barbara.png, lena.bmp, lena.png, mdb001.pgm, mdb322.png.
The methods involve in this comparison are VisuShrink (Hard Threshold) by [6], (Soft Threshold) by [2], BayesShrink [7], OTW SURE-LET [10] and NeighShrink Sure [9].
The experiment are conducted at different Gaussian noise levels, σ = 10, 20, 30, 50, 75 and 100. The objective quality performance of the reconstructed image is measured by Peak Signal-to-Noise Ratio (PSNR) [11]. PSNR is measured in decibel (dB) by equation (6):
(6)
The value of 255 is the maximum possible value that can be attained by image signal. While Mean Square Error (MSE) is defined by equation (7):
(7)
[image:3.595.307.523.51.360.2]TABLE1:THE PSNR VALUE COMPARISON BETWEEN SOME OF THE THRESHOLDING METHODS
Sigma VisuShrink (Hard Threshold) [2] VisuShrink (Soft Threshold) [2] Bayes Shink [7] OTW SURE-LET [10] Neigh Shrink SURE [9] Barbara.png
10 28.0734 25.0998 31.1850 32.16 30.3021 20 24.1942 22.6653 27.5244 27.96 26.1965 30 22.7419 21.8510 25.5076 25.82 24.1647 50 21.7765 21.1912 23.1512 23.72 22.0281 75 21.1813 20.8225 21.6333 22.54 20.6911 100 20.9032 20.6498 20.3091 21.81 19.9473
Barbara.bmp
10 28.0734 25.0998 31.1924 32.16 33.0243 20 24.1942 22.6653 27.4829 27.96 29.0935 30 22.7419 21.8510 25.5475 25.82 27.0058 50 21.7765 21.1912 23.1721 23.72 24.6326 75 21.1813 20.8225 21.5865 22.54 22.9907 100 20.9032 20.6498 20.2760 21.81 21.9392
Lena.png
10 31.0927 28.5130 33.6145 34.56 34.7204 20 28.0496 26.0346 30.4511 31.37 31.5302 30 26.4130 24.8472 28.7942 29.56 29.7023 50 24.6826 23.7278 26.6195 27.37 27.4320 75 23.7762 23.1216 24.4786 25.76 27.6156 100 23.2920 22.8546 22.4605 24.66 24.4285
Lena.bmp
10 31.6748 29.1628 34.1733 35.18 35.3715 20 28.6492 26.7869 31.0094 31.96 32.1139 30 27.0959 25.6808 29.3569 30.15 30.2758 50 25.5540 24.6805 27.2772 28.00 28.0198 75 24.6234 24.1549 25.2876 26.41 26.2386 100 24.2601 23.9365 23.5088 25.33 24.9596
Mdb001.pgm
10 41.0134 39.1770 35.2404 44.01 43.6142 20 38.9000 37.1688 30.0515 41.11 40.1294 30 37.5293 35.8539 26.8421 39.25 37.8705 50 35.9073 34.3290 22.8693 36.82 34.8990 75 33.9141 33.5117 19.6410 35.03 32.2743 100 33.4531 33.4396 17.3629 33.73 30.2543
Mdb322.pgm
10 41.2931 38.2733 36.0814 43.76 43.6303 20 37.4162 35.6519 30.8312 40.75 40.0133 30 36.3680 34.5945 27.5011 38.82 37.5314 50 34.9893 32.8871 23.3856 36.25 34.4289 75 33.1918 31.5393 20.0090 34.37 31.9518 100 31.2572 31.2195 17.5932 33.05 30.0631
When looking closer to the result, we observe that medical images show a better PSNR value compared to the standard images where the medical images can reach above 40dB while the standard images just can go only up to 35dB.
This is because the medical images is surrounded by the smooth texture of background region and it is usually black in colour. So reconstructing process on this region doesn’t degrade much the medical image’s PSNR value. From the result in Table 1, it was detected that OTW-SURE LET technique gives the best performance on thresholding process on medical images.
While for the standard images, the PSNR value of the thresholded images were significantly influenced by the image characteristic. The standard image is usually contain rich fine details and edges that spread at entire image. So, this structures may degrade the quality of the reconstructed image.
From the collected data as shown in Table 1, it was observed that the NeighShrink SURE outperform in both lena.bmp as well as lena.png. But the PSNR value by using OTW SURE-LET show the best value on Barbara.png while NeightShrink Sure demonstrate the fine value Barbara.bmp. This result shows that different image format on standard image will affect the PSNR value.
The performance of the PSNR value of each thresholding methods is merely because of its’ different way of eliminating the wavelet coefficient. The VisuShrink use the same threshold value that apply globally to the whole image. So, it doesn’t consider the different features at different sub-band image. While the zero-zone concept that applied in BayesShrink improve the image quality because of it’s efficient Bayes method.
The Stein Unbiased Risk Estimator (SURE) technique that exist in OTW SURE-LET and NeighShrink SURE tend to threshold the wavelet threshold in group and estimated as a sum of squared course coefficient in the block. When this happen, all the wavelet coefficient in different subband is shrinked independently and leading to an optimal thresholding process.
V. CONCLUSION
In this work, comparative analysis of some of the thresholding methods are carried out. According to the experiment, we can see that medical images produce higher PSNR value compared to standard images because it contain lesser texture and details plus having a large smooth background region. Besides, the result shows that same standard image with different format will give different PSNR performance.
Based on five threshold methods tested, NeighShrink SURE shows the best PSNR value for standard images while OTW SURE-LET is the best thresholding method for the medical images.
In short, a research for a more efficient thresholding method is needed to amuse the standard images with rich texture and details.
ACKNOWLEDGMENT
REFERENCES
[1] V. P. Baligar, “Low complexity , and high fidelity image compression using fixed threshold method,” vol. 176, pp. 664–675, 2006.
[2] D. L. Donoho, “De-noising by soft-thresholding,”
IEEE Trans. Inf. Theory, vol. 41, no. 3, pp. 613– 627, May 1995.
[3] V. Bruni and D. Ã. Vitulano, “Combined image compression and denoising using wavelets,” Signal Process. Image Commun., vol. 22, pp. 86–101, 2007.
[4] C. Zhen and Y. Su, “Research on Wavelet Image Threshold De-noising,” 2010 Int. Conf. Futur. Power Energy Eng., pp. 3–6, Jun. 2010.
[5] A. I. Scott, “Denoising by W avelet Thresholding U sing M ultivariate M inim um D istance Partial D ensity E stim ation,” Rice University, 2006.
[6] D. L. Donoho and I. M. Johnstone, “Adapting to Unknown Smoothness via Wavelet Shrinkage,” pp. 1–28, 1994.
[7] S. G. Chang, B. Yu, and M. Vetterli, “Adaptive wavelet thresholding for image denoising and compression.,” IEEE Trans. Image Process., vol. 9, no. 9, pp. 1532–46, Jan. 2000.
[8] G. Y. Chen, T. D. Bui, and A. Krzy, “Image denoising with neighbour dependency and customized wavelet and threshold,” vol. 38, pp. 115–124, 2005.
[9] Z. Dengwen and C. Wengang, “Image denoising with an optimal threshold and neighbouring window,” Pattern Recognit. Lett., vol. 29, no. 11, pp. 1694–1697, Aug. 2008.
[10] F. Luisier, T. Blu, and M. Unser, “A new SURE approach to image denoising: interscale orthonormal wavelet thresholding.,” IEEE Trans. Image
Process., vol. 16, no. 3, pp. 593–606, Mar. 2007.
[11] F. Xiao and Y. Zhang, “A Comparative Study on Thresholding Methods in Wavelet-based Image Denoising,” Procedia Eng., vol. 15, pp. 3998–4003, Jan. 2011.
[12] S. J. Pinto and J. P. Gawande, “Performance analysis of medical image compression techniques,”
![Figure 3: Soft threshold function [4]](https://thumb-us.123doks.com/thumbv2/123dok_us/8768913.897917/2.595.309.556.56.137/figure-soft-threshold-function.webp)