BIROn - Birkbeck Institutional Research Online
Lizarazo, Ivan and Elsner, Paul (2009) Fuzzy segmentation for geographic
object-based image analysis. Proceedings of SPIE 7478 , ISSN 0277-786X.
Downloaded from:
Usage Guidelines:
Please refer to usage guidelines at
or alternatively
Fuzzy segmentation for geographic object-based image
analysis
Ivan Lizarazo
aand Paul Elsner
ba
Universidad Distrital Francisco Jose de Caldas, Carrera 7 No. 40-53, Bogota, Colombia;
b
Birkbeck College University of London, Malet Street, London WC1E 7HX, United Kingdom
ABSTRACT
Image segmentation partitions remote sensing images into image objects before assigning them to categorical land cover classes. Current segmentation methods require users to invest considerable time and effort in the search for meaningful image objects. As an alternative method we propose ‘fuzzy’ segmentation that offers more flexibility in dealing with remote sensing uncertainty. In the proposed method, original bands are processed using regression techniques to output fuzzy image regions which express degrees of membership to target land cover classes. Contextual properties of fuzzy regions can be measured to indicate potential spectral confusion. A ‘defuzzification’ process is subsequently conducted to produce the categorical land cover classes. This method was tested using data sets of both high and medium spatial resolution. The results indicate that this approach is able to produce classification with satisfying accuracy and requires very little user interaction.
Keywords: Image segmentation, Object-based image analysis, Land cover classification
1. INTRODUCTION
Object based image analysis (OBIA) is emerging as a new paradigm for environmental remote sensing.1, 2Its
applications range from agriculture and natural resource management, to national defense and global climate change.3 OBIA analysis is conducted by grouping pixels into image objects as a first stage of the
classifica-tion process. The analysis of image objects rather than individual pixels makes it possible to include spatial and/or textural properties into the image analysis process and, by this, to overcome the limitations of the tradi-tional pixel-wise image analysis which focuses only on spectral properties.4–6 Recent research demonstrates that
this segmentation based approach for image classification process produces higher thematic accuracy than the traditional per-pixel methods.4, 7–9
The OBIA approach is particularly useful for land cover analysis from high spatial resolution imagery. In such a case, pixel size is small relative to the spatial frequency of land cover, and the within class variation usually leads to misclassification of individual pixels.10 Thisgeneralization problem is solved by OBIA using spatial and
spectral information at a given level of aggregation of pixels (i.e. segmentation). A basic assumption underlying the conventional OBIA approach is that it is always possible to createmeaningful image objects, that is, that such groups of pixels correspond unequivocally to real-world geographic objects.11 Once such image objects are
created, at one or several spatial scales, their properties are analysed and used in the subsequent classification stage which allocates image objects to target land cover classes.
Image segmentation is recognized as the critical step of the OBIA approach because its results affect directly all the subsequent tasks.12–14 It can be thought of as the ’weakest link’ in the OBIA processing chain due to
the following limitations:15 (i) classification accuracy depends on the quality of the image segmentation (i.e. if
image objects are extracted inaccurately, subsequent classification accuracy will not improve); (ii) classification error could be accumulated due to error in both image segmentation and classification process; and (iii) once an image object is mis-segmented, all pixels in this object will be misclassified.
Image segmentation produces a set of image objects which are distinct and uniform with respect to some intrinsic property of the image, such as grey level, texture or color.16 The result of image segmentation is
determined by the purpose of the study, the grouping strategy and specific decisions about the desired levels of homogeneity and (or) the expected size of the resulting segments.17 Image segmentation is therefore a highly
of the available images.18 This situation poses problems to the transferability of image segmentation methods
and the development of automated classification rules.18
A number of operational software tools are now available to conduct OBIA analysis. This includesDefiniens, previously known as eCognition, ENVI’s Feature Analysis, ERDAS’s Objective, and IDRISI’s Segmentation. Although all of these programs offer a number of similar functionalities,Definiensimplements the most advanced algorithms and therefore can serve as example of current standard OBIA implementations.4 Definiens’sfractal
net evolution algorithm provides ‘multiresolution segmentation capabilities to solve any classification problem’.19
Regardless of the actual software package, all current segmentation approaches share a number of issues that need to be addressed: (i) remotely sensed images portrait an ambiguous representation of geographic objects which often prevents the formation of meaningful discrete image objects; (ii) the current implementations of such segmentation are highly dependent on complicated parameterisation procedures which are both labour intensive and time consuming; (iii) linking image objects to real world classes, and identifying appropriate attributes, are not trivial tasks, and usually request a trial-and-error approach.
There is hence a need for more robust segmentation techniques that are less dependent on skills and effort of individual users. The availability of such approaches would make it possible to stronger automate the processing of large data sets. This paper proposes such an approach by using fuzzy set concepts for the image segmentation stage instead of ’hard’ or ’crisp’ segmentation approaches used in conventional OBIA procedures. A fuzzy segmentation approach which takes into account the fuzziness of the real world and the ambiguity of remote sensing imagery is potentially more appropriate than a hard segmentation to resolve the spectral and spatial confusion which characterizes natural and man-made landscapes.20
2. FUZZY SEGMENTATION
Fuzzy segmentation is based on the idea that remotely sensed images provides ambiguous information, and that, due to sensor noise, shadows, geometric distorsions, or physical similarities, boundaries between different land cover classes cannot be defined precisely.
Conventional ’crisp’ segmentation can be understood as ahard partition of an image, which requires precisely defined set boundaries for which an element (i.e. a pixel) is either a member (true = 1) or not a member (false = 0) of a given image object. In contrast, a fuzzy segmentation allows degrees of membership of image objects to each of the different classes.
It should be noted that the use of fuzzy sets techniques in the context of conventional OBIA is not new. In the example of Definiens, fuzzy approaches are available for the final classification of crisp image segments.21
However, fuzzy approaches are not applied in the segmentation stage but only later in the process chain and where it may be too late to address uncertainty with the aid of fuzzy set techniques.
A fuzzy segmentation takes into account that, at any spatial resolution, there may be pixels of mixed com-position, which cannot be definitively assigned to one or another image object in the segmentation stage.20, 22
Fuzzy segmentation provides a more generic view of the image segmentation process which allows the production of image regionsable to resemble both discrete geo-objects and continuous geo-fields.
It is proposed here that image segmentation should be understood as the process of grouping pixels either spatially or thematically. In the case of spatial segmentation, segments are identified as crisp image objects
which are discrete groups of pixels with clearly delimited boundaries but no thematic description. These are the geo-object type segments that are produced by current standard OBIA approaches. In the case of thematic segmentation, segments can be conceptualised as image fields, whose pixels store individual values to a given property. Thematic segmentation does not output a single layer, such as the spatial segments of standard OBIA approaches. Rather, image fields consist of as many layers as properties of interest, e.g. target land cover classes, exist. A set of image fields can represent respective membership to a given set of thematic categories and individual image fields can by this be understood as continuousimage regions.
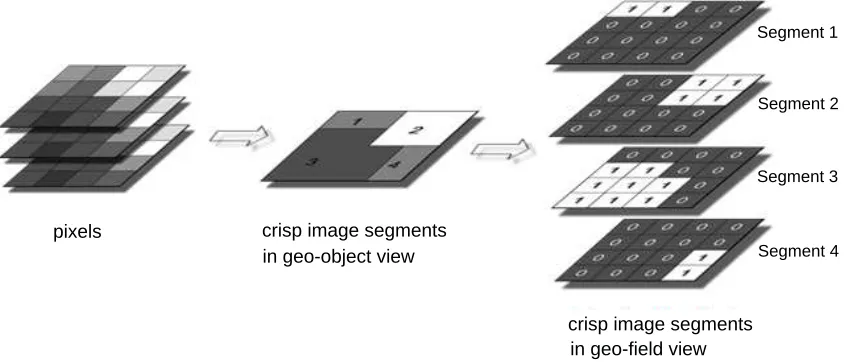
Discrete image segmentation divides an image into a set of non-overlapping regions or image objects whose union is the entire image.23 Figure 1 illustrates that crisp image objects are discrete structures with can be
in geo-object view
in geo-field view
Segment 1
Segment 2
Segment 3
Segment 4 crisp image segments
[image:4.595.100.522.99.280.2]crisp image segments pixels
Figure 1. Spatial or crisp image segmentation produces one single image composed of discrete image objects with clearly defined boundaries. In a field representation of crisp image objects, as the one depicted to the right, pixels hold either full or null membership to image objects.
that such crisp image objects could as well be expressed in the field view of thematic segmentation. This is done as three image regions in which the membership of pixels to image objects 1 to 4 is expressed in the binary 0/1 membership to each individual region. In a perfect segmentation each image object 1, 2, 3, and 4 can be unequivocally linked to target land cover classes. This demonstrates that the spatial segments can be conceptualised as extreme examples of thematic segmentation.
Thematic segmentation offers the opportunity to widen the binary crisp membership attributes that are inherent in the spatial segmentation approach by allowing not just membership values of 0 or 1 but also any value in between, i.e. expressing fuzzy membership values. This is the central paradigm of the proposedfuzzy
image segmentation approach. Figure 2 shows fuzzy image regions output by a fuzzy segmentation. In this hypothetical example, the input image is a multispectral image composed ofn spectral bands. The output of the fuzzy classification is a set ofm image regions, wherem is defined by the number of land cover categories composing the target vector of classes (X) of the OBIA process. In the example of Figure 2,X is composed by classes A, B, and C andmis 3. Partial membership valuesµ(Xm) are represented by continuous values ranging from 0.0 (no membership) to 1.0 (full membership).
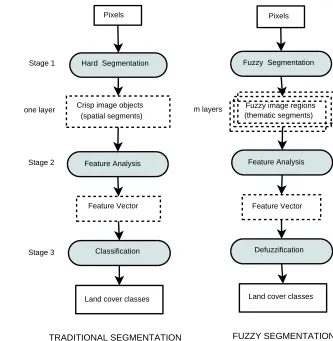
A general framework to conduct fuzzy segmentation-based image analysis is shown to the right side in Figure 3. Similarly to the traditional hard segmentation approach, depicted to the left side, the image classification process can be understood as the sequential development of three distinct and interrelated stages: (i)segmentationwhich results in one layer of spatial segments in the case of hard segmentation; ormlayers of thematic segments (or image regions) in the case of fuzzy segmentation, (ii)feature analysis in which properties of spatial or thematic image regions are analysed, and (iii) classification/defuzzification in which spatial or thematic image regions, respectively, are crisply allocated to one ofmland cover classes.
It should be emphazised that the availability of multi-layer thematic segments is opening additional scope for the feature analysis stage. This could be useful to develop additional attributes to the feature vector that is used in the subsequent defuzzification stage. An example metric is the absolute normalized difference index (ANDI) defined in Equation 1:
AN DI=|µiA−µiB|/(µiA+µiB) (1) where µiA and µiB are the membership values of the ith
pixels
fuzzy image regions
A
B
[image:5.595.161.450.97.261.2]C
Figure 2. Fuzzy image segmentation outputs fuzzy image regions holding multiple membership values to target thematic categories A, B, and C. Fuzzy image regions can be understood as thematic segments.
m layers Stage 1
Pixels
Fuzzy image regions Pixels
Hard Segmentation Fuzzy Segmentation
Crisp image objects one layer
Stage 2 Feature Analysis
Stage 3
Land cover classes
Feature Vector Feature Analysis
Classification
Land cover classes Feature Vector
FUZZY SEGMENTATION TRADITIONAL SEGMENTATION
Defuzzification (spatial segments) (thematic segments)
OBIA workflow
for image classification
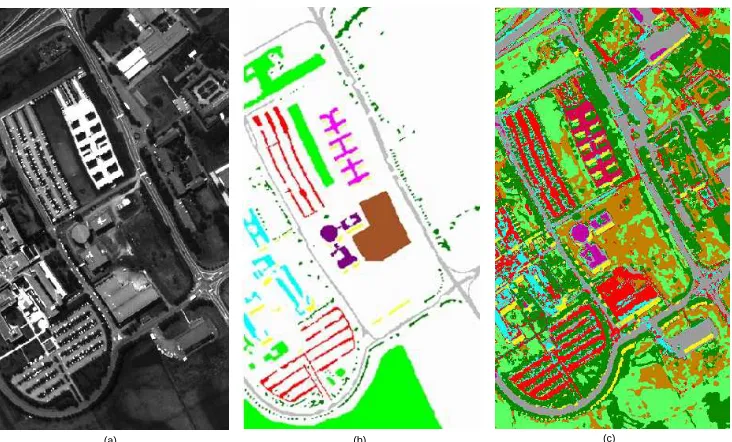
[image:5.595.177.510.320.661.2](a) (b) (c)
Figure 4. (a) Blue spectral channel of the input data set. (b) Testing sample for supervised classification. (c) Land cover classification using the model GAM-RF . In (b) and (c), asphalt class is shown in gray, meadows in light green, gravel in cyan, trees in dark green, metal in magenta, soil in brown, bitumen in purple, brick in red, and shadow in yellow. Background is depicted in white.
AN DI value is an indicator of the overlapping existing between two specific fuzzy image regions. ANDI values range in [0,1]. ANDI values close to 0 represent areas of thematic confusion.
This potential of the proposed fuzzy segmentation method was tested in two case studies, using high and medium spatial resolution data.
3. CASE STUDY 1: AIRBORNE HYPERSPECTRAL DATA SET
3.1 Data
The core data set for implementing and evaluating a fuzzy segmentation-based land cover classification was theuniversity data set, an image of the University of Pavia (Italy) that was collected by the Hysens project24
and was acquired by the Digital Airborne Imaging Spectrometer (DAIS) and Reflective Optics System Imaging Spectrometer (ROSIS) sensors on 8th July 2002. DAIS image comprises 80 bands on the spectral range from 400 to 1260 nm. ROSIS image comprises 32 images in the spectral range from 430 to 850 nm. Theuniversity
data set size is 610 x 339 pixels with 1.2 m spatial resolution.24
This data set has been analysed in a previous OBIA study25 in which a three stage object-based image
classification procedure was applied. First, a segmentation step in which a total of 24 bands were used as input for producing crisp image objects from 8 linear discriminant analysis (LDA) bands, 10 principal components analysis (PCA) bands and 16 Gabor bands. This was followed by a feature analysis step, in which a feature vector of four values was measured for each image object by clustering statistics from different features (i.e. the LDA bands, the PCA bands, the Gabor bands, and 10 shape attributes). In the final step, the allocation of image objects to land-cover classes was conducted using Bayesian classifiers. The overall accuracy reported by25was PCC of 84%. These results can serve as independent benchmark against which the fuzzy segmentation
approach can be evaluated.
Theuniversity data set was provided by24 and includes training and testing samples for the following nine
[image:6.595.125.491.69.290.2]3.2 Methods
For the purpose of this case study, seven spectral bands corresponding to three visible channels and four infrared channels were selected from the university data set as input data for image classification in the experiment. The selected bands correspond closely to the wavelengths’ center of the seven spectral channels of Landsat TM. Thus, the selected bands simulate the spectral information typically available in multispectral remote sensing applications. Figure 4(a) shows a single channel, corresponding to the Landsat-TM blue band.
Fuzzy segmentation, the first stage of the proposed approach, can be understood as a regression problem because the outputs (i.e. the set of membership values to classes) can be interpreted as quantitative variables expressing the proportion of different classes that a pixel may represent. In a regression problem, the inputs are referred to aspredictors orindependent variables.26, 27 The outputs are labelledresponsesordependent variables.
Defuzzification, the last stage of the proposed approach, aims to produce a qualitative allocation which can be considered to be a classification problem.
Both regression and classification tasks can be solved using machine learning techniques. Machine learning, also known as empirical concept learning, uses a set of positive and negative examples of a concept, as described by a set of attributes of known objects, to learn or infer a functional relationship between a set of attribute variables and the associated response. Then, that functional relationship is used topredict the eventual response for new objects.26
There is an increasing interest in machine learning (ML) algorithms in the remote sensing community which can be attributed to several factors, including:28 (i) they commonly do not make assumptions about the statistical
distribution of the data and hence can deal with multi-modal, noisy and missingg data; (ii) there is a significant reduction in computational demands when data measurement spaces are large and complex; (iii) they can accommodate both categorical and continuous ancillary data; (iv) many of them provide information about the individual contribution of the predictors; and (v) they are flexible and can be adapted to improve performance or solve particular problems.
In this case study, the following ML techniques were tested for implementing the regression and classification tasks: Generalized Additive Models (GAM), Support Vector Machines (SVM), Classification and Regression Trees (CART), and Random Forest (RF).
A GAM is a generalized linear model in which part of the linear predictor is specified in terms of a sum of smooth functions of predictor variables. The exact parametric form of these functions is unknown as is the degree of smoothness appropriate for each of them.29 While general linear models emphasize the estimation and
inference for the model parameters, GAM focuses on exploring data non-parametrically. The strength of GAM is its ability to deal with highly non-linear and non-monotonic relationships between the response variable and a set of explanatory variables.26
SVM is a widely used machine learning method for data sets classification.27 SVM transforms the input
data set into a higher-dimensional space using special functions called kernels. Kernel functions commonly used in SVM are: (i) polynomial, (ii) radial basis function, and (iii) sigmoid. SVM uses a few number of training samples to fit the classification or regression model. While SVM parameterisation is considered a complex issue, it can be solved using automatic procedures.30 SVM uses then thestructural risk minimisation(SRM) principle
to find a separating hyperplane which minimizes the margin between two classes.27 SVM was tested for both
the fuzzy segmentation and the defuzzification/classification stages.
CART (also referred to as decision trees) is a versatile tool for building statistical models from simple feature data.27 CART can deal with incomplete data, and multiple types of features. Decision trees contain a binary
question about a specific feature at each node in the tree. The basic building algorithm starts with a set of feature vectors representing samples, at each stage all possible questions for all possible features are asked about the data finding out how the question splits the data. A measurement of impurity of each partitioning is made and the question that generates the least impure partitions is selected. This process is applied recursively on each sub-partition until some stop criteria is met (e.g. a minimum number of samples in a partition).31 CART
was tested for the defuzzification stage.
bootstrap aggregating) to create new training sets. RF includes two important methods: random feature subspace and out-of-bag estimates. The former enables a much faster construction of the trees and the latter the possibility of evaluating the relative importance of each input feature.32 RF have been explored for pixel-based land cover
classification and experimental results suggest it is more efficient compared to methods such as Artificial Neural Networks (ANN).33
In summary, two different models for conducting the fuzzy segmentation stage were tested: GAM and SVM. Three models for conducting the final classification stage were tested: SVM, CART and RF. Details on the implementation of these models can be found in.20, 22, 34 The feature analysis stage of the implemented case
study was restricted to the calculation of ANDI indices for the following pairs of fuzzy image regions: meadows & trees, meadows & soil, asphalt & bitumen, asphalt & metal, and asphalt & gravel. This means that for the defuzzification stage, 14 predictor variables were available: 9 fuzzy image regions, plus 5 layers with ANDI indices.
4. RESULTS
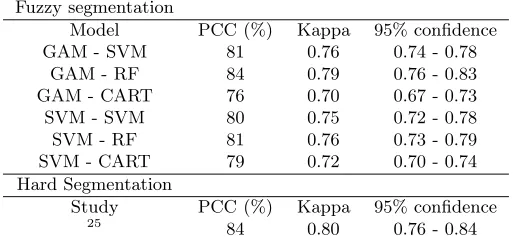
Table 1 shows the results obtained by fuzzy segmentation using six combinations of methods for implementing the fuzzy segmentation (fuzzification) and classification (defuzzification) stages. Thematic accuracy is expressed using Percentage of Correct Classification (PCC) and Kappa Index of Agreement (KHAT) index.35 It can be
[image:8.595.178.436.368.488.2]seen that that highest accuracy was achieved by the GAM-RF model (PCC=84%, KHAT = 0.79) (See classified image in Figure 4(c)). This is only slightly lower than the results of the reference study of Aksoy (PCC=84%, KHAT = 0.80). It should be noted that this difference is not statistically significant atp < .05 level. This fact applies also to most accuracy differences between other algorithm combinations.
Table 1. Summary of performance of different models used in the fuzzy segmentation method
Fuzzy segmentation
Model PCC (%) Kappa 95% confidence
GAM - SVM 81 0.76 0.74 - 0.78
GAM - RF 84 0.79 0.76 - 0.83
GAM - CART 76 0.70 0.67 - 0.73
SVM - SVM 80 0.75 0.72 - 0.78
SVM - RF 81 0.76 0.73 - 0.79
SVM - CART 79 0.72 0.70 - 0.74
Hard Segmentation
Study PCC (%) Kappa 95% confidence
25
84 0.80 0.76 - 0.84
5. CASE STUDY 2: SPACEBORNE MULTISPECTRAL DATA SETS
In a second case study, the sensitivity of the fuzzy segmentation approach to reduced spectral and spatial resolution was tested. This was done was classifying two satellite images with different spatial resolution of the same urban area in Bogota, Colombia. Both fuzzy segmentation and, as reference benchmark, conventional hard segmentation approaches were carried out.
5.1 Data
The first data set was a high spatial resolution image of the QuickBird-XS sensor, covering a small urban area in the west of Bogota (Colombia). The imagery was acquired by Digital GlobeT M
(a) (b) (c)
Figure 5. (a) Blue channel of the QuickBird-XS image; (b) Land cover from QuickBird-XS; (c) Land cover from SPOT-XS.
The second data set was medium spatial resolution image of the SPOT-XS sensor, acquired in 21st January 2006, with four bands with middle wavelenght located as follows: green (500 - 590 nm), red (610 - 680 nm), near-infrared (780 - 890 nm) and medium-infrared (1580 - 1750 nm). The SPOT data set is 259 columns x 284 rows with 10 m spatial resolution and 8 bits radiometric resolution.
The classification schema used to classify both images is based on,36and consists of the following seven classes:
road, rooftop1, rooftop2, grass, trees, water and bare soil. Road class comprises both asphalt and concrete streets. Rooftop1 class refers to medium reflectance materials, i.e. asphalt, concrete and bricks. Rooftop2 class refers to high reflectance materials, i.e. metal and fiberglass. Training and testing samples for the QuickBird data set were randomly selected in the image and their corresponding ground classes collected through field work. The training sample was composed of 441 pixels. The testing sample was composed of 478 pixels.
Training and testing samples used for classifying the SPOT image were collected at the same points used as ground reference locations for the QuickBird experiment. However, samples collected for the SPOT classification experiment were fuzzy, i.e. they were labeled using a continuous (quantitative) value in the range [0,1] expressing membership of pixels to target land cover classes. The procedure for obtaining fuzzy samples can be summarized as follows: (i) rasterisation (at 2.5 m spatial resolution) of visually interpreted categorical land cover from QuickBird images; (ii) creation of seven binary thematic layers, one layer per land cover class (i.e. pixels with a given class as labeled as 1, otherwise as 0); (iii) calculation of seven compositional thematic layers, calculating, at 2.5 m resolution, number of cells labeled as 1 within an overlying cell at 10 m spatial resolution; and (iv) sampling of compositional values (i.e. fuzzy values) at the same locations of training samples used for QuickBird image classification.
5.2 Methods
For the fuzzy segmentation based approaches the procedure for classification involves again the three stages,
fuzzy segmentation, feature analysis and defuzzification. The GAM technique was selected for conducting the fuzzy segmentation stage. The feature analysis stage was again restricted to the calculation of ANDI indices for the following pairs of fuzzy image regions: road & rooftop1, road & rooftop2, rooftop1 & rooftop2, and rooftop2 & soil. The defuzzification stage was conducted by SVM algorithms.
[image:9.595.82.531.71.240.2]direction, shape index, and degree of skeleton branching. Textural features were also measured by estimating the grey-level co-ocurrence matrix (GLCM) contrast and homogeneity of image objects at each spectral channel, resulting in 8 bands. The final classification stage used the training samples and a nearest neighbor classifier to allocate every image object to one of the classes of interest.
5.3 Results
[image:10.595.179.435.248.338.2]Table 2 shows the results obtained by both fuzzy segmentation and hard segmentation. It can be seen that fuzzy image segmentation approaches resulted in significantly higher thematic accuracy compared to the hard segmentation approach at both scales. It also shows that thematic accuracy of land cover obtained from the high spatial resolution image (shown in 5 (b)) is better than that obtained from the medium spatial resolution image (shown in 5 (c)). In the latter case, thematic accuracy does no meet standard accuracy of land cover classification.
Table 2. Summary of effects of changes in spatial resolution
Fuzzy Segmentation
Pixel size PCC (%) KHAT 95% confidence
2.40 m 83 0.80 0.78 - 0.82
10.00 m 70 0.67 0.65 - 0.69
Hard segmentation
Pixel size PCC (%) KHAT 95% confidence
2.40 m 71 0.68 0.66 - 0.69
10.00 m 60 0.57 0.55 - 0.59
6. DISCUSSION
This section discusses the following issues: (i) quality of land cover classification, and (ii) level of user effort required to achieve successful results. The first question relates mainly to thematic accuracy of the classification. In the first case study, the hard segmentation approach produced a similar thematic accuracy than the fuzzy segmentation. In the second case study, the hard segmentation approach produced a lower thematic accuracy than the fuzzy segmentation approach. However, the main point is that hard segmentation depends highly on user skills and parameterisation decisions. On the contrary, the fuzzy segmentation approach relies mainly on the information provided by the training samples and the different stages of the process are independent from subjective decisions.
The most interesting fact to note is that, differences in thematic accuracy between the different techniques used for fuzzy segmentation are not statistically significant. This fact suggest that any machine learning algorithm can be used to implement the fuzzy segmentation approach without compromising the accuracy of land cover classification. As indicated in Table 1, the fuzzy segmentation approach produced similar thematic accuracy than that obtained by.25 It should be noted that, in such previous study, hard segmentation was based on larger
amount of input variables and entailed a laborious work for collecting the feature vector used at the classification stage. In contrast, in the fuzzy segmentation approach, a smaller number of bands was used, and the feature analysis stage was restricted to the calculation of the ANDI indices.
Two additional issues, not addressed in this paper, refer to the importance of establishing: (i) what is the computational cost of the different ML techniques used in the fuzzy segmentation approach (compared to the performance of traditional segmentation algorithms), and (ii) which techniques provide useful information about the relative importance of the predictor variables. Answers to these questions can be used to select the best combination of techniques for operational implementation of the fuzzy segmentation approach.
It should be emphasized that the fuzzy segmentation approach represents an alternative view of the image segmentation process. It provides the means for producing not only fuzzy image regions (as demonstrated in this paper) but also the option for transforming them into crisp image regions (using, for example, the maximum membership values as a simple way of producing a temporary ‘defuzzification’). Using such a capability, properties of both fuzzy image regions and crisp image regions can be used to enrich the feature vector used to allocate image segments to land cover categories. In such sense, fuzzy segmentation can be seen as an improvement of the traditional OBIA approach.
7. CONCLUSIONS
This paper presented a general conceptual framework for image segmentation and proposed a fuzzy segmentation approach as alternative to the traditional OBIA segmentation. The proposed approach can be used to produce land cover classification using three stages: (i) fuzzy segmentation to create fuzzy image regions, (ii) feature analysis, to analyse relevant properties of such regions, and (iii) defuzzification to produce the final allocation of regions to categorical land cover classes.
The fuzzy segmentation approach was tested using two data sets with different spatial and spectral charac-teristics. The information richness carried by fuzzy image regions was explored using ANDI, a contextual index which represents potential spectral overlap between target classes. Land cover classifications using the fuzzy segmentation approach were compared with results obtained using traditional OBIA implementations. Experi-mental results suggest that a fuzzy segmentation approach is a competitive method for land cover classification. Results also confirm its relative independence from specific machine learning techniques and manual parameteri-sation procedures. This suggest that fuzzy segmentation provides an useful framework that could be used in the search for automated classification of huge data sets.
The proposed fuzzy segmentation approach for image classification could be further improved by:
• integrating a method for feature selection (to exploit the complete set of hyper-spectral data sets); and
• including other contextual relations between fuzzy image regions (to evaluate their contribution to increase thematic accuracy)
ACKNOWLEDGMENTS
The authors thank Dr Paolo Gamba at the University of Pavia (Italy), Dr Myriam Ardila at Procalculo (Colom-bia) and Universidad Distrital in Bogota (Colom(Colom-bia) for providing, theuniversity, SPOT-XS and Quickbird-XS data sets respectively. The work reported here is part of a research partially funded by a Birkbeck International Research Studentship.
REFERENCES
[1] Castilla, G. and Hay, G. J., “Image objects and geographic objects,” in [Object-based Image Analysis], 91–110, Springer (2008).
[2] Lang, S., “Object-based image analysis for remote sensing applications: modeling reality – dealing with complexity,” in [Object-based Image Analysis: Spatial Concepts for Knowledge-Driven Remote Sensing Ap-plications], ch. 1, 3–27, Springer (2008).
[4] Blaschke, T., Burnett, C., and Pekkarinen, A., “Image segmentation methods for object-based analysis and classification,” in [Remote Sensing Image Analysis: Including the Spatial Domain], de Jong, S. and van der Meer, F., eds., 211–236, Springer (2006).
[5] Herold, M., Gardner, M., and Roberts, D., “Spectral resolution requirements for mapping urban areas,”
IEEE Transactions on Geoscience and Remote Sensing41, 1907–1919 (2003).
[6] Jensen, J., [Introductory Image Processing: a Remote Sensing perspective], Prentice Hall (2005).
[7] Lang, S., Albretch, F., and Blaschke, T., “Tutorial: Introduction to object-based image analysis,” Centre for Geoinformatics - Z-GIS (2006).
[8] Platt, R. V. and Rapoza, L., “An evaluation of an object-oriented paradigm for land use/land cover classi-fication,”The Professional Geographer60(1), 87–100 (2008).
[9] Thomas, N., Hendrix, C., and Congalton, R. G., “A comparison of urban mapping methods using high-resolution digital imagery,” Photogrammetric Engineering and Remote Sensing 69, 963–972 (September 2003).
[10] Atkinson, P. M., “Spatially weighted supervised classification for remote sensing,”International Journal of Applied Earth Observation and Geoinformation5, 277–291 (2004).
[11] Schneider, W. and Steinwender, J., “Landcover mapping by interrelated segmentation and classification of satellite images,” in [International Archives of Photogrammetry & Remote Sensing, Vol. 32 Part 7-4-3], (XXXX 1999).
[12] Carleer, A., Debeir, O., and Wolff, E., “Assessment of very high spatial resolution satellite image segmen-tations,”Photogrammetric Engineering and Remote Sensing71, 1285–1294 (2005).
[13] Neubert, G., Herold, M., and Meinel, M., “Evaluation of remote sensing image segmentation quality - futher results and concepts,” in [First International Conference on Object-Based Image Analysis - Proceedings], ISPRS (2006).
[14] Rekik, A., Zribi, M., Hamida, A. B., and Benjellounl, M., “Review of satellite image segmentation for an optimal fusion system based on the edge and region approaches,”International Journal of Computer Science and Network Security7(10), 242–250 (2007).
[15] Song, M., Civco, D., and Hurd, J., “A competitive pixel-object approach for land cover classification,”
International Journal of Remote Sensing26, 4981–4997 (November 2005).
[16] Freixenet, J., Mu˜noz, X., Raba, D., Mart´ı, J., and Cuf´ı, X., “Yet another survey on image segmentation: Region and boundary information integration,”Lecture Notes in Computer Science 2352, 21–25 (2002). [17] Pal, N. R. and Pal, S. K., “A review of image segmentation techniques,”Pattern Recognition 26(9), 1277–
1294 (1993).
[18] Bock, M. and Lessing, R., “Remote sensing, formation of objects and determination of quality,” tech. rep., DELPHI-IMM (2002).
[19] Baatz, M. and Schape, A., “Multiresolution segmentation: An optimization approach for high quality multi-scale image segmentation,” in [Angewandte Geographische Informationsverarbeitung XII], et al., J. S., ed., 12–23, AGI Symposium (2000).
[20] Lizarazo, I. and Elsner, P., “Fuzzy regions for handling uncertainty in remote sensing image segmentation,” in [International Conference on Computational Science and Applications (ICCSA 2008)], 724–739, Springer (July 2008).
[21] Benz, U., Hofmann, P., Willhauck, G., Lingenfelder, I., and Heynen, M., “Multi-resolution, object-oriented fuzzy analysis of remote sensing data for GIS-ready information,”ISPRS Journal of Photogrammetry and Remote Sensing58(3–4), 239–258 (2004).
[22] Lizarazo, I. and Elsner, P., “Fuzzy segmentation for object-based image classification,”International Journal of Remote Sensing30(6), 1643–1649 (2009).
[23] Haralick, R. and Schapiro, L., [Computer and Robot Vision], Addison-Wesley (1992).
[24] Gamba, P., “A collection of data for urban area characterization,” in [Geoscience and Remote Sensing Symposium], (2004).
[26] Hastie, T., Tibshirani, R., and Friedman, J., [The Elements of Statistical Learning: Data Mining, Inference and Prediction], Springer (2001).
[27] Duda, R., Hart, P., and Stork, D., [Pattern Classification], Wiley Interscience (2001).
[28] Rogan, J., Franklin, J., Stow, D., Miller, J., Woodcock, C., and Roberts, D., “Mapping land-cover modifica-tions over large areas: A comparison of machine learning algorithms,”Remote Sensing of Environment112, 2272–2283 (2008).
[29] Wood, S., [Generalized Additive Models: an introduction with R], Chapman and Hall (2006).
[30] Smola, A. J. and Scholkopf, B., “A tutorial on support vector regression,” tech. rep., NeuroCOLT2 Technical Report Series (2003).
[31] Breiman, L., Friedman, J., Olshen, R., and C.J.Stone, [Classification and regression trees], Chapman & Hall (1993).
[32] Breiman, L., “Random forests,” Machine Learning45, 5–32 (2001).
[33] Pal, M. and Mather, P. M., “An assessment of the effectiveness of decision tree methods for land cover classification,”Remote Sensing of the Environment86, 554–565 (2003).
[34] Lizarazo, I. and Elsner, P., “Improving urban land cover classification using fuzzy image segmentation,” Accepted for publication, Transactions in Computational Science, Springer (2009).
[35] Congalton, R. G., “A review of assessing the accuracy of classifications of remotely sensed data,” Remote Sensing of Environment37, 35–46 (1991).