1870
RELIABLE LICENSE PLATE RECOGNITION SYSTEM
BASED ON ADAPTIVE NON-PLATE FILTRATION
METHODS
1LAMA ALKHALED, 2MUHAMMAD EHSAN RANA
1, 2 Asia Pacific University of Technology and Innovation,
Technology Park Malaysia, Bukit Jalil - 57000 Kuala Lumpur, Malaysia E-mail: 1[email protected], 2[email protected]
ABSTRACT
This paper proposes a technique to filter out the false negative detection of license plate caused by using edge algorithm to specifying the targeting areas. The proposed technique implements filters bases on the histogram value for the three main channels of the image (RGB). The paper consists of the following three main stages: (a) Detection based on edge detecting method, (b) calculating the histogram values of RGB color model, and (c) finally, verifying and detecting valid license plate regions by applying different histogram- based rules on features extracted out from the calculated histogram values. Experimental results show that the proposed method is very effective in assisting to neglect many noises caused by different conditions such as poor illumination and varied weather
Keywords: license Plate Detection (LPD), Histogram Distribution, Detection Accuracy, False Rejection
Rate (FRR)
1. INTRODUCTION
The accuracy of every detected and recognized identification plate and vehicle in photos taken by surveillance video cameras (SVC) is considered as one of the most crucial factor and has many automated applications depending on it. Such applications include internet of things (IOT), intelligent traffic management (ITS) which include management of toll roads, traffic, crowded areas, speeding and heavy vehicles, and vehicle crimes. One of the major objectives of the SVCs is to capture only the number plates of each and every vehicle as accurately as possible (Hesih et al., 2010). However, this is not the case most of the times as many of false positive nominated blobs caused by using the traditional edge detection method will not be able to be detected using the traditional filtering method, these false positive nominated blobs will be sent as plates to the next stages and will lead to increment in time because of the additional not needed process and decrement in accuracy because of the multiple recognitions caused by detecting both of the non-plate blobs and the real plate (Ming et al, 1996; Jin Chong et al, 2013; Hum et al, 2015).
Most of the current LPR systems and studies consist of the following stages to achieve the target which are as the following as shown in figure 1 (Hum et al, 2014)
Preprocessing: the aim of this stage is to enhance the image by removing the noise, adjusting the lightening, tilting the skewed frames. After doing these steps the image will be sent to the next stage which is plate extraction.
Plate Extraction: the aim of this process is to find the plate out of all the surrounding noises and sending it to the next stage which is plate recognition.
Plate Recognition: the characters will be extracted out of the background and injected to the artificial intelligent classifier to recognize them and convert the image of the plate into text string.
Fusion: this stage aims to maximize the accuracy of the system by publishing only the highly confident results and suppress the others.
1871 techniques are proposed in order to reach the stated aim. First one is working to differentiate the distribution of the RGB channels for the plate from the non-plate nominated blobs while the other one is concentrating on the splitting the foreground from the background.
Figure 1: Stages of LPR System (Hum et al., 2015).
2. PROBLEM CONTEXT
Pattern recognition is very easy for us humans. When we look at a license plate our brains can easily recognize the string of letters and numbers it contains, but when it comes to trusting a computer program’s pattern recognition and decision making, we will encounter many new problems. In order for us to be able to code a computer program that recognizes and analyzes different strings of texts in images accurately, various combinations of advanced programming algorithms must be used. The basic premise for generic license plate recognition (LPR) system is to have an input image containing a visible license plate of a car. The input image can be acquired from a photo taken with a digital camera or we can get it from a frame of a video. Then, the LPR system must be able to recognize and capture only the area containing the
plate and discard all other irrelevant information, such as the car and the background. If the plate recognition is done successfully, the final output image will be free of noise and other artifacts - and it will only contain the letters and numbers of the license plate. To find the right blob which a plate in LPR system out of all the surrounding noises in the nominated binary image is one of the challenging task (Qin et al, 2016). License plate detection (LPD) is widely used to automate different application related to traffic and vehicle management with least human observation.
Many algorithms are proposed by different researchers using different features to generate the proper binary image which has the plate for the plate detection system. Some of the researchers are using edge statistics (Jin Chong et al, 2013; Hum et al, 2015; Hooi Sin ng, 2015), mathematical morphology methods (Song Qing-kun, 2012), color classification (Vijeta et al, 2016) to find out the plate. While other researchers suggested using Hough transform in order to detect the lines which considered as one of the major features in the plate regions (Hum et al, 2016). Implementing sliding windows as a segmentation technique to extract candidate plate region was also used. Artificial intelligence classifiers such as fuzzy logic, neural network, adaboost and haar features cascade have been also applied in detecting license plates (D. Cui, 2009; Hamam and Azlinah, 2015). In the other hand, some researchers prefer a hybrid detection algorithm, where license plate location method based on characteristics of license shape, character connection and projection was presented (Hooi sin et al, 2015). The main challenges faced in the previous proposed techniques are either they are still limited to some type of noise or they need a lot of processing time which prevent them to be used for real time implementation. The reason behind facing these kind of challenges can be summarized as follows:
1872 non-plate blobs which will be sent to the recognition stage for not-needed additional processing and will drop the accuracy and processing time of the whole LPR system (Zhang & Sun, 2011; Khare et al, 2016). The aim of the research is how to find better non-plate filtration techniques that receive the image of conventional Sobel edge detection as an input and able to perform well in removing the false detected plates in different lightening scenarios with a fast time to increase the performance of the whole proposed LPR system.
3. RELATED LITERATURE WORKS
[image:3.612.309.528.74.423.2]As the main target of the whole conducted research is to find proper filtration technique to remove the non-plate blobs nominated by the thresholding methods. This section tries to find all the works similar to the proposed work in order to conduct a comparison. The comparison will cover the purpose of the work, results, advantages, and disadvantages as the following table:
Table 1: comparison among different researchers in the field noise removal
Autho
r Title Purpose Result Advantage Disadvantage
Qin et al. (2016) Video scene text frames categoriza tion for text detection and recognitio n Differentia ting the text area from the non-text ones True positive accuracy was 80.8% Combine multiscale global and local features Heavy in computati on as it is relying on canny and Sobel thresholdi ng technique s to extract local and global features Khare et al. (2016) A quad tree based method for blurred and non-blurred video text frames classificati on through quality metrics new method for classifying blurred and non-blurred frames in video Correct classificat ion for blur and non-blur frames is done with the accuracy of 87.3% A good preprocess ing stage to enhance the overall performan ce of the plate detection Too complicat ed features are used to differentia te the blur from the non-blur frames which is considere d not that crucial in the work of LPR Kaush ik, et al. (2015) Parallelogr am and Histogram based Vehicle License Plate Detection Finding the false positive blobs during the plate detection stage True positive accuracy was 82.5% on limited dataset (20 A simple histogram of the HSV colour is calculated to find the nominated
The technique is able to find limited type of noises restricted
plates) region to certain
condition. Noises like car’s brand are not able to be detected Hum et al. (2015) Eliminatio n of Signal-resembled Anomalies in Detected Plate The proposed method amplifies the slight differences between the non-character blobs and the character blobs to enhance the tractability True positive accuracy was 85.44% Sift features are calculated among the different blobs to find the distances among them work assists in finding the noise attached with the plate not to differ-entiate between the noises and plates Hoi Sin et al. ( 2014) Car plate detection based on convention al edge detection technique Detecting the car plate using sobel thresholdin g method True accuracy of the plate detection was 81.33% The process is too fast and relying on Sobel thresholdi ng technique Simple noise detection methods are used based on the geometric features of the blobs as height, width, ratio, and compactn ess
In addition to the related academic search and comparison, the work tries also to search to list and compare the similarities and differences between the features of the closest prior arts to the proposed work. The aim to do this kind of research is to know the ability of implementing the work in the real life as shown in table 2.
Table 1: similarities with the prior art related to the same work
Prior Art Similarities Differences
US 2013 / 0294654
A1 - Both works use the histogram
calculation in the license plate recognition system.
- Prior art implements the projection of gray scale histogram to split the character of the plate in the recognition stage.
1873
histogram on RGB channels in addition to rules applied on five different nominated binary images.
US 2013 / 5843794
A1 - Both works use the histogram
calculation in the license plate recognition system.
- This invention implements HAAR features to get the plates and determines the false positive blob based on the recognition values of SVM classifier and histogram values of HSV channels
- The propose work uses the conventional edge detection for plate extraction and determines the false positive blob based on conditions applied on the calculated values of histogram on RGB channels in addition to rules applied on five different nominated binary images.
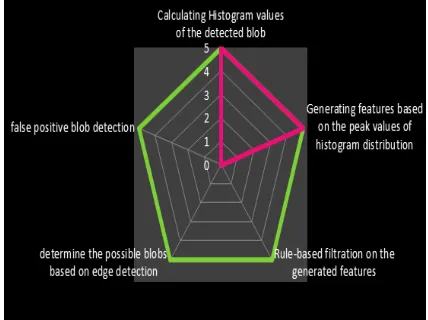
[image:4.612.88.302.515.675.2]A spider chart is been generated to find the percentage of the similarities between the two works
Figure 2:Spider chart for similarity comparison.
4. RESEARCH METHODOLOGY
One of the main challenges in computer systems is to propose a right research methodology which able to provide a practical implementation and evaluation of the proposed solution. Number of researchers from the field of computer science and from outside had spent a huge efforts to define a proper guidance on how to design science research which can be implemented successfully in engineering, computer science, and information system (Adams et al, 2004). The key points of the guidance are as the following (Chatterjee et al., 2005):
Disseminate the appropriate reference literature
Characterize the goals
Differentiate between the theory and testing research.
Design Science Research Methodology (DSRM) is proposed to be used as an efficient method for technology evaluation (Chatterjee et al., 2005) to achieve the main goal related to evaluate the performance of the proposed LPR system. DSRM method has all the required principles, practices, and procedures in order to perform a well research. The criteria to measure the efficiency of the research are: it is relevant with the conducted literature review, it is a good base to perform the required design research, and it is a good example to show and measure the design search in computer application. The following stages are implemented to complete the research
Problem Identification and Objective Definition,
Design and Development
Demonstration
Evaluation
Conclusion
3.1 Problem Identification and Objective
Definition
1874 performing should be defined and fully considered as one of the main critical factors for commercial product. Thus the main contribution can be summarized as the finding a proper non-plate regions detector for simple binarization technique that able to work in an open environment with fast and accurate performance.
3.2 Design and Development
The artifact of the work is a framework for an IT application that performs license plate recognition task. The work will be able to find a proper filtering for non-plate regions on the stage of plate detection to achieve the task in fast time and high accuracy. The steps of the conducted development stage proposed by DSRM can be summarized as the following.
The conventional LPR system consists of three main stages which are: initialization, plate detection, and plate recognition as shown in figure 2.1. As the proposed work mainly applied on the plate level, only LPD will be discussed in both the initialization and the plate detection stages.
In the initialization stage, the image will be grabbed out from the camera stream in order to be processed. As the car plate might appear in some specific region of the scene, there is no point to process the whole image. For the previous reason, a region of interest (ROI) is specified to process the only part of the image falling into the ROI and neglecting the other areas. This stage will assist in speeding up the performance by processing only specific region rather than to process the whole image. The region will be sent to the next stage which is plate detection. The main steps of the plate detection are explained in the figure below:
As the colors are not needed in the task of specifying the plate, grayscale conversion is applied first to shift the image from Red, Green, Blue scale to the gray level. The reason behind the conversion is the fact that plate can be located based on the difference of contrast regardless the color of the image. Using grayscale image will increase the efficiency as RGB image contains three channels which are red, green and blue while grayscale image only contains single channel which reduce the needed computation.
[image:5.612.312.526.69.316.2]Grey =
Figure 3: Steps of License Plate Detection.
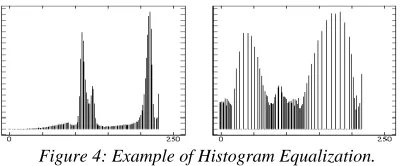
After converting the image, histogram equalization is performed on the grayscale image to uniform the distribution of intensity level. In another meaning, histogram is a representation of the frequency distributions of the grayscale values from 0 (dark) to 255 (bright). Histogram equalization helps to enhance the image by distributing the intensity levels in evenly. It will help to balance some of the issues that we may face as over-dark, over-bright, low contrast, and high contrast images. This step will assist in giving more enhanced image features for the next steps in the LPR system. The process is explained in the figure below:
Figure 4: Example of Histogram Equalization.
[image:5.612.314.514.524.607.2]1875 (matrix) will be provided to substitute for the image by using zero padding as below
Figure 5: Process of Smoothing the Image
After smoothing out the details, finding plate from the image will be the next task. To achieve that and based on the fact that the plate consists of two highly different colors in contrast such as black and white, red and white, or green and black. Simple edge detection method following Sobel concept will be applied to binarize the image as the following. Difference between the left and the right edges of each pixel will be calculated and compared to the threshold value. In case the calculated value exceeds the assigned threshold value, pixel will be assigned as foreground or it will be assigned to the background of the image. This means, thresholding will turn each pixel of the image to either black (value of 0) or white (value of 255) depending on the calculation of the values. Right after performing edge detection, dilation algorithm will be applied to the image for the purpose to close any gap in the detected binary edges. By applying dilation the algorithm enlarges the boundaries of the pixels of relevant information resulting in expanding the structures of the image. When the boundaries of the shapes are enlarged, small holes inside the shapes become smaller or even disappear from the image. Dilation works by checking the surrounding pixels of every single pixel, and if any of the surrounding pixels has the value of 255, the middle pixel’s value will also be changed into 255. If the middle pixel’s value is 255,
but none of the surrounding pixels have the value of 255, the middle pixel’s value will be changed into 0.
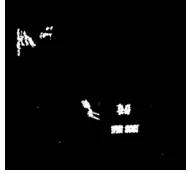
To get the connected regions as individual nominated blobs out of the binary image, connected component labeling method is applied to isolate the connected areas into separated regions (blobs). The technique will be applied by checking the upper and the left pixels of the target pixel to assign label to them. After assigning the labels to the pixel, labeling correction is done by scanning the pixels again to avoid getting two or more labels in the same region. All the pixels which have same label will be considered as one blob and will be sent to the next stage to know whether it is a real plate or not. All the previous mentioned stages to get nominated blobs out of the whole image will be shown in a real scenario as below:
Figure 6: Steps Required to Get the Nominated Blobs for Plate Recognition.
[image:6.612.369.463.318.405.2]After getting the nominated blobs to be plates, a very simple filtration method can be applied to remove some of the clear non-plate blobs. These techniques are based on the geometric features as the size of the blob, orientation, width to height value, white pixels density. The output of applying these simple filtration methods on the whole nominated blobs will be as below
Figure 7: Remaining Nominated Blobs after Applying Basic Filtration Methods
[image:6.612.369.464.562.649.2]1876 RGB level called RGB histogram-based rules which rely on the simple edge detection method to locate the nominated areas. After locating the areas, RGB histogram-based stage is applied to remove as much noise as we can. The Second stage called OTSU-based stage is based on filtering the remaining blob by proposing an adaptive OTSU thresholding technique. Both of the proposed techniques are going to be discussed in detail in the following section.
3.2.1 Rule-based histogram filtration stage
[image:7.612.95.301.495.635.2]As we can notice from the figure 6, multiple blobs are nominated to be plates as they are overriding the filtering conditions and having properties similar to the plates (compactness, size, ratio, etc), unfortunately all of them are inaccurate plates but one. For that reason another filtration method should be proposed in different level to be able to filter them. As the plated will be in color mode which has three known channels called red, green, and blue, method relying on the distribution of the different channels has been suggested. By calculating the distribution of the different colors channels, dedicated condition had been proposed to be applied in the purpose to filter out noise from the real plate in the LPR system as clarified below. By using Histogram values for all three RGB channels, we analyze that specific conditions might be applied to filter out noise based on studying the intensity distribution of Histogram values for license plate available in our database. This is illustrated in figure 7.
Figure 8: RGB Histogram Distributions for Car Plates.
Histogram distribution for each channel is divided into five ranges S1[0,50] , S2[50,100] , S3[100,150], S4[150,200], and S5[200, 255]. Following values are calculated for each channel to be used later in the filtration process:
(PeakRi , PeakGi, PeakBi) Number of peaks values that exceed 100 for each range.
(IndRi, IndGi, IndBi) Index of max value for each range.
(MaxIndR, MaxIndG, MaxIndB) Index of max value among all the ranges.
Where i [1 ,5]
Different filters are applied using the distribution of the RGB channels (Lama and Babak, 2017)
Rule1: Non Standard color detector based on color
variance MaxDiff > 70 Where
MaxDiff = abs (MaxIndR – MaxIndG)
Rule2: Multi-colors detector based on extreme
color
((SumPR > 15) && (SumPG > 15) && (SumPB > 15)
&&
((PeakR3> 2) || (PeakG3> 2) || (PeakB3 > 2)) Where
SumPR = PeakR1 + PeakR2 + PeakR3 + PeakR4 + PeakR5
SumPG = PeakG1 + PeakG2 + PeakG3 + PeakG4 + PeakG5
SumPB = PeakB1 + PeakB2 + PeakB3 + PeakB4 + PeakB5
Rule3: Beams detector based on dominant color
(MaxIndR > 200 && MaxIndR < 235 && PeakR1 == 0 && PeakR2 == 0 )
OR
(MaxIndG > 200 && MaxIndG < 235 && PeakG1 == 0 && PeakG2 == 0 )
OR
(MaxIndB > 200 && MaxIndB < 235 && PeakB1 == 0 && PeakB2 == 0 )
1877
Figure 9. Samples of Detected Blobs for Each Rule in the Rule-Based Histogram Filtration
3.2.2 OTSU-based stage
As the generated binary image of the Malaysian plate has some unique characteristics. These characteristics might be used in a way to differentiate the real plate from the non-plate blobs which pass the histogram-based and the initial basic filtration rules. The unique features are based on the relation among the contents of the blob itself which called sub blobs. In more details, the sub blobs of the plate which are the characters and the digits have common feature as similar height, similar with, standard gaps. By designing some rules and weights based on these relation, a proper filtration method can be achieved and the nominated clear binary image will be send for the next character recognition stage. The main challenge of the proposed filter is to find the best thresholding method that able to separate the foreground from the background and provide a clear binary image with proper relation among the sub blobs. As the source of the binary image is the gray image, a right calculation of the gray scale value is very important due to the fact that the images are captured in adverse conditions with different lightening. These factors might lead to make process of isolating the characters which are the foreground from the background as a challenging process. For that reason, a wrong estimation of the gray values might lead to binary plate image without clear and correct relation between the sub blobs which lead to wrong filtration in addition to wrong recognition. To avoid that, background based calculation (BBC) step is applied on each individual input nominated blob from the histogram-based filtration stage as the following:
BBC will find the mean and std value of the gray scaled input blob to be used for grayscale calculation based on different scaling values. Different scaling values for each mean and standard deviation in the applied equation will help to generate five nominated grayscale images. The generation is based on the idea of assigning a different scale to the variance before adding it to the mean. The scale ranges from -0.5, -0.25, 0 , 0.6, 0.8 and the values used to generate the different grayscale images are as the following:
iVal1 =
iVal2 =
iVal3 =
iVal4 =
iVal5 =
To generate the new output gray image for each value the following condition will be used for grayscale generation
If image pixel value < iVali then image pixel value
iVali = else no change
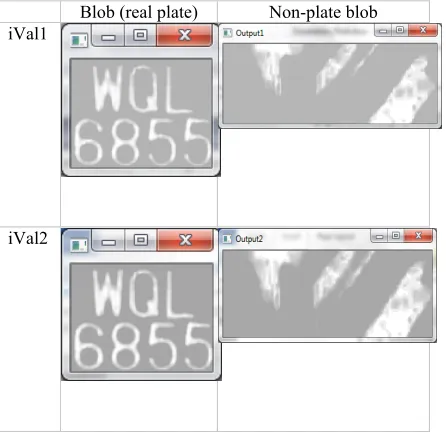
Blob (real plate) Non-plate blob iVal1
1878
iVal3
iVal4
[image:9.612.88.533.62.468.2]iVal5
Figure 10: Different Output Grayscale Images Based on BBC Stage
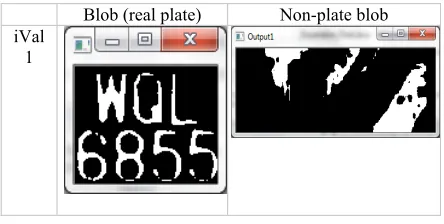
Similar OTSU binarization method will be applied on the five images to produce different five binary images. Otsu method is a global common thresholding technique calculates the value which maximize the inter variance among the two different classes. The five output binary images for both plate and noise are shown in the figure below
Blob (real plate) Non-plate blob iVal
1
iVal 2
iVal 3
iVal 4
iVal 5
Figure 11: Different Output Binary Images Based on GT Stage
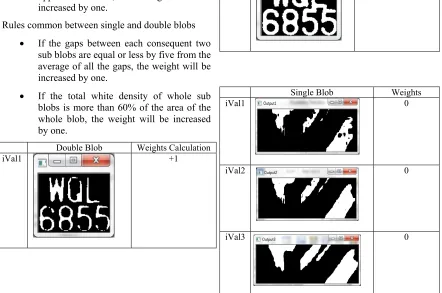
[image:9.612.84.306.541.653.2]1879 Single blob double blob
Figure 12: Types of the Blobs
Specific rule for single blob is as the following:
If the height of all the sub blobs are more than 80% of the height of the blob itself, the weight will be increased by one
If the width of each sub blob is equal or less by five from the total width of the blob divided by the total number of sub blobs, the weight will be increased by one Specific rule for double blob is as the following:
If the height of all the sub blobs are more than 30% and less than 60% of the height of the blob itself, the weight will be increased by one
If the width of each upper part sub blob is equal or less by five from the total width of the blob divided by the total number of upper sub blobs, the weight will be increased by one.
Rules common between single and double blobs
If the gaps between each consequent two sub blobs are equal or less by five from the average of all the gaps, the weight will be increased by one.
If the total white density of whole sub blobs is more than 60% of the area of the whole blob, the weight will be increased by one.
Double Blob Weights Calculation
iVal1 +1
iVal2 +2
iVal3 +4 (Chosen Blbo)
iVal4 +1
iVal5 +1
Single Blob Weights
iVal1 0
iVal2 0
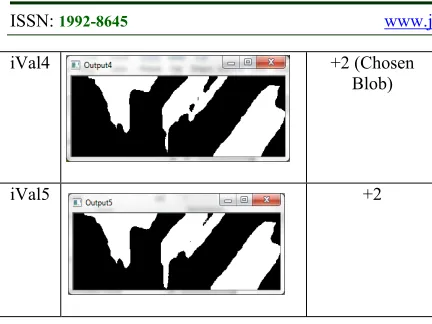
1880
iVal4 +2 (Chosen
Blob)
[image:11.612.85.301.68.230.2]iVal5 +2
Figure 13: Evaluation and Weights Calculation
The best calculated weights will be compared with a threshold value which is 3 in our case to decide whether to proceed for the next stages or not.
iVal3 +4 (chosen
Blob) will be sent to the next stage
iVal4 +2 (chosen
blob) will be removed as noise
Figure 14: Evaluation and Filtration Stage
3.3 Demonstration
Testing will be carried using the plates gathered in the data collection stage, once the artifact is completed. The data will be implemented to it and the accuracy will be calculated. The suggested thresholding and rules values will be tuned based on experiment till reaching to the satisfied accuracy level. To verify that the proposed method is a good method, comparison and evaluation with other methods suggested by other researchers will be done before finalizing the values and the proposed techniques
3.4 Evaluation
This stage consists of discussing the results of the proposed technique to evaluate whether the target objectives are achieved successfully or not.
5. EXPERIMENTATOIN AND ANLAYSIS
All the works related to propose the non-plate filtration techniques and the stages of the LPR system needed to be used are covered in the previous chapters. In the current chapter, the aim to prove that the proposed system is accurate and fast which replied the last two research questions is going to be conducted here. The main purpose of this part is to prove achieving the stated goals by evaluating the performance of LPR using testing and experimental methods. The experimental tests are done to calculate over the proposed system to prove the following:
Accuracy of the developed two non-plate blob filtration techniques
Ability to use the proposed LPR system as a commercialized system.
4.1 Experimental Tools
This section emphasis on how the data had been collected by the researcher to be used in the experiments of the proposed LPR system. Gathering a proper data is one of the crucial conditions to get correct deliverables out of the proposed research. On the other hand, nominating the correct calculation metric to measure the performance of the research is very important. To achieve the previous, evaluation criteria should be dedicated carefully to be able to measure the level of achieving the objectives.
4.1.1 Data collection
[image:11.612.85.303.299.491.2]1881
Table 3: Gathered Database as an Output of the Observation Method
Total images (plates)
One row license
plate (rectangle
plate)
Two lines license
plate (square
shape)
Reversed color plate
(Taxi plate)
[image:12.612.86.304.220.300.2]522 350 100 72
Table 4: Sample of Different Existed Plates in Malaysia
Single Line/Car Double format/Ca
r
Taxi plates
4.1.2 Evaluation criteria
The evaluation criteria will be using the benchmarking concept which is based on comparing the performance of the solution with other prosed solutions. Benchmarking is going to be applied into two levels; the first level is relying on evaluating the performance of the proposed non-plate filtration methods which is called engine evaluation. The second evaluation is related on evaluating the performance of the whole LPR system with other proposed commercial LPR solutions. This kind of benchmarking called system evaluation. To test the performance, true positive, false positive and false negative factors are calculated to measure the overall accuracy of the LPD system. True positive means the number of noise detected as noises while false negative is the plate detected as noise. At the end, the false negative refers to the missed plates as the plate kicked as noise. The overall accuracy of the LPD system can be calculated as the following:
Accuracy of filtration (Precision) = (true positive – false negative) / (total number of noises)
For the benchmarking stage, the full LPR performance is compared based on calculating the following metrics:
LPR True Positive: refer to the number of the plate recognized correctly
LPR False Negative: refer to the number of the plate which are missed as they are detected as noises
LPR True negative: refer to the number of the noises which recognized as plates.
LPR Precision = LPP True Positive / total number of plates
4.2 Accuracy of Rule-Based Histogram
Filtration
The accuracy of the three proposed filtration rules based on the distribution of the RGB channels is calculated based on the data collected as mentioned. The three proposed filters are as the following:
Filter1: Non Standard color detector based on color variance.
Filter2: Multi-colors detector based on extreme color.
Filter3: Beams detector based on dominant color.
The distribution of the RGB channels for the real plates collected in the databased looks as the following:
The testing is applied on a video which contains 522 cars captured during daylight as shown in the figure below. The resolution of the frame is 800 times 600. The over noise kicked by the three histogram filtration rules is shown in the table below tacking into consideration that the total number of noise caused by the edge detection over the whole video is 2445 blobs and the total number of the real plates is 522
Table 5: Results of Histogram-Based Filtration
Filter True Positive False negative Filter 1 117 2 Filter 2 154 1 Filter 3 989 12
[image:12.612.308.528.580.654.2]Based on the proposed evluation model proposed, Accuracy is calculated for these filters and the overall proposed technique as the following:
Table 6: Accuracy of Histogram-Based Filtration
Filter Accuracy of filtration Filter 1 4.7% (117-2)/2445 Filter 2 6.2% (154-1)/2445 Filter 3 39.9% (989-12)/2445 Rule-Based Histogram
Method 50.9% (1260-15)/2445
4.3 Accuracy of OTSU-Based Filtration
1882 category for each nominated grayscale out of the five nominated images. The final accuracy of the proposed OTSU-based stage is calculated based on applying the rule to get the best grayscale image out of the five images and make the decision. The detected noise remained after applying the rule-based histogram filtration stage is 2445 – 1260 = 1185. These noises are classified into double and single noises relying on calculating the ratio between the height and the width.
Table 7: Classifying the Plate and Noise into Double and Single
Single Double Noise 739 out of
1185 446 out of 1185 Plate 345 + 43 = 393 90 + 29 = 129
[image:13.612.83.306.400.478.2]By applying OTSU-Based method on each nominated grayscale for each single and double plate, the calculations of the true positive and the false negative for single blobs are as the following:
Table 8: True Positive and False Negative for Single Blobs using OTSU-Based Filtration
Score
1 Score 2 Score 3 Score 4 Score 5 True
Positive 510 488 422 465 498 False
[image:13.612.84.307.514.587.2]Negative 10 7 4 5 11
Table 9: True positive and false negative for double blobs using OTSU-based filtration
Score
1 Score 2 Score 3 Score 4 Score 5 True
Positive 376 324 298 322 353 False
Negative
7 4 3 7 8
The calculation of the accuracy for filtration for both single and double noises will be as the following
Table 10: The Filtration Accuracy for Detected Noises by Edge Detection
Score
1 Score 2 Score 3 Score 4 Score 5 Singl
e 67.5% (510- 65.08% 57.2% 62.24% 65.89%
Noise 10)/73 9
(488-7)/739
(427-4)/73 9
(465-5)/739
(498-11)/73 9 Doubl
e Noise
69.2% (316-7)/446
58.2% (264-4)/446
50.4 % (228-3)/44 6
57.1% (262-7)/446
63.9% (293-8)/446
As the proposed method is based on nominating the best score to be sent for the decision making level, the calculation of the filtration accuracy for both single and double blobs are done again to find the accuracy of the proposed OTSU-based stage as the following:
Table 11: Accuracy of OTSU-Based Method
Nominated Score Single Noise 61.5% (457-2)/739 Double noise 59.8% (268-1)/446
6. CONCLUSION
The main aim of the research is to achieve the goal stated at the begging which is related to enhance the performance of the LPR system by enhancing the filtration on the detection stage based on conventional edge detection method. To achieve the enhancement on the engine level and the whole system level two stages are done which are
‐ Proposing a filtration rules that works in different environments and illumination with the ability to remove as much as possible noises without removing the real plate
‐ Providing a reliable LPR solution which can be used in the real time application with good accuracy and performance.
At the end of the research, the two achievements of the research are as the following:
‐ Propose a filtration method based on RGB histogram which able to remove three types of different noises called:
Non-standard colour detector based on colour variance
Multi-colours detector based on extreme colour
1883 This stage is applied on the RGB image and able to filter different type of noises. On the other hand, another method based on proposing OTSU-rule is done. The method is based on generating different grayscale images to tackle illumination issues. Then the images will be binarized using OTSU techniques. At the end, a designed rules are applied to score the blob and decide with the blob is a noise or not.
‐ The second achievement is related to propose a practical LPR system that can be used in real life application with high accuracy.
7. SUMMARY
The Final proposed system is based on applying the rule-based histogram method as the first stage then the output will be applied on the OTSU-based stage to finalize the plated detection method. The nominated blobs out of the detection stage will be sent to the next plate recognition stage.
The proposed two methods are able to remove 88.44% of the total noise created by using traditional edge detection method. This enhancement will add a great value to the LPR system by decreasing the error rate caused by recognizing two results one is related to the correct plate and the other related to the results of noise which is detected as real plate. The previous type of error in LPR system called as double recognition error. On the other hand, the proposed two filtration methods is adding a great value to the processing time by removing a lot of noises on the detection stage and save the waste time needed to process them in the recognition stage.
REFRENCES:
[1] Adams, L., and Courtney, J, “Achieving Relevance in IS Research via the DAGS Framework”. 37th Hawaii International Conference on System Sciences, Big Island, Hawaii: IEEE, 2004.
[2] Chatterjee, S., Tulu, B., Abhichandani, T., and Li, “H. SIP-based Enterprise Converged Network for Voice/Video over IP: Implementation and Evaluation of Components”. IEEE Journal on Selected Areas in Communications - Recent Advances in Managing Enterprise Network Services, 23, 10,
2005.
[3] Chai Yan Hum, Meng Kim Liang, Woon Hock Hon, Mokayed Hamam, and Wee Khin Lai, “Elimination of Signal-resembled Anomalies in Detected Plate”, IAE CONFERENCE
SYSTEM, The 3rd IIAE International
Conference on Intelligent Systems and Image Processing, 2015.
[4] Chai Yan Hum, Meng Kim Liang, Woon Hock Hon, Yuen Shang Lee, “Non-standard Malaysian car license plate recognition” ,
Computer Applications and Industrial Electronics (ISCAIE), 2014.
[5] D. Cui, Dong, B. Gu, H. Cai, and J. Sun, “ License plate detection algorithm based on Gentle AdaBoost algorithm with a cascade structure”, IEEE International Conference on Robotics and Biomimetics, 2009.
[6] G. H. Ming, A. L. Harvey, and P. Danelutti, “Car number plates detection with edge image improvement”. In 4th International Symposium on Signal Processing and its Applications,
1996.
[7] Hamam Mokayed and Azlinah Hj Mohamed, “Adaptive Generic Classifier for Structured Documents”, Proceedings of the IASTED International Conference Artificial Intelligence and Applications (AIA 2014), Innsbruck, AT, ACTA Press, 2015, p. 161-168, ISBN
978-0-88986-943-1.
[8] Hooi Sin Ng, Yong Haur Tay, Kim Meng Liang, Hamam Mokayed, and Hock Woon Hon, “Detection and Recognition of Malaysian Special License Plate Based On SIFT Features”,
Computer Vision and Pattern Recognition.,
2015.
[9] Jin Chong , Chen Tianhua , Ji Linhao, “License Plate Recognition Based on Edge Detection Algorithm”, Intelligent Information Hiding and Multimedia Signal Processing,2013.
[10] Kaushik Deb ; Hyun-Uk Chae ; Kang-Hyun Jo, “Parallelogram and Histogram based Vehicle License Plate Detection”. Smart Manufacturing Application, 2008. ICSMA
2008.
[11] Lama Alkhaled and Babak Bashari Rad, “RGB Histogram-Based Filtration to Enhance the Accuracy of Automatic License Plate Recognition”, International Journal of Computer Science and Network Security,
(IJCSNS) 2017.
1884
Conference on Pattern Recognition (ICPR),
2016.
[13] Song Qing-kun ; Yuan Hui-jun ; Zhou Teng, “License plate recognition based on mathematical morphology method and RBF neural network”, Measurement, Information and Control (MIC), 2012.
[14]Vijeta Khare; Palaiahnakote Shivakumara , Ahlad Kumar, Chee Seng Chan, Tong Lu, and Michael Blumenstien, “A quad tree based method for blurred and non-blurred video text frames classification through quality metrics”,
23rd International Conference on Pattern Recognition (ICPR), 2016.
[15] Zhang X, Sun F, “Pulse coupled neural network edge based algorithm for image text locating”,