P R O C E E D I N G S
Open Access
Identity-by-descent graphs offer a flexible
framework for imputation and both linkage
and association analyses
Elizabeth Marchani Blue
1*, Charles YK Cheung
2, Christopher G Glazner
3, Matthew P Conomos
2, Steven M Lewis
3,
Serge Sverdlov
3, Timothy Thornton
2, Ellen M Wijsman
1,2From
Genetic Analysis Workshop 18
Stevenson, WA, USA. 13-17 October 2012
Abstract
We demonstrate the flexibility of identity-by-descent (IBD) graphs for genotype imputation and testing
relationships between genotype and phenotype. We analyzed chromosome 3 and the first replicate of simulated diastolic blood pressure. IBD graphs were obtained from complete pedigrees and full multipoint marker analysis, facilitating subsequent linkage and other analyses. For rare alleles, pedigree-based imputation using these IBD graphs had a higher call rate than did population-based imputation. Combining the two approaches improved call rates for common alleles. We found it advantageous to incorporate known, rather than estimated, pedigree relationships when testing for association. Replacing missing data with imputed alleles improved association signals as well. Analyses were performed with knowledge of the underlying model.
Background
Patterns of identity-by-descent (IBD) sharing within and across pedigrees are fundamental for the understanding of genetic variation, including its distribution, origin, and relationship to phenotype. Recent analytical and computational advances have allowed us to estimate the distribution of patterns of IBD sharing in large and complex pedigrees using the program gl_auto in the MORGAN v3.1 package (http://www.stat.washington. edu/thompson/Genepi/pangaea.shtml). These estimates are computationally intense: for example, 727 cpu min-utes for family 10 (83 members) on an Intel L5427 Xeon 2.50-Gz processor. However, the resulting sampled IBD graphs can be quickly reused for several types of analysis, including genotype imputation in pedigrees [1], or obtaining [2] and refining a linkage signal [3]. At Genetic Analysis Workshop 18 (GAW18), we used these sampled IBD graphs for (a) imputation of genotypes in pedigrees compared with a“population-based” method
that uses an external reference panel, (b) linkage analyses using both parametric and variance components models, and (c) association testing of both observed and imputed genotypes using two strategies to incorporate relation-ships between subjects.
Methods
Genetic map and markers
We analyzed GAW18 marker data for chromosome 3. We did not use the GAW18 sequence data because it included imputed variants, although our methods would work for sequence data as well. We obtained genetic map positions (cM) for the genome-wide association studies (GWAS) markers from the Rutgers sex-averaged interpolated posi-tions of dbSNP Build 134 (http://compgen.rutgers.edu/ maps), excluding the 116 loci missing values. Kosambi posi-tions were converted to Haldane posiposi-tions to suit assump-tions made by the Lander-Green algorithm [4]. We found no Mendelian inconsistencies using Loki v2.4.7 [5] in the 65,403 markers. For linkage and association analyses, we removed markers with minor allele frequency (MAF) less than 0.05 (13,139 markers) and/or greater than 5% missing data (4,939 markers), leaving 48,892 markers for analysis. * Correspondence: [email protected]
1
Division of Medical Genetics, Department of Medicine, University of Washington, Seattle, WA 98195, USA
Full list of author information is available at the end of the article
Phenotype and families
We began with the simulated diastolic blood pressure at time point 1 from SIMPHEN.1.csv. Given the contents of the answer key to the simulated data, we included age, sex, age*sex, and treatment in a linear regression model. The residuals are our adjusted phenotype values.
We analyzed 7 families showing evidence of cryptic relatedness in the hope of reducing genetic and allelic heterogeneity in our trait. Using all available GWAS data, we estimated kinship coefficients between all pairs of indi-viduals in the data set using both the KING-robust [6] and REAP [7] methods to accommodate admixture, explained in detail elsewhere [8]. As is standard quality control in pedigree studies, pedigree relationships were validated by empirical estimates of kinship. Pairwise kinship coefficients exceeding those for second cousins were observed for subject pairs across families 5 to 8, 10, 21, and 25. These families were used in BEAGLE [9] imputation and SOLAR [10] association analyses described later. Family 10 was chosen for further analyses because it was the family with the strongest evidence of association to our trait [8].
Estimation of identity-by-descent sharing
A single set of IBD graphs was used for all pedigree-based analyses. We used a subset of 351 markers with an average spacing of one marker per 0.65 cM, choosing the marker at each targeted region with the highest value of hetero-zygosity multiplied by the number of observed genotypes to generate IBD graphs with the program gl_auto. Markov-chain Monte Carlo sampling with a state-of-the-art hybrid sampler [11,12] allowed us to use both large pedigrees and many markers. We saved every 50th [12] of 50,000 sampled realizations of IBD graphs for chromo-some 3, conditional on all observed genotypes, the genetic map, and pedigree structure [13].
Imputation
We used the program GIGI to impute genotypes depen-dent on the sampled IBD graphs [1]. Imputation markers
were not in the framework set used to produce IBD graphs. For each imputation marker, a set of genotypes for all subjects was sampled from the genotype probability distribution, given observed data at the imputation marker in some subjects, the sampled IBD graphs, allele frequen-cies, and the meiotic map. Genotype and allele probabil-ities were then averaged across the sampled IBD graphs. We called both alleles of a missing genotype if Pr(geno-type) greater than 0.8, and otherwise called one allele if Pr (allele) greater than 0.9. Genotypes failing to meet these criteria were not called.
For comparison, we also used BEAGLE [9], which uses an outside reference panel of genotypes and population-level linkage disequilibrium to impute marker informa-tion among unrelated individuals. We compared results using three reference panels: the genotyped subjects from family 10 andthe other families (experiment F10 + FO), only samples from family 10 (experiment F10), and the other families without family 10 (experiment FO). BEAGLE’s 3,621 scaffold markers were chosen to be common (MAF >0.3) and evenly spaced (at least 0.05 cM apart). As with GIGI, we called both alleles of a missing genotype if Pr(genotype) greater than 0.8 and otherwise called one allele if Pr(allele) greater than 0.9.
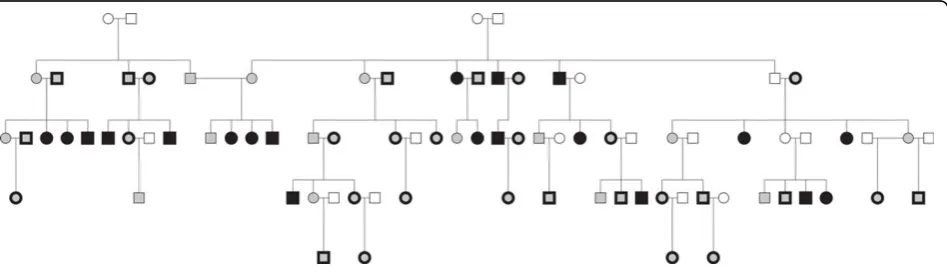
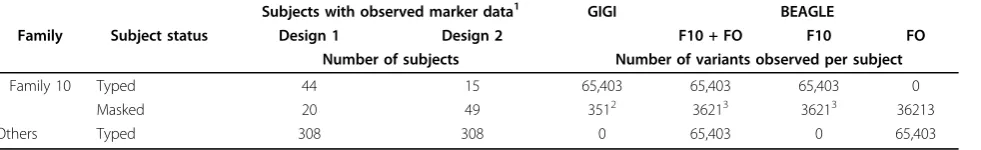
We imputed genotypes on family 10. We masked most genotypes in a subset of subjects for evaluation of imputa-tion metrics (Figure 1, Table 1): 20 subjects in design 1 and 49 subjects in design 2. Masked subjects were selected to preserve some“observed”genotypes in each branch of the pedigree. Imputation metrics were estimated at all imputation markers, which excluded both GIGI fra-mework markers and BEAGLE scaffold markers. Metrics for evaluation were (a) call rate, which is the percent of alleles called, and (b) accuracy, which is the percent of alleles called correctly among called alleles. We averaged these metrics across masked variants and subjects. We define rare variants as those with MAF less than 0.05.
Intrigued by the complementary data used by BEAGLE and GIGI, we evaluated a combination of their results.
Figure 1Pedigree structure of family 10. Filled: genotyped. Open: m
Using design 2 data, we first used GIGI to call both alleles if Pr(genotype) greater than 0.99 or to call one allele if Pr(allele) greater than 0.995, thus only calling alleles if essentially forced by the pedigree data. For loci with uncalled genotypes, we then used results from BEA-GLE F10 + FO with call thresholds Pr(genotype) greater than 0.8 and Pr(allele) greater than 0.9. For loci with one uncalled allele by GIGI, we accepted the BEAGLE geno-type if it included the single allele called by GIGI.
Linkage analysis
We computed lod scores for family 10 and all cryptically related families at a subset of 44 positions from the IBD graphs, yielding a spacing of approximately 1 lod score per 5 cM. To obtain multipoint lod scores, we (a) used the program IBDgraph [13,14] to identify equivalence classes among the realized IBD graphs at each position [2], (b) computed likelihoods for one representative of each equivalence class at each position with the mlink program [15], and (c) computed a weighted average from the sampled IBD graphs to obtain an estimate of the multipoint lod score for the trait at each position [16].
We tested three parametric models. Model 1 is a quantitative trait locus (QTL) model with parameters defined by the single-nucleotide polymorphism (SNP) with the biggest contribution to the simulated trait var-iance. Because this SNP explains only 0.0229% of the simulated trait variance, model 1 tests whether we can detect a locus with a small effect size if it is modeled perfectly. Model 2 is a QTL that is the weighted average for all functional SNPs within the gene bearing the “biggest”SNP. The result is a common allele with small effect sizes and is an attempt to model the cumulative effects of several functional variants within a single gene. Model 3 is a perfectly penetrant additive locus, where affectation status indicates the subject carries the risk allele at the biggest SNP, and tests whether we could detect the SNP locus if it perfectly explained the trait variance. We compare results from the same IBD graphs with a typical variance components (VCs) lod score, as implemented by SOLAR [10].
Association testing
We used VC analyses to investigate association with the trait of candidate covariate SNPs while accounting for correlations among related subjects. We analyzed family 10 alone, as well as all 7 families jointly. Each of the top 5 SNPs, ranked byp-value, identified from a half gen-ome scan [8], was tested for association with a linear mixed model using dose of the minor allele as the fixed effect and the kinship matrix and a polygenic model as a random effect. Whereas SOLAR [10] uses the pedi-gree-based kinship matrix to account for relatedness, EMMAX [8] estimates the kinship matrix from the genome-wide genotype correlations. These two programs fit the same model, differing only in the source of the kinship matrix.
We also performed VC analyses with SOLAR with various combinations of imputed and observed genotype data within family 10 to evaluate the usefulness of imputed genotype data. For these analyses, we used the weighted average of genotype probabilities obtained from GIGI to provide an expected dose of the minor allele, given the observed data.
Results
Imputation
Both GIGI and BEAGLE (F10 + FO) achieved similarly high overall call rate (96.1% and 91.8%, respectively) and accuracy (99.8% and 99.1%, respectively) on the masked subjects in design 1. As demonstrated elsewhere [1,17], accuracy was high regardless of MAF. Accuracy for rare variants (MAF <0.05) was greater than 99.9% for GIGI and 99.4% for BEAGLE, and accuracy at the most com-mon variants (MAF ≥0.45) was greater than 99.9% for GIGI and 98.9% for BEAGLE. GIGI also could impute alleles for subjects with completely missing genotype data at a call rate of 82.9%. As shown in Figure 2 for design 1 data, (a) GIGI calls more rare alleles than does BEAGLE, (b) performance differences between GIGI and BEAGLE shrank with increasing numbers of observed rare alleles within the pedigree (c) use ofonly an outside reference sample for BEAGLE was ineffective for imputation of rare alleles that may be family specific, Table 1 Design of imputation experiments
Subjects with observed marker data1 GIGI BEAGLE
Family Subject status Design 1 Design 2 F10 + FO F10 FO
Number of subjects Number of variants observed per subject
Family 10 Typed 44 15 65,403 65,403 65,403 0
Masked 20 49 3512 36213 36213 36213
Others Typed 308 308 0 65,403 0 65,403
1
Original genome-wide association studies genotypes are observed or masked for the imputation markers as per subject status.
2
Framework markers on chromosome 3 used to sample identity-by-descent (IBD) graphs.
3
and (d) BEAGLE was able to call a small fraction (<20%) of rare alleles that were not observed in the genotyped subjects in family 10, but only when BEAGLE had access to reference samples from other families.
Not surprisingly, both GIGI and BEAGLE called fewer genotypes starting with the design 2 data than the more complete design 1 (call rates of 77.1% and 85.3%, respectively), with high accuracy (98.1% and 97.8%, respectively). Accuracy for rare variants was 99.5% for GIGI and 99.0% for BEAGLE, and accuracy at the most common variants was 99.9% for GIGI and 97.1% for BEAGLE. Combining GIGI and BEAGLE boosted both call rate (89.5%) and accuracy (98.6%) over the use of
either alone, but only for more common variants. GIGI + BEAGLE continued to have high accuracy across MAF, with an accuracy of 99.3% for rare alleles and 98.6% for the most common alleles. Figure 3A shows little gain in call rate for the combined approach over the use of GIGI alone when imputing variants with rare alleles. In contrast, Figure 3B shows a markedly improved call rate resulting from the combined approach for SNPs with higher MAF.
Linkage analysis
Although enough copies of the risk allele segregate within the family to generate a linkage signal if the risk allele was indeed causal (model 3, lodmax = 5.36), this
locus does not explain enough phenotypic variation within this family to provide measurable evidence of linkage (lodmax<0.5 for models 1 and 2). VC lod score
analyses [10] provided comparable results: no evidence of linkage in family 10 and an all-families’ lod score near 0.2.
Family-based association testing
Significant associations were readily detectable in both the total sample and in individual families regardless of the absence of strong positive linkage evidence (Table 2). Broadly speaking, the association tests carried out with SOLAR and EMMAX were similar to each other, with SOLAR providing somewhat stronger evidence of associa-tion. The differences between the two programs are larger for the most significant results, with the most extreme difference obtained at the causal SNP rs11711953 in family 10.
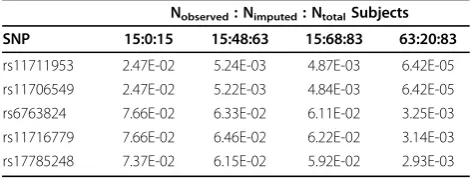
As expected, Table 3 shows that the strength of asso-ciation dropped when we only used genotypes for 15 subjects providing dense marker data for imputation and strengthened when we imputed genotypes into Figure 2Call rates of minor alleles for design 1 data with
different imputation approaches for single-nucleotide polymorphisms with rare minor allele frequency. Pink circles: GIGI; blue triangles: BEAGLE F10 + FO; purple crosses: BEAGLE F10; green diamonds: BEAGLE FO.
Figure 3Call rate of minor alleles for design 2 data, for single-nucleotide polymorphisms with rare (A) and common (B) minor allele frequency. Pink circles: GIGI; blue triangles: BEAGLE F10 + FO; black squares: GIGI + BEAGLE. X-axis fixed to the maximum for rare, for
other subjects with trait data. In this data set, there was just a slight gain in the p-value obtained by imputing genotypes into the 20 unsampled subjects, explained by one subject who had a trait value but no observed geno-type data for the 10 tested SNPs.
Conclusions
IBD graphs provided ample opportunity to investigate relationships between individuals and between genotypes and phenotypes. Pedigree-based imputation that exploited these graphs outperformed population-based imputation for rare variants, even when the latter included family members of the subjects being imputed. We also showed that the two approaches may be com-bined to improve call rate and accuracy for some uses. Both parametric and VC linkage analysis failed to detect a linkage signal. Further examination revealed no cose-gregation of phenotypes and genotypes at the functional variants on chromosome 3 in these families in SIM-PHEN.1.csv (John Blangero, personal communication), although this was not true of the other simulated repli-cates. In contrast, family-based association testing with a mixed model was still able to detect association with the functional variants. We found that using the known pedigree structure in SOLAR provided similar but slightly stronger evidence for association than EMMAX, which treats subjects as unrelated but accounts for relat-edness through an empirical covariance matrix. Finally, use of observed genotype data provides a stronger asso-ciation signal than imputed data, although the difference
between the two sets ofp-values can be negligible. This suggests that when direct genotyping is not possible, pedigree-based imputation provides a practical and use-ful alternative.
Competing interests
The authors declare that they have no competing interests.
Authors’contributions
All authors participated in study design and analysis. EMB and EMW drafted the manuscript, and all authors edited and approved the final manuscript.
Acknowledgements
This research was supported by the National Institutes of Health (NIH) grants AG040184, AG005136, AG039700, CA148958, GM046255, GM075091, HD054562, MH092367, and MH094293. The GAW18 whole genome sequencing data were provided by the Type 2 Diabetes Genetic Exploration by Next-generation sequencing in Ethnic Samples (T2D-GENES) Consortium, which is supported by NIH grants U01 DK085524, U01 DK085584, U01 DK085501, U01 DK085526, and U01 DK085545. The other genetic and phenotypic data for GAW18 were provided by the San Antonio Family Heart Study and San Antonio Family Diabetes/Gallbladder Study, which are supported by NIH grants P01 HL045222, R01 DK047482, and R01 DK053889. The GAW is supported by NIH grant R01 GM031575.
This article has been published as part ofBMC ProceedingsVolume 8 Supplement 1, 2014: Genetic Analysis Workshop 18. The full contents of the supplement are available online at http://www.biomedcentral.com/bmcproc/ supplements/8/S1. Publication charges for this supplement were funded by the Texas Biomedical Research Institute.
Authors’details 1
Division of Medical Genetics, Department of Medicine, University of Washington, Seattle, WA 98195, USA.2Department of Biostatistics, University of Washington, Seattle, WA 98195, USA.3Department of Statistics, University of Washington, Seattle, WA 98195, USA.
Published: 17 June 2014
References
1. Cheung CY, Thompson EA, Wijsman EM:GIGI:an approach to effective imputation of dense genotypes on large pedigrees.Am J Hum Genet
2013,92:504-516.
2. Marchani EE, Wijsman EM:Estimation and visualization of identity-by-descent within pedigrees simplifies interpretation of complex trait analysis.Hum Hered2011,72:289-297.
3. Rosenthal EA, Ronald J, Rothstein J, Rajagopalan R, Ranchalis J, Wolfbauer G, Albers JJ, Brunzell JD, Motulsky AG, Rieder MJ,et al:Linkage and association of phospholipid transfer protein activity to LASS4.J Lipid Res
2011,52:1837-1846.
4. Lander ES, Green PJ:Construction of multilocus genetic maps in humans.
Proc Natl Acad Sci USA1987,84:2363-2367.
5. Heath SC:Markov chain Monte Carlo segregation and linkage analysis for oligogenic models.Am J Hum Genet1997,61:748-760.
6. Manichaikul A, Mychaleckyj JC, Rich SS, Daly K, Sale M, Chen WM:Robust relationship inference in genome-wide association studies.Bioinformatics
2010,26:2867-2873.
7. Thornton T, Tang H, Hoffmann TJ, Ochs-Balcom HM, Caan BJ, Risch N: Estimating kinship in admixed populations.Am J Hum Genet2012, 91:122-138.
8. Thornton T, Conomos MP, Sverdlov S, Marchani EE, Cheung C, Glazner C, Lewis SM, Wijsman EM:Estimating and adjusting for ancestry admixture in statistical methods for relatedness inference, heritability estimation, and association testing.BMC Proc2014,8(suppl 2):S5.
9. Browning BL, Browning SR:A unified approach to genotype imputation and haplotype-phase inference for large data sets of trios and unrelated individuals.Am J Hum Genet2009,84:210-223.
10. Almasy L, Blangero J:Multipoint quantitative-trait linkage analysis in general pedigrees.Am J Hum Genet1998,62:1198-1211.
Table 2 Association testp-values from use of all available genotype data
SNP Family 10 Seven families SOLAR EMMAX SOLAR EMMAX
rs11711953 7.31E-05 1.25E-03 1.57E-07 3.91E-07 rs11706549 7.31E-05 1.25E-03 1.57E-07 3.91E-07 rs6763824 2.47E-03 7.71E-03 8.93E-03 8.84E-03 rs11716779 3.78E-03 1.62E-02 2.56E-04 2.87E-04 rs17785248 3.15E-03 1.29E-02 5.51E-04 5.52E-04
SNP, single-nucleotide polymorphism.
Table 3 Association testp-values from use of imputed genotype data within family 10
Nobserved: Nimputed: NtotalSubjects
SNP 15:0:15 15:48:63 15:68:83 63:20:83
rs11711953 2.47E-02 5.24E-03 4.87E-03 6.42E-05 rs11706549 2.47E-02 5.22E-03 4.84E-03 6.42E-05 rs6763824 7.66E-02 6.33E-02 6.11E-02 3.25E-03 rs11716779 7.66E-02 6.46E-02 6.22E-02 3.14E-03 rs17785248 7.37E-02 6.15E-02 5.92E-02 2.93E-03
11. Wijsman EM, Rothstein JH, Thompson EA:Multipoint linkage analysis with many multiallelic or dense diallelic markers: MCMC provides practical approaches for genome scans on general pedigrees.Am J Hum Genet
2006,79:846-858.
12. Tong LP, Thompson E:Multilocus lod scores in large pedigrees: combination of exact and approximate calculations.Hum Hered2008, 65:142-153.
13. Thompson EA:The structure of genetic linkage data: from LIPED to 1M SNPs.Hum Hered2011,71:86-96.
14. Koepke H, Thompson EA:Efficient testing operations on dynamic graph structures using strong hash functions.Department of Statistics, technical reportsSeattle: University of Washington; 2010.
15. Lathrop GM, Lalouel JM, Julier C, Ott J:Strategies for multilocus linkage analysis in humans.Proc Natl Acad Sci USA1984,81:3443-3446. 16. Sobel E, Lange K:Descent graphs in pedigree analysis: applications to
haplotyping, location scores, and marker-sharing statistics.Am J Hum Genet1996,58:1323-1337.
17. Cheung CYK, Wijsman E:Imputing genotypes in large pedigrees: a comparison between GIGI and BEAGLE.American Society of Human GeneticsSan Francisco; 2012, vol. (abstract).
doi:10.1186/1753-6561-8-S1-S19
Cite this article as:Blueet al.:Identity-by-descent graphs offer a flexible framework for imputation and both linkage and association analyses.
BMC Proceedings20148(Suppl 1):S19.
Submit your next manuscript to BioMed Central and take full advantage of:
• Convenient online submission
• Thorough peer review
• No space constraints or color figure charges
• Immediate publication on acceptance
• Inclusion in PubMed, CAS, Scopus and Google Scholar
• Research which is freely available for redistribution