Optimization of Extrusion Process Parameters for Red
Lentil-carrot Pomace Incorporated Ready-to-eat
Expanded Product Using Response Surface
Md. Shafiq Alam
*, Sunil Kumar
Department of Processing and Food Engineering, Punjab Agricultural University, India
Copyright © 2014 Horizon Research Publishing All rights reserved.
Abstract
For optimization of extrusion process for development of red lentil-carrot pomace incorporated ready- to-eat rice based expanded product, experiments were planned in Box-Behnken design using response surface methodology. The independent process variables for extrusion were feed moisture content (14-20%), die temperature (120-180°C), screw speed (300-500 rpm) and formulation (rice flour: pulse flour; 60-80%: 10-30%) with constant proportion of carrot pomace powder (10%). Second order polynomials were used to model the extruder responses, functional and physical properties as a function of extrusion process variables. The extrusion process was optimized for maximum expansion ratio, water absorption index, overall acceptability and minimum bulk density, water solubility index, specific mechanical energy and hardness with in experimental range. The optimum extrusion process conditions obtained were 80:10:10 (rice flour: pulse flour: carrot pomace powder), 14% feed moisture content, 394 rpm screw speed and 120°C die temperature. An analysis of variance (ANOVA) revealed that among the process variables, feed moisture content followed by screw speed had the most significant effect on all the responses; screw speed had the significantly higher effect on specific mechanical energy. The proportion of red lentil and carrot pomace in rice based expanded product was observed to have significantly lower effect on the selected responses.Keywords Extrusion Technology, Ready-to-eat Snacks,
Optimization, Carrot Pomace1. Introduction
Fruit and vegetable wastes are inexpensive, available in large quantities, characterized by a high dietary fibre content resulting with high water binding capacity and relatively low enzyme digestible organic matter (Serena and Knudsen, [33]). A number of researchers have used fruits and vegetable by-products such as apple, pear, orange, peach,
blackcurrant, cherry, artichoke, asparagus, onion, carrot pomace (Nawirska and Kwasnievska, [31]; Grigelmo-Miguel and Martin-Belloso, [20]; Ng et al., [32]) as sources of dietary fibre supplements in refined food.
The total production of carrot and turnips in the world during the year 2011 was estimated as 35.658 million tons (FAO, [19]). The carrot (Daucus carota) is a root vegetable, usually orange, purple, red, white or yellow in color, with a crisp texture when fresh. It is a rich source of-carotene and contains other vitamins, like thiamine, riboflavin, vitamin B-complex and minerals (Walde et al., [37]). Carrot pomace is a byproduct obtained during carrot juice processing. The juice yield in carrots is only 60-70%, and even up to 80% of carotene may be lost with left over carrot pomace (Bohm et al., [10]). The carrot pomace has good residual amount of all the vitamins, minerals and dietary fibre. So far the left over pomace, received after juice extraction of carrots, does not find proper utilization. Moreover, vegetable pomace has become a source of environmental problem. The pomace is quite perishable as it contains about 88 ± 2% of moisture. However, dried carrot pomace has carotene and ascorbic acid in the range of 9.87 to 11.57 mg and 13.53 to 22.95 mg per 100 g, respectively (Upadhyay , [35]). Due to the high dietary fibre content, carrot pomace can be used to develop products that could supplement fibre in the diet of people. A promising way to store the carrot pomace is in dried form and utilize it in the development of bakery products specifically extrudates, which are becoming more popular than other bakery products in ready to eat food category.
Food Science and Technology 2(7):106-119, 2014 107
The broken rice is a byproduct of modern rice milling process. The rice portion can have varying percentages (5-7%) of broken kernels which contain nutritive value similar to whole rice and are available readily at relatively lower cost. Rice contains approximately 7.3% protein, 2.2% fat, 64.3% available carbohydrate, 0.8% fiber and 1.4% ash content (Zhoul et al., [39]). Rice flour has become an attractive ingredient in the extrusion industry due to its bland taste, attractive white color, hypo-allergenicity and ease of digestion (Kadan et al., [25]).
The extruded products which are high in fiber content could be improved in its overall nutritional content and taste by incorporation of protein rich ingredients. Among other materials, incorporation of legume flour has positive impact on levels of proteins and dietary fiber of extruded snacks (Berrios, [8]). The pulses in the extruded product can pave the way for a snack which is rich in both fiber and protein contents. The lentil (also known as red dhal, massar, masuri, till seed and split pea) is an important legume crop in developing countries, grown annually in semi-arid regions of the world and exclusively used in human food and is mainly produced in Asia and the Middle East. Lentils contain dietary fiber, folate, vitamin B1, calcium, phosphorus and potassium, along with oleic, linoleic and palmitic acid (Adsule, [2]). The nutritional characteristics of lentil have been associated with cholesterol and lipid lowering effects in humans, along with reducing the incidence of colon cancer and type-2 diabetes (Agriculture and Agri-Food Canada, [3]).
Extruded products based on wheat flour, rice flour, maize grits, barley flour and their combinations have been widely developed by the extrusion industry but the incorporation of by-products (waste) from different fruit and vegetable processing industries has opened a new hope for their utilization as well as development of nutritionally sound extruded products. Altan et al., [5] processed the blends of barley flour and tomato pomace; barley flour and grape pomace and corn flour and tomato pomace in a co-rotating twin-screw extruder. Some work on change in physical and functional properties of extrudates with change in extrusion process variables have been reported (Ali et al., [1]; Carvalho and Mitchell, [11]; Ding et al., [15]; Yagci and Gogus, [38]; Altan et al., [5]). Such studies are lacking for carrot pomace and red lentil incorporated extruded product. Thus, the present investigation was undertaken with the objectives to study the effect of extrusion process parameters on quality of red lentil-carrot pomace incorporated ready-to-eat expanded product and to model and optimize the extrusion process for the developed extrudates using response surface methodology.
2. Materials and Methods
2.1. Experimental Design
A four factor three level Box-Behnken experimental
design of Response surface methodology (RSM) was used for the study (Ding et al., [16]; Montgomery, [29]; Altan et al., [5]; Yagci and Gogus, [38]). The parameters and their levels were chosen based on the literature available on rice based extrudates (Ding et al., [16]; Upadhyay, [35]; Yagci and Gogus, [38]; Ibanoglu et al., [22]). For development of ready-to-eat snack, the ingredients used were: Rice flour; pulse flour (Red lentil), carrot pomace flour and salt. The independent variables were the proportion of pulse flour in rice flour (10-30%), feed moisture content (14-20%), screw speed (300-500 rpm) and die temperature (120-180°C). Response variables were expansion ratio, bulk density, water absorption index, water solubility index, specific mechanical energy, hardness and overall acceptability.
2.2. Sample Preparation
For development of red lentil-carrot pomace based ready-to-eat snack, the ingredients were: Rice flour; pulse flour (Red lentil), carrot pomace flour and salt. The carrot pomace left after juice extraction was pretreated with 1% w/v citric acid prior to drying. The pretreated pomace was dried at 65°C in a tray dryer upto desired moisture content of 6.0% d.b. The dried pomace was grinded to flour using grinder (Make: Sujata 750 W). The pomace flour was stored in sealed laminated aluminum films for further use.
The rice and pulse samples were procured from local market in Ludhiana, Punjab, and were grinded to form flour. The raw samples obtained for each extrusion experiment were prepared as per the experimental combinations (Table 1). In order to enhance the nutritional quality and taste, 10% carrot pomace flour and 2 % salt was added to each experimental sample. The moisture was adjusted by sprinkling distilled water in dry ingredients. After mixing, samples were packed in polyethylene bags at room temperature for 24 h (Stojceska et al., [34]). The moisture content of all the samples were determined by halogen moisture analyzer prior to extrusion experiments.
2.3. Extrudates Preparation
face cutter with four bladed knives was used to cut the extrudates. The twin screw extruder was kept to stabilize the set temperatures and samples were then poured into feed hopper and the feed rate was adjusted according to study. The product was collected at the die end and kept at 60 ± 0.5°C in hot air oven for 1 h duration to remove extra moisture from the product. The samples were packed in polythene bags for further analysis.
2.4. Product Quality Responses
2.4.1. Bulk Density of Extrudates
Bulk density (BD, g/cm3) of extrudates was determined by using average diameter and an average length of 25 extrudate samples and calculated using following expression (Stojceska et al., [34])
BD= 4m / πd2 L
[image:3.595.53.555.228.729.2]Where, m is mass in g; L is length in cm and d is diameter in cm of extrudates.
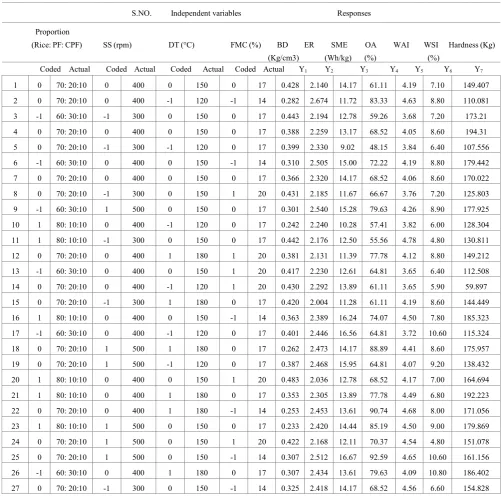
Table 1. Experimental data of extruded product for response surface analysis
S.NO. Independent variables Responses
Proportion
(Rice: PF: CPF) SS (rpm) DT (°C) FMC (%) BD ER SME OA WAI WSI Hardness (Kg) (Kg/cm3) (Wh/kg) (%) (%)
Coded Actual Coded Actual Coded Actual Coded Actual Y1 Y2 Y3 Y4 Y5 Y6 Y7
Food Science and Technology 2(7):106-119, 2014 109
2.4.2. Water Absorption Index (WAI) and Water Solubility Index (WSI) of Extrudates
Water Absorption Index (WAI) was determined according to the method suggested by Kaur & Singh, [26]. A 2.0 g ± 0.005 g sample was placed in a tare centrifuge tube and 20 ml distilled water added. After keeping for 15 min (with intermittent shaking every 5 min), the sample was centrifuged at 4000 rpm for 15 min. The supernatant was decanted into a tare aluminum pan and weight gain in the gel was noted. Water absorption index (WAI) was calculated as the increase in weight of sediment obtained after decanting the supernatant as:
WAI= Weight of wet sediment (g) / Weight of dried sediment (g)
The supernatant was evaporated to dryness at 105°C until constant weight. Water solubility index (WSI) was determined as (Anderson, et al. [7])
WSI (%) = Weight of dried supernatant (g) × 100 / Weight of dried sample (g)
2.4.3. Specific Mechanical Energy
Specific mechanical energy, the mechanical energy input per unit mass of the extrudate, was calculated by dividing the net power input to the screw by the extrudate flow rate. SME input was calculated by the following equation.
SME (Wh/kg) = (Screw speed × torque) / mass flow rate Torque was recorded every 6 s for at least 12 min and SME was calculated and averaged for each processing condition.
2.4.4. Expansion Ratio
The ratio of diameter of extrudate and the diameter of die was used to express the expansion of extrudate (Fan et al., [18]). The diameter of extrudate was determined as the mean of 10 random measurements made with a Vernier caliper. The extrudate expansion ratio was calculated using the expression as given below
Expansion Ratio = Extrudate Diameter / Die Diameter 2.4.5. Hardness
Mechanical properties of the extrudates were determined by crushing method using a TA-XT2i (Stable Micro-Systems, Surrey, England) with a compression plate p75. The tests were conducted at pre–test speed of 1.0 mm/sec, test speed of 5 mm/sec, post-test speed of 5 mm/s, strain- 25%, and trigger force of 0.4903 N and load cell of 50kg.
An extrudate was compressed with a probe SMS-P/75-75 mm diameter at a crosshead speed 5 mm/s to 3 mm of 90% of diameter of the extrudate. The compression generated a curve with the force over distance. The highest first peak value was recorded as this value indicated the first rupture of
snack at one point and this value of force was taken as a measurement for hardness (Stojceska et al., [34]).
2.4.6. Sensory Evaluation
Sensory quality of extrudates sample was determined with the help of 10 semi trained consumer panelist using a 9-point Hedonic scale (9-liked extremely to 1-disliked extremely) method described by Amerine et al., [6]. The aspects considered were color, appearance, taste, flavor and overall acceptability (OA). OA was evaluated as an average of color, appearance, taste and flavor. The average scores of all the 10 panelists were computed for different characteristics.
2.5. Optimization of Process Parameters
Response surface methodology was applied to the experimental data using a commercial statistical package, Design-Expert version 8.0.7.1 (Statease Inc, Minneapolis, USA, Trial version). The same software was used for the generation of response surface plots, superimposition of contour plots and optimization of process variables. The response surface and contour plots were generated for different interaction for any two independent variables, while holding the value of other two variables as constant (at the central value). Such three-dimensional surfaces could give accurate geometrical representation and provide useful information about the behavior of the system within the experimental design (Cox et al., [14]). The optimization of the extrusion process aimed at finding the levels of independent variables viz. Moisture content, Screw speed, Die temperature, and rice flour, which could give maximum expansion ratio, water absorption index and overall acceptability; and minimum bulk density, water solubility index, specific mechanical energy and in range hardness. Desirability, a mathematical method was used for selecting the optimum process values. For several responses and factors, all goals get combined into one desirability function. The numerical optimization finds a point that maximizes the desirability function.
3. Results and Discussion
The value of various responses at different experimental combinations for coded variables is given in Table 1. A wide variation in all the responses was observed for different experimental combinations i.e. 0.233 to 0.483kg/cm3 for BD,
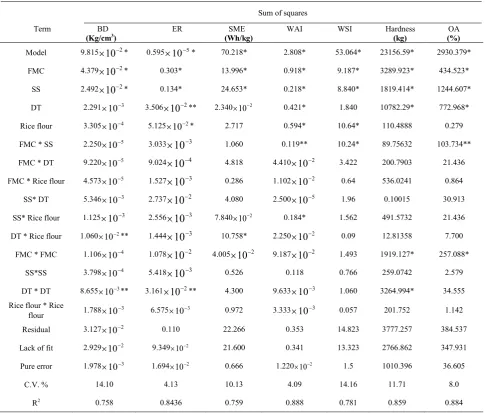
Table 2. Analysis of variance of linear, quadratic and interactive terms of extrusion process variables on responses
Sum of squares
Term BD ER SME WAI WSI Hardness OA
(Kg/cm3) (Wh/kg) (kg) (%)
Model 9.815
×
10
−2* 0.595×10−5* 70.218* 2.808* 53.064* 23156.59* 2930.379*FMC 4.379
×
10
−2* 0.303* 13.996* 0.918* 9.187* 3289.923* 434.523*SS 2.492
×
10
−2* 0.134* 24.653* 0.218* 8.840* 1819.414* 1244.607*DT 2.291×10⁻³ 3.506
×
10
−2** 2.340×10⁻² 0.421* 1.840 10782.29* 772.968*Rice flour 3.305×10⁻⁴ 5.125×10−2* 2.717 0.594* 10.64* 110.4888 0.279 FMC * SS 2.250×10⁻⁵ 3.033
×
10
−3 1.060 0.119** 10.24* 89.75632 103.734**FMC * DT 9.220×10⁻⁵ 9.024
×
10
−4 4.818 4.410×10⁻² 3.422 200.7903 21.436 FMC * Rice flour 4.573×10⁻⁵ 1.527×
10
−3 0.286 1.102×10⁻² 0.64 536.0241 0.864SS* DT 5.346×10⁻³ 2.737
×
10
−2 4.080 2.500×10⁻⁵ 1.96 0.10015 30.913 SS* Rice flour 1.125×10⁻³ 2.556×
10
−3 7.840×10⁻² 0.184* 1.562 491.5732 21.436DT * Rice flour 1.060×10⁻²** 1.444
×
10
−3 10.758* 2.250×10−2 0.09 12.81358 7.700FMC * FMC 1.106×10⁻⁴ 1.078
×
10
−2 4.005×
10
−2 9.187×
10
−2 1.493 1919.127* 257.088*SS*SS 3.798×10⁻⁴ 5.418
×
10
−3 0.526 0.118 0.766 259.0742 2.579DT * DT 8.655×10⁻³** 3.161
×
10
−2** 4.300 9.633×10⁻³ 1.060 3264.994* 34.555 Rice flour * Riceflour 1.788×10⁻³ 6.575×10⁻³ 0.972 3.333×10⁻³ 0.057 201.752 1.142 Residual 3.127×10⁻² 0.110 22.266 0.353 14.823 3777.257 384.537 Lack of fit 2.929×10⁻² 9.349×10⁻² 21.600 0.341 13.323 2766.862 347.931
Pure error 1.978×10⁻³ 1.694×10⁻² 0.666 1.220×10⁻² 1.5 1010.396 36.605
C.V. % 14.10 4.13 10.13 4.09 14.16 11.71 8.0
R2 0.758 0.8436 0.759 0.888 0.781 0.859 0.884
*significant:(p≤0.05),**significant(p≤0.1)
The data was analyzed using multiple regression technique. A linear model and a second order model with and without interaction terms for each responses were tested for their adequacies and R2 values were calculated. A second
order polynomial equation was fitted to the data for all the responses and the results are given in Table 2.
Yk= βo +
∑
=n
i1
βi
x
i +∑
=
n
i1
βii
x
i2 +∑
−
=
1
1 n
i
∑
=+n
i j 1
βij
x
ix
jWhere, âi , âii , âij are constant coefficient and
x
ix
j are coded independent variables.All models were tested for their adequacy using ANOVA technique. F-values for the lack of fit were found non-significant (p≤0.05) for each responses thereby
confirming the validity of the models. Analysis of experimental values for responses revealed that BD, ER, SME, WAI, WSI, hardness, and OA witnessed 0.758, 0.843,
0.759, 0.888, 0.781, 0.859, and 0.884 coefficient of regression, respectively. Table 2 shows that the linear, quadratic as well as interaction model term significantly
(p≤0.05) affected all the responses.
The results revealed the higher influence of FMC, SS and DT in comparison to Rice flour proportion, irrespective of the responses.
Food Science and Technology 2(7):106-119, 2014 111
Table 3. Regression coefficients (un-coded variables) of selected quadratic model and their significance
Term Coefficient Regression (kg/cmBD 3) ER (Wh/kg) SME WAI WSI (%) Hardness (kg) OA (%)
Constant β0 0.393 2.239 13.836 4.1 8.1 171.246 66.05
FMC β1 6.041×10⁻² -0.159 -1.08 -0.276 -0.875 -16.557 -6.017
SS β2 -4.557
×
10
−2 0.106 1.433 0.135 0.858 12.313 10.184DT β3 -1.381
×
10
−2 -5.406×
10
−2 4.416×10⁻² 0.1875 0.391 29.975 8.025Rice flour β4 -5.248
×
10
−3 -6.535×10⁻² -0.475 0.2225 -0.941 3.034 -0.152FMC * SS β12 2.372×10⁻³ -2.754×10⁻² -0.515 0.1725 -1.6 4.736 -5.092
FMC * DT β13 -4.801
×
10
−3 1.502×
10
−2 -1.0975 0.105 0.925 7.085 2.315FMC * Rice flour β14 3.381
×
10
−3 -1.954×
10
−2 -0.2675 5.25×
10
−2 0.4 11.576 0.465SS * DT β23 -3.655
×
10
−2 8.272×10⁻² -1.01 -2.500×10⁻³ -0.7 0.158 2.78SS * Rice flour β24 -1.677
×
10
−2 -2.528×
10
−2 -0.14 -0.215 0.625 11.085 2.315DT * Rice flour β34 5.150×10⁻² 1.9
×
10
−2 1.64 7.500×10⁻² 0.15 -1.789 1.3875FMC * FMC β11 -4.554×10⁻³ 4.497×10⁻² -8.666
×
10
−2 0.131 -0.529 -18.969 6.942SS * SS β22 -8.439
×
10
−3 3.187×
10
−2 -0.314 0.1487 -0.379 -6.969 0.695DT * DT β33 -4.028
×
10
−2 7.699×10⁻² -0.897 -4.25×
10
−2 0.445 -24.742 2.545 Rice flour * Riceflour β44 -1.831
×
10
−2 3.511×10⁻² 0.427 -2.500×
10
−2 -0.104 6.150 0.462120.00 126.00 132.00 138.00 144.00 150.00 156.00 162.00 168.00 174.00 180.00
300.00 350.00
400.00 450.00
500.00 0.2
0.25 0.3 0.35 0.4 0.45
B
ulk
D
ens
ity
(k
g/
cm
3)
B: Screw speed(rpm)
120.00 126.00 132.00 138.00 144.00 150.00 156.00 162.00 168.00 174.00 180.00
300.00 350.00
400.00 450.00
500.00 2
2.1 2.2 2.3 2.4 2.5
E
xpans
ion R
ati
o
B: Screw speed(rpm) C: Die temperature(°C)
120.00 126.00 132.00 138.00 144.00 150.00 156.00 162.00 168.00 174.00 180.00
300.00 350.00
400.00 450.00
500.00 9
10 11 12 13 14 15 16
S
M
E(W
h/
kg
)
B: Screw speed(rpm) C: Die temperature(°C)
120.00 126.00 132.00 138.00 144.00 150.00 156.00 162.00 168.00 174.00 180.00
300.00 350.00
400.00 450.00
500.00 3.8
4 4.2 4.4 4.6
W
AI
Food Science and Technology 2(7):106-119, 2014 113
Figure 1. Effect of screw speed and die temperature on bulk density, expansion ratio, specific mechanical energy, water absorption index, water solubility index and hardness.
Figure 2. Effect of screw speed and die temperature on overall acceptability.
120.00 126.00 132.00 138.00 144.00 150.00 156.00 162.00 168.00 174.00 180.00
300.00 350.00
400.00 450.00
500.00 6
7 8 9 10
W
SI
B: Screw speed(rpm) C: Die temperature(°C)
120.00 126.00 132.00 138.00 144.00 150.00 156.00 162.00 168.00 174.00 180.00
300.00 350.00
400.00 450.00
500.00 80
100 120 140 160 180 200
H
ardnes
s(
kg)
B: Screw speed(rpm) C: Die temperature(°C)
120.00 126.00 132.00 138.00 144.00 150.00 156.00 162.00 168.00 174.00 180.00
300.00 350.00
400.00 450.00
500.00 40
50 60 70 80 90 100
O
ve
ral
l A
cc
ept
abi
lity
(%
)
[image:8.595.159.454.537.738.2]3.1. Effect of Extrusion Variables on Bulk Density The regression analysis revealed that the regression model
for bulk density was significant (P≤0.05). The coefficient of
regressionbeing high (R2=0.758) and ‘F-values’ for the lack
of fit being non-significant, thereby confirm the validity of the fitted model to the experimental data. Bulk density values for the extrudates were between 0.233 kg/cm3 and 0.483
kg/cm3 . The lowest BD value was obtained for the samples
developed at SS (500 rpm), rice flour (80%) and DT (150oC)
with 17% FMC whereas the highest BD value was obtained for the samples with maximum level of rice flour and FMC and 150oC DT at 400 rpm SS. Fig.1 shows the influence of
DT and SS on BD. The BD decreased with the increase of SS and increased with the increase in DT at a certain level and then decrease slightly. However, BD increased with the increase in FMC and rice flour proportion. At a given DT (150oC), the BD was 0.431 kg/cm3 at 300 rpm, 0.393 kg/cm3
at 400 rpm and 0.339 kg/cm3 at 500 rpm SS. At 400 rpm SS,
the BD first increased from 0.367 kg/cm3 at 120oC DT to
0.393 kg/cm3 at 150oC DT and then slightly decreased to
0.339 kg/cm3 at 180oC DT. The bulk density values
decreased when the extrusion temperature and screw speed increased probably due to starch gelatinization. According to Case et al., [12] and Mercier & Feillet [28], with advance in gelatinization, the volume of extruded product increases resulting in decrease in bulk density which is in agreement with our observations.
3.2. Effect of Extrusion Variables on Expansion Ratio
Table2 clearly shows significant (P≤0.05) regression
model for expansion ratio witnessing higher (R2=0.843)
coefficient of regressionand non-significant lack of fit based on ‘F-values’ confirming the validity of the model. Fig.1 clearly shows the influence of DT and SS on ER. The values of ER had positive correlation with screw speed. At a constant die temperature of 150°C the ER at 300,400 and 500 rpm screw speed were, 2.165, 2.239 and 2.377 respectively. While miner decreasing trend was observed with increasing die temperature at constant 400 rpm screw speed, the ER ranges from 2.370 at 120°C to 2.262 at 180°C (Fig.1). Similar trends were also noticed by others (Ilo et al., [23]; Dogan & Karwe, [17]) suggesting the existence of temperature plateau for expansion, between 150°C and 170°C, depending on the type of food material. This phenomenon may be caused by excessive structure breakdown and starch degradation under high temperature, which weakened the extrudate structure resulting to its collapse. The linear as well as quadratic term of DT showed significant effect on ER and the values of ER were decreased with decrease FMC and Rice flour (Table 2).
3.3. Effect of Extrusion Variables on Specific Mechanical Energy
The regression model for SME was found to be significant
(P≤0.05). The coefficient of regressionwas moderately high (R2=0.759) and ‘F-values’ for the lack of fit were
non-significant showing the adequacy of model to the experimental data. The SME of extrudates varied in the range of 9.02 Wh/kg to 16.67 Wh/kg with an average value of 13.449 Wh/kg. The maximum SME (16.67 Wh/kg) was found at 300 rpm SS, 120°C DT, 70 % rice flour with 17 % FMC while minimum SME (9.02 Wh/kg) was found at maximum 500 rpm SS, 120°C DT, 70 % rice flour with minimum FMC (14%). Fig.1 shows the effect of SS and DT on SME. SME increased with increase SS but decreased with increase FMC and rice flour composition and SME first increased and then slightly decrease with increase DT. At a constant 120°C DT, the SME were 10.137 Wh/kg at 300 rpm, 12.901 Wh/kg at 400 rpm and 15.023 Wh/kg at 500 rpm SS. At a given SS (400 rpm), the SME increased from 12.901Wh/kg at 120°C DT to 13.836 Wh/kg at 150°C DT and then slightly decreased to 12.988 Wh/kg at 180°C DT. Similar result was found by (Meng et al., [27]), that SME increased proportional to the screw speed, although a decrease in SME was also expected because melt viscosity would decrease with increase in SS. This result indicated that the effect of SS dominated the effect of melt viscosity thus witnessing decrease in SME (Jin et al., [24]; Akdogan, [4]; Bhattacharya, [9]).
3.4. Effect of Extrusion Variables on Water Absorption Index
Table 2 shows the significance of regression model for WAI at p<0.05 witnessing 0.888 coefficient of regression (R2) and non-significant ‘Lack of fit’, indicating that the
experimental values were in good agreement with the predicted values. The WAI of extrudates varied in the range of 3.65 and 4.78 with an average value of 4.19 .WAI of the product increased with the increase in rice flour proportion whereas decreased with increase in FMC. Fig.1 shows the effect of SS and DT on WAI. The WAI slightly decreased with increase in SS at a certain level and then increased, while increasing trend was found with the increase in DT. At a given DT (120°C), the WAI slightly decreased from 3.88 at 300 rpm SS to 3.87 at 400 rpm SS and then increased to 4.16 at 500 rpm SS. At a constant SS (400 rpm), the WAI increased from 3.87 at 120°C DT to 4.245 at 180°C DT. Increasing trend may be due to the more heat generation and reduced particle size of rice flour which favors the starch gelatinization. Similar results have been reported by Valentina et al. [36]).
3.5. Effect of Extrusion Variables on Water Solubility Index
The results revealed that the regression model for WSI
was significant at (P≤0.05) witnessing moderately high
(R2=0.781) coefficient of regression and non-significant
Food Science and Technology 2(7):106-119, 2014 115
WAI (10.8) was found at 400 rpm SS, 17% FMC, 60% rice flour and 180°C DT, while minimum (3.65) was at 500 rpm SS, 20% FMC, 70% rice flour and 150°C DT. Fig.1 shows that WSI increased with increase SS and DT but decreased with increase FMC and rice flour. At a given DT (150°C), the WSI were 6.867 at 300 rpm SS, 8.1 at 400 rpm SS and 8.573 at 500 rpm SS. At a constant SS (400 rpm), the WAI increased from 8.1 at 150°C DT to 8.937 at 180°C DT. Similarly reported by Stojceska et al., [34], WSI increased in apple with increase of barrel temperature and increased in carrot with increase screw speed. At a given rice flour (60%), the WAI decreased from 9.683 at 14% FMC to 7.133 at 20% FMC. At a constant FMC (17%), the WSI decreased from 8.935 at 60 % to 7.056 at 80% rice flour. Minimum WSI is favor property of ready- to-eat extrudates. Ilo et al., [23] reported that the degree of gelatinization of extruded maize grits decreased with increasing feed moisture, and increased with increasing feed rate and product temperature.
3.6. Effect of Variables on Hardness
The regression model for hardness was significant at p<0.05(table 2) recording coefficient of regression (R2) of
0.859. The hardness of extrudates varied in the range of 59.89 kg to 194.31 kg with an average value of 151.45. The die temperature significantly affected the hardness (p<0.05). The maximum hardness (194.31 kg) was noticed for the extrude developed at 400 rpm SS, 150°C DT, 70 % rice flour with 17 % FMC while minimum hardness (59.896kg) was observed for extrudate developed at 20% FMC, 400 rpm SS, 120°C DT and 70 % rice flour. The lower values of hardness which is favor property of extrudates. Fig.1 shows that with the increase in SS and DT, the hardness of the extrudate increases. At a given DT (120°C), hardness was 97.404 kg at 300 rpm, 116.876 kg at 400 rpm and 121.714 kg at 500 rpm of SS. At constant SS of 400 rpm, the hardness increased from 116.876 kg at 120°C to 176.57 kg at 180°C. Hardness slightly decreased first and then drastically increased with an increase in rice flour proportion and decreased with an increase in FMC. At a constant SS (400rpm) the hardness increased from 169.86kg at 14% FMC to 171.246 at 17% FMC and then decreased. Moreover, an increase in feed moisture content corresponds to an increase followed by decrease in hardness.
3.7. Effect of Variables on Overall Acceptability
Table 2 shows the regression model for OA was
significant (p≤0.05) with reasonably high coefficient of regression (R2=0.884) and non-significant lack of fit
showing agreement with the experimental data. The OA of extrudates varied in the range of 48.15 to 92.59% with an average value of 70.78%. The maximum value was recorded
for experimental condition of 14% FMC, 70% Rice flour, and 150°C DT with maximum SS (500 rpm).
Fig.2 shows that, the significant effect of SS and DT on OA (table2); showing increase in OA with the increase in both the parameters. At a given DT (120°C), the OA increase from 53.86% at 300 rpm to 68.669% at 500 rpm SS. At a constant SS (400 rpm), the OA were 60.576% at 120°C DT, 66.05% at 150°C DT and 76.63 at 180°C DT. Higher value of OA at a higher SS indicates the proper homogenization and gelatinization of dough at higher SS resulting in higher consumer acceptability. The shearing forces inside the extruder increases with the increase in mechanical and thermal energy (when screw speed and barrel temperature are increased) inputs, thus leading to lowering of product density due to enhancement of gelatinization (Guha [21]), that’s favor the better product acceptability. From table 2, the interaction term of FMC and SS and quadratic term of FMC had significantly higher effect on OA.
3.8. Optimization of Extrusion Process Parameters for Ready-to-eat Extruded Product
Graphical multi-response optimization technique was adopted to determine the workable optimum conditions for the development of extruded product using design expert software (Statease, DE 8.0.6.1). The contour plots for all the responses were superimposed and regions that best satisfied all the constraints were selected as optimum conditions. The main criteria for constraints optimization were maximum possible ER, WAI, sensory OA, and lower BD, SME, WAI, with hardness is in range. These constraints resulted in “feasible zone” of optimum conditions (shaded area in the superimposed contour plots). Superimposed contour plots having common superimposed area of all the responses for extrusion processes are presented in Fig.3 The optimum ranges of process parameters obtained for development of extrudates were: 14 to 17 % of FMC, 120 to 130°C DT, 353 to 417 rpm SS and 66 to 80 % of rice flour with 10% carrot pomace.
In order to optimize the process conditions for extrusion process by numerical optimization, which finds a point that maximizes the desirability function; equal importance of ‘3’ was given to all the 4 process parameters. However, based on their relative contribution to quality of final product, the importance given to different responses was 3 for SME, WAI, WSI, hardness and 5 for BD, ER and OA, respectively. The optimum operating conditions for SS, DT, FMC and Rice flour was 394 rpm, 120°C, 14% and 80%, respectively. Corresponding to these values of process variables, the value of BD obtained were 0.221 kg/cm3, ER 2.558, SME 11.215
14.00 15.00 16.00 17.00 18.00 19.00 20.00 300.00
350.00 400.00 450.00
500.00
Overlay Plot
A: Moisture content(%)
B:
S
cre
w s
pe
ed
(rp
m)
Bulk Density: 0.200
Expansion Ratio: 2.200
SME: 10.000
WSI: 4.800 Hardness: 100.000
Hardness: 100.000 Hardness: 123.876
Overall Acceptability(%) : 60.000
120.00 126.00 132.00 138.00 144.00 150.00 156.00 162.00 168.00 174.00 180.00
300.00 350.00 400.00 450.00
500.00
Overlay Plot
C: Die temperature(°C)
B:
S
cre
w s
pe
ed
(rp
m)
Bulk Density: 0.200
SME: 10.000
SME: 14.000
WAI: 4.780
WSI: 4.800 Hardness: 123.876
Food Science and Technology 2(7):106-119, 2014 117
[image:12.595.129.511.75.392.2]Figure 3. Overlaid contours of different responses for optimization of extrusion process parameters.
Table 4. Optimum values of process parameters and responses
Target Experimental Range Importance Optimum value Desirability
Min Max
Feed Moisture content (%) range 14.00 20.00 3 14.00 Screw speed (rpm) range 300.00 500.00 3 394.17 Die temperature (0C) range 120.00 180.00 3 120.07
Rice flour (%) range 60.00 80.00 3 80.00 Pulse flour (%) range 10.00 30.00 3 10.00 Carrot pomace flour (%) range 10.00 10.00 3 10.00
Responses Predicted values
Bulk Density(kg/cm3) minimize 0.23 0.48 5 0.22 0.728
Expansion Ratio maximize 2.00 2.67 5 2.55 SME(Wh/kg) minimize 9.02 16.67 3 11.21
WAI maximize 3.65 4.78 3 4.46 WSI (%) minimize 4.80 10.80 3 7.60 Hardness (kg) in range 59.90 194.31 3 119.66 Overall Acceptability (%) maximize 48.15 92.59 5 73.44
4. Conclusions
The response surface methodology was effective in optimizing extrusion process parameters for red lentil-carrot pomace incorporated ready-to-eat rice based expanded product with feed moisture in the range of 14 to 20%, die temperature 120-180°C, screw speed 300-500 rpm and
ingredient formulation (rice flour: pulse flour; 60-80%: 10-30%) with 10% carrot pomace flour. The regression equations obtained can be used for optimum conditions for desired responses within the range of conditions applied in this study. Graphical techniques, in connection with RSM, aided in locating optimum operating conditions, which were experimentally verified and proven to be adequately
60.00 65.00 70.00 75.00 80.00
300.00 350.00 400.00 450.00
500.00
Overlay Plot
D: Rice flour
B:
Sc
rew
sp
ee
d
Bulk Density: 0.230Expansion Ratio: 2.600
SME(Wh/kg): 10.000 SME(Wh/kg): 12.000
WAI: 4.600 WSI: 7.000
WSI: 8.000
Hardness: 110.000 Hardness: 125.000
Hardness: 125.000
[image:12.595.66.547.429.660.2]reproducible. Significant quadratic regression model were established with the coefficient of determination, R2 greater
than 0.758 for all responses. The optimum process parameters obtained for development of extrudates were 14% feed moisture, 394 rpm screw speed, 120°C die temperature and formulation of 80:10:10; rice flour: pulse flour: carrot pomace flour; for developing extruded product with maximum possible expansion ratio, water absorption index and overall acceptability and minimum water solubility index, bulk density and specific mechanical energy with hardness within the experimental range.
Nomenclature PF= Pulse Flour
CPF= Carrot Pomace Flour SS= Screw Speed
DT= Die Temperature FMC= Feed Moisture Content BD= Bulk Density
ER= Expansion Ratio
SME= Specific Mechanical Energy OA= Overall Acceptability WAI= Water Absorption Index WSI= Water Solubility Index
REFERENCES
[1] Y. Ali, M.A. Hanna, and R.Chinnaswamy. Expansion
characteristics of extruded corn grits. Lebensm-Wiss Technol, 29(8), 702-7, 1996.
[2] R.N. Adsule, In E. Nwoloko., J. Smartt (Eds.). Food and feed from legumes and oilseeds. Chapman & Hall Pub, 84–110, 1996.
[3] Agriculture & Agri-Food Canada, Lentils: Situation and outlook. Bi-weekly Bulletin, 19(7). Retrieved 21.08.08. 2006. [4] H. Akdogan. Pressure, torque, and energy responses of a
twin screw extruder at high moisture contents. Food Research International,29 (5–6), 423–429, 1996.
[5] A. Altan, K.L. McCarthy, M. Maskan. Evaluation of snack food from barley-tomato blends by extrusion processing, Journal of Food Engineering 84, 231-242, 2008.
[6] M.A. Amerine, R.M. Panngborn, E.B. Roessler. Principles of Sensory Evaluation of Food. 5. Academic Press, London, 1965.
[7] R.A. Anderson, H.F. Conway, V.F. Pfeifer, & E.L.Jr. Griffin. Gelatinization of corn grits by rolland extrusion cooking, Cereal Science Today 14 (1), 4–12, 1969.
[8] J.J. Berrios. Extrusion cooking of legumes: Dry bean flours, Encyclopedia of Agricultural, Food and Biological Engineering 1, 1-8, 2006.
[9] S. Bhattacharya. Twin-screw extrusion of rice-green gram
blend: Extrusion and extrudate characteristics, Journal of Food Engineering 32 (1), 83–99, 1997.
[10] V. Bohm, K. Otto, F.Weissleder. Yield of juice and carotenoids of the carrot juice production, In: Symposium Jena-Thuringen,Germany. 115-119, 1999
[11] C.W.P. Carvalho, J. R. Mitchell. Effect of sugar on the extrusion of maize grits and wheat flour. International Journal of Food Science and Technology, 35(6), 569–576, 2001. [12] S.E. Case, D.D. Hamann, S.J. Schwartz. Effect of starch
gelatinization on physical properties extruded wheat- and corn-based products, Cereal Chemistry, 69 (4), 401–404, 1992.
[13] M. Chandalia, A. Garg, D. Lutjohann, Von, K. Bergmann, S.M. Grundy, L.J. Brinkley. Beneficial effect of high dietary fiber intake in patients with type-2 diabetes New England Journal of Medicine, 342, 1392-1398, 2000.
[14] G.M. Cox, W.G. Cochran. Experimental designs. New York: John Wiley & Sons, Inc. Asd, 1964.
[15] Q.B. Ding, P. Ainsworth, A. Plunkett, G. Tucker, H. Marson. The effect of extrusion conditions on the functional and physical properties of wheat based expanded snacks. Journal of Food Engineering 73 (2), 142-148, 2006.
[16] Q.B. Ding, P. Ainsworth, G. Tucker, H. Marson. The effect of extrusion conditions on the physicochemical properties and sensory characteristics of rice based expanded snacks. Journal of Food Engineering, 66 (3), 283-289, 2005.
[17] D H. Dogan, M.V. Karwe. Physicochemical properties of quinoa extrudates. International Journal of Food Science and Technology, 9 (2), 101–114, 2003.
[18] J. Fan, J.R. Mitchell, and J.M.V. Blanshard. (A).The effect of sugar on the extrusion of maize grits. I. The role of the glass transition in determining product density and shape. International Journal of Food Science and Technology, 31(1), 55-65. 1996.
[19] FAO. Statistics, Food and Agriculture Organization, Rome 2010.
[20] N. Grigelmo-Miguel, O. Martin-Belloso. Comparison of dietary fibre from byproducts of processing fruits and greens and from cereals. Lebensm Wiss Technology Journal 32, 503-508, 1999.
[21] Guha, Manisha. Ph. D. Thesis on. “Processing and quality of rice-based extruded products”. Central food technological research institute, Mysore, India, 2000.
[22] S. Ibanoglu, P. Ainsworth, E.A. Ozer, A. Plunkett. Physical and sensory evaluation of a nutritionally balanced gluten-free extruded snack. Journal of Food Engineering, 75, 469-472, 2006.
[23] S. Ilo, U. Tomschik, E. Berghofer, N. Mundigler. The effect of extrusion operating conditions on the apparent viscosity and the properties of extrudates in twin-screw extrusion cooking of maize grits. Lebensmittel-Wissenschaft und- Technologie, 29(7), 593–598, 1996.
[24] Z. Jin, F. Hsieh, H.E. Huff. Extrusion of corn meal with soy fiber, salt, and sugar. Cereal Chemistry, 71 (3), 227–234, 1994.
Food Science and Technology 2(7):106-119, 2014 119
properties of extruded rice flours. Journal of Food Science, 68, 1669-1672, 2003.
[26] S. Kaur and C. Singh, Response surface optimization of conditions for the clarification of guava fruit juice using commercial enzyme. Journal of Food Process Engineering, 34 (4), 1298-1318, 2009.
[27] X D. Meng, Threinen, M. Hansen, D.Driedger. Effects of extrusion conditions on system parameters and physical properties of a chickpea flour-based snack. Food Research International, 43(2), 650–658, 2010.
[28] C. Mercier, P. Fillet. Modification of carbohydrate component of extrusion cooking of cereal product. Cereal Chemistry, 52, 283-297. 1975.
[29] D.C. Montgomery. Design and Analysis of Experiments. New York Wiley, 416-419, 2001.
[30] D.C. Montgomery. Designs and analysis of experiments. New York: John Wiley & Sons, 2004.
[31] A. Nawirska, M. Kwasniewska. Dietary fibre fractions from fruit and vegetable processing waste. Journal of Food Chemistry, 91(2), 221-225, 2005.
[32] A. Ng, S. Lecain, M.L. Parker, A.C. Smith, K.W. Waldron. Modification of cell wall polymers of onion waste. III. Effect of extrusion-cooking on cell wall material of outer fleshy tissue. Carbohydrate Polymers, 39, 341-349. 1999.
[33] A. Serena, B. Kundsen. Chemical and physic-chemical
characterisation of co-products from vegetable food and agro industries. Journal of Animal Feed Science Technology, 139, 109-124, 2007.
[34] V. Stojceska, P. Ainsworth, A. Plunkett, E. Ibanoglu, S. Ibanoglu. Cauliflower by-products as a new source of dietary fibre, antioxidants and proteins in cereal based ready-to-eat expanded snacks. Journal of Food Engineering, 87, 554-563, 2008.
[35] A. Upadhyay. Ph. D. thesis on ‘Optimization of carrot pomace powder incorporation on extruded product quality by response surface methodology’, Mahatma Gandhi Chitrakoot Gramoday Vishwavidyalys, Satna, Madhya Pradesh, India, 2008.
[36] S.Valentina, P. Ainsworth, I. Plunkett, A. Ibanoglu, Senol. The Advantage of using extrusion processing for increasing dietary fiber level in gluten-free products. Journal of Food Chemistry, 121(1), 156-164, 2010.
[37] S.G. Walde, R.G. Math, A. Chakkarvarthi, D.G. Rao. Preservation of carrots by dehydration techniques-A Review. Indian Food Packer, 46, 37-42, 1992.
[38] S. Yagci, F. Gogus. Response surface methodology for evaluation of physical and functional properties of extruded snack foods developed from food-by-products. Journal of Food Engineering, 86, 122-132, 2008.
[39] Z. Zhoul, K. Robards, S. Helliwell, C. Blanchard.