RAPID MONITORING OF FATTY ACID METHYL ESTER IN
SONOCHEMISTRY TRANSESTERIFICATION PROCESS
USING ATTENUATED TOTAL REFLECTION
A.PRAPTIJANTO1*, D.SEBAYANG1, E.AGUSTIAN1, P.UNTORO2
1
Universiti Tun Hussein Onn Malaysia, 86400 Parit Raja – Batu Pahat Malaysia. Faculty of Mechanical and Manufacturing Engineering
2
Indonesia Nuclear Energy Agency, Kawasan Puspitek Gd 71 Serpong - Tangerang Indonesia. Center for Technology of Nuclear Industry Materials
*E-mail: [email protected]
ABSTRACT
The transesterification process with conventional techniques usually based on use of stirring method typically over temperatures range of 70–200 oC, and reaction times of up to 1 h for achieving conversions reaction in the range of 90–95 mol%. The low rate of time chemical reaction will influence the high cost of biodiesel processing. Sonochemistry using ultrasound reactor is expected to increase reaction time with their cavitations effect. Production Fatty Acid Methyl Ester (FAME) from Jatropha Curcas Oil under ultrasonic using Clamp on Tubular reactor was investigated in this work. Transesterification ultrasonic process was carried out to study the effect of: time processing 5-15 minute, molar ratios of jatropha oil to methanol 1 : 5 to 1 : 9 and quantity of sodium hydroxide catalyst of 0.25 - 1 % w/w. In the present work, FAME and Triglyceride (TG) percentage analyzed using Gas Chromatography to meet the biodiesel oil standard (ASTM D6751). However, GC method requires sample preparation which time-consuming, complicated and high cost. Therefore, an effort to find a simple and rapid analysis method to monitor the formation of TG and FAME is presented. In this research Attenuated Total Reflection (ATR) spectra was used to analyze formation of FAME and TG percentage of transesterification with simple and rapid process. The optimal operating condition was obtained by applying oil to methanol molar ratio of 1: 7 and a catalyst concentration of 1 % w/w. The highest formation of FAME peak was reached at 0.1085A after 5 min of reaction.
Keywords: Biodiesel, Ultrasound, Clamp On Tubular Reactor, Attenuated Total Reflection
INTRODUCTION
Biodiesel has drawn significant attention due to increasing environmental concern and diminishing petroleum reserves. Some of the advantages of using biodiesel fuel are renewable, non toxicity and safer handling due to its higher point compared to those of fossil fuel [1]. Biodiesel fuel primarily contains of sulfur and aromatics, producing better gas exhaust emission than conventional fossil diesel fuel [2]. Biodiesel is an alternative fuel produced from renewable vegetable oils, animal fats or recycled cooking oils by transesterification reaction [3-7].One way of reducing the production costs for biodiesel fuel use of non edible oils, which tend to be considerably cheaper than edible vegetable oils. Jatropha Curcas oil cannot be used for food purposes, because it contains toxalbumine and the presence of various toxic phorbol esters, for some of the structure which have recently been elucidated. This plant adaptable to large variety of soils, altitude and rain volume, the plant yields seed oil rich in oleic and linoleic acid[8]. Hence, many scientists are interested to explore potential value of this plant.
mole of FAME and one mole of glycerol. The conventional techniques based on use of stirring method typically over temperatures range of 70–200 o
. Currently FAME and TG precentage in biodiesel sample is analyzed using Gas Chromatography to meet the biodiesel oil standard (ASTM D6751)[7][12],[16-19]. However, GC requires sample preparation which is time-consuming and high cost. Therefore, an effort to find a simple and rapid analysis method to monitor the formation of TG and FAME presented. At present ,infrared based methods previously reported have used fiber optic based on NIR [20] FTIR[21] for reaction monitoring. In this research Attenuated Total Reflection (ATR) spectra was used to analyze FAME and TG peak of transesterification with simple and rapid process. Comparison two method (GC and ATR) for analyze FAME and TG will be further discussed in this paper.
C, and reaction times of up to 1 h for achieving conversions reaction in the range of 90–95 mol% based on the type of raw material used, type and concentration of the catalyst and the percentage excess of alcohol[9-12]. At present, the application of low frequency ultrasound has been suggested of transesterification process. The ultrasonic field is known to produce unique chemical and physical effect that arise from the collapse of the cavitations bubbles. Cavitations results in conditions of local intense turbulence and liquid circulation currents, which should increase the rates of chemical reactions [13-15]. Transesterification from Jatropha Curcas Oil under ultrasonic using Clamp on Tubular reactor was investigated. Transesterification process was carried out to study the effect of: ultrasonic time processing 3-15 minute, molar ratios of jatropha oil to methanol 1: 5 to 1: 9 and quantity of sodium hydroxide catalyst 0.25 - 1 % w/w.
MATERIALS AND METHODS
Materials. The chemical content of Jatropha Curcas Oil supplied by The Faculty of Mechanical Engineering, University Tun Hussein Onn Malaysia as shown in Table 1.
[image:2.595.75.521.469.600.2]
Table 1: Fatty Acid Composition of Crude Jatropha Curcas Oil [22].
Fatty Acid Formula Systemic Name Structure wt %
Myristic C14H28O2 Tetradecanoic 14 :0 0-0.1
Palmitic C16H32O2 Hexadecanoic 16:0 14.1-15.3
Palmitoleic C16H30O2 cis-9 Hexadecanoic 16:1 0-1.3
Stearic C18H36O2 Octadecanoic 18:0 3.7-9.8
Oleic C18H34O2 cis-9-Octadecanoic 18:1 34.3-45.8
Linoleic C18H32O2 cis-9,cis-12 Octadecedianoic 18:2 29.0-44.2
Linolenic C18H30O2 cis-6, cis-9,cis-12 Octadecatrienoic 18:3 0-0.3
Arachidic C20H40O2 Eicosanoic 20:0 0-0.3
Behemic C22H44O2 Docasanoic 22:0 0-0.2
Figure 1: Schematic Diagram of Clamp on Tubular Reactor.
METHODS
Biodiesel production from free fatty acids (Jatropha Curcas) with methanol under ultrasonic using clamp on tubular reactor was investigated. The reaction mixture consisted of oleic acid with methanol and alkaline catalyst (NaOH). The molar ratio of oil to methanol was 1 : 5, 1: 7 , 1 : 8 and 1:9 and the quantity of the homogeneous catalyst was 0.25, 0.5 and 1 % w/w to the weight of oleic acid. The transesterification and washing of oleic acid with various time process at 5, 10, 15 minutes under ultrasound condition was studied at molar ratio (oleic acid to methanol 1:9) , alkaline catalyst of 1 % w/w. The application of low frequency ultrasound was used in transesterification and washing process. The ultrasonic wave is known to produce unique chemical and physical effect that arise from the collapse of the cavitations bubbles. Cavitations result in conditions of local intense turbulence and liquid circulation currents, which should increase the rates of chemical reactions. Table 2 shows the set up for clamp on tubular reactor.
Table 2: Harmonic Frequency Setting for Clamp on Tubular Reactor.
ANALYSIS
The samples were
analyzed for methyl ester
(FAME) and triglyceride (TG) by using ATR and Perkin Elmer software. The Perkin Elmer software was used to develop a monitoring method for the quantitative simultaneous
determination of FAME and TG in their mixtures. By this means, it was possible to
determine the conversion of TG to FAME instrumentally. The software uses the partial least
Definition Tube Diameter 60 mm
Length 580 mm
Frequency 20.000 kHz
Sweeping 0 kHz
Power 60 %
Max Current 3 A
PWM period 0.010 s
PWM ratio 100 %
FSWM range 0.500 kHz
FSWM ratio 50 %
[image:3.595.177.417.533.691.2]squares algorithm, with a constant path length, and uses the 1500 to 1000 cm−1 spectral region to determine the percentage of FAME in the TG/FAME mixture. All spectra were automatically smoothed and baseline – corrected prior the treatment, while the mean
[image:4.595.137.462.172.262.2]centering technique was used to scale the absorbance axis automatically. The spectral region comprises a number of peaks assigned to various vibrations as shown in table 3[23, 24]
Table 3: Characteristic Absorption Frequencies and Assignments of the Spectral Region (1500–1060 cm–1) used for the Determination of FAME in TG/FAME Mixtures.
The samples were assayed for methyl ester (FAME) using Gas Chromatography according to EN 14103, equipped with 0.25 μm film thickness ( 30 m in length x 0.32 mm in inner diameter) . A two hundred fifty mg sample of biodiesel mixed with 5 ml methyl heptadecanoate standard solution. The sample injection volume was 1 μl and the peak identification was made by comparing the retention time between the sample and standard compound. The calculation of FAME content expressed as a mass fraction in percent is calculated using the following formula in equation 1.
𝐶𝐶
=
(∑ 𝐴𝐴)−𝐴𝐴𝐸𝐸𝐸𝐸𝐴𝐴𝐸𝐸𝐸𝐸
𝑥𝑥
𝐶𝐶𝐸𝐸𝐸𝐸𝑥𝑥𝑉𝑉𝐸𝐸𝐸𝐸
𝑚𝑚
𝑥𝑥
100%
(1)where ΣA is the total peak area from the methyl ester in C14 to that in C24:1;
A
EI is the peakarea corresponding to methyl heptadecanoate; CEI is the concentration, in milligrams per
milliliter, of the methyl heptadecanoate solution; VEI
Furthermore, the triglyceride (TG) content was analyzed for by well-established Gas Chromatography according to EN 14105, employing a capillary column of 10 meter length and 0.32 mm inner diameter (0.1 μm film thickness). One micro liter solution of methyl ester in 8 ml heptanes containing approximately 100 mg esters, 80 ml butanetriol, 100 ml tricaprin and 100 ml MSTFA was injected under following condition : the carrier gas was hydrogen at flow rate of 1.5 ml/min. The detector temperature was 380
is the volume, in milliliters, of the methyl heptadecanoate solution; m is the mass, in milligrams, of the sample.
o
C. Oven temperature started at 50o C for 1 minute, increased at 370o C at flow rate of 10o
RESULT AND DISCUSSION
C min and held for 5 minute. The value freeglycerine max about 0.02%wt , monoglycerine 0,8 %, diglycerine 0,2%, triglycerine 0,2 % and total glycerine 0,25 % wt according of ASTM D6751-03 and EN 14214 were used to analyse biodiesel sample.
step by step into diglyceride, monoglyceride and glycerol. The concentration of triglycerides as the starting material decreases and the amount of methyl esters as the desired product increases throughout the reaction in the kinetic of typical methanolysis reaction. It concludes that TG was reacted completely into FAME using ultrasound clamp on tubular reactor.
Figure 2: TG and FAME monitoring using ATR at wavelength 1500 to 900 cm-1
.
[image:5.595.155.452.428.551.2]Figure 3 shows formation of FAME percentage in wavelength 1196 cm-1. Figure 3 also represents the reaction of transesterification with different oil to methanol in 5 minutes under ultrasonic process. The highest formation of FAME peak was reached on 0.1085A.
Figure 3: Formation FAME in wavelength 1196 cm-1
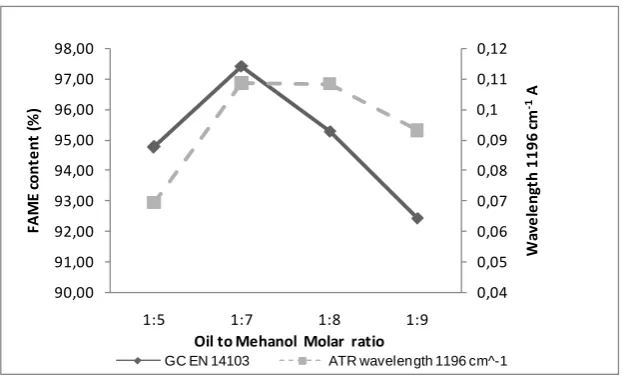
The yield of FAME depends on the molar ratio of methanol to oil. Based on stoichiomery calculation, the molar ratio of methanol to oil necessary to complete the transesterification reaction is 1:3. The excess amount of methanol is accelerated to shift the reaction toward the FAME formation. Thus in practice, the molar ratio of methanol to oil is usually more than 1:10 [12]. Comparison FAME analyses using GC and ATR with different oil to methanol molar ratio of 1:5 to 1:9 in 5 minutes under ultrasonic proces is shown in figure 4. Comparison of two methods of analysis of FAME content in the oil to methanol molar ratio of 1: 5 to 1: 9 shows the same trend result. The optimal operating condition was obtained by applying oil to methanol molar ratio of 1: 7.
with molar oil to methanol ratio.
1100 1196
Figure 4: Comaprison FAME monitoring using ATR and GC with different oil to methanol molar ratio.
Figure 5 shows FAME peak monitoring using ATR for transesterification process with different of catalyst to oil ratio of 0.25, 0.5, and 1 % (w/w).
Figure 5: Absorbance formations FAME in wavelength 1400 cm-1 with different catalyst to oil ratio.
Figure 6 presents comparison result formation of FAME percentage using ATR and GC in different catalyst ratio. Figure 6 shows formation of FAME using ATR reach the same trend result with using GC. The increasing of catalyst to oil ratio influences the increasing formation of FAME. This experiment showed that changing the amount of NAOH used affects the equilibrium formation of FAME content. The optimal formation of FAME was obtained by applying catalyst with concentration of 1%.
0,04 0,05 0,06 0,07 0,08 0,09 0,1 0,11 0,12
90,00 91,00 92,00 93,00 94,00 95,00 96,00 97,00 98,00
1:5 1:7 1:8 1:9
W
av
el
en
gt
h
11
96
cm
-1A
FA
M
E c
on
te
nt
(%
)
Oil to Mehanol Molar ratio
Figure 6 : Comparison result the FAME content
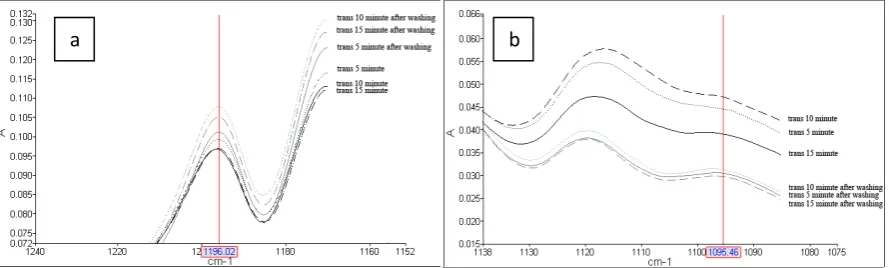
In this research, the biodiesel sample oil (transesterification oil with different time process) washed with distillated water under ultrasound process and then formation of FAME and TG percentage was assayed using ATR. The comparison result of FAME and TG percentage after and before washing shown in figure 7a and 7b. FAME percentage in all sample of biodiesel after washing process increased, whereas TG percentage is decreased. This is due to
using ATR and Gas Chromatography.
washing effect to remove contaminates as osmosis reaction process. Contaminates more readily dissolve reaction in water than in biodiesel. Methanol and glycerin are suspended in the biodiesel and when water bubbles generated by ultrasound touch methanol or glycerin, the methanol will merge with water and is faster separated from the biodiesel quickly.
Figure 7a): FAME percentage monitoring in wavelength 1196 cm -1 before and after washing b) TG percentage monitoring in wavelength 1095 cm -1 before and after
washing.
0,078 0,079 0,08 0,081 0,082 0,083 0,084 0,085 0,086
40 50 60 70 80 90 100 110
0,25 0,5 1
W
av
e l
en
gt
h 1
43
5,
8
cm
-1A
FA
M
E c
on
te
nt
(%
)
Oil to Catalyst ratio (w/w)
Molar ratio 1 : 9 GC EN14103 Molar Ratio 1:7 EN 14103 Molar Ratio 1 :9 ATR Molar ratio 1 : 7 ATR
[image:7.595.78.523.450.584.2]Figure 8: Free, Mono, Di , Tri and Mono Glycerin before and after washing process
The analysis tri, mono, di, free and total glycerin using the GC is shown in figure 8. Comparison between before and after washing reported that triglyceride decreases after washing process. It can be concluded that the result of FAME and TG analysis using ATR and GC showed the same trend results.
CONCLUSIONS
The optimal operating condition was obtained applying oil to methanol molar ratio of 1: 7 and a catalyst concentration of 1 % w/w. The highest formation of FAME peak was reached on 0.1085 A after 5 min of reaction. An attenuated total reflection (ATR) spectrum was used to analyze FAME and TG peak of transesterification with simple and rapid process.
ACKNOWLEDGMENTS
The author/authors would like to thank The Ministry of Higher Education Malaysia and Universiti Tun Hussein Onn Malaysia (UTHM) for supporting this research under the Postgraduate Incentive Research Grant 0676.
REFERENCES
[1] Y. Wang, S. Ou, P. Liu, F. Xue, and S. Tang, Comparison of two different processes to synthesize biodiesel by waste cooking oil, Journal of Molecular Catalysis A: Chemical, Vol. 252, 2006, pp. 107-112.
[2] A. Demirbas, Biodiesel from waste cooking oil via base-catalytic and supercritical methanol transesterification, Energy Conversion and Management, Vol. 50, 2009, pp. 923-927.
[3] Hu, Du, Z. Tang, and Min, Study on the Solvent Power of a New Green Solvent:Biodiesel, Industrial & Engineering Chemistry Research, Vol. 43, 2004, pp. 7928-7931.
[4] V. B. Veljkovic, S. H. Lakicevic, O. S. Stamenkovic, Z. B. Todorovic, and M. L. Lazic, Biodiesel production from tobacco (Nicotiana tabacum L.) seed oil with a high content of free fatty acids, Fuel, Vol. 85, 2006, pp. 2671-2675.
0,00 0,10 0,20 0,30 0,40 0,50 0,60
Free Mono Di Tri Total
M
ass (
m
g)
Free, Mono, Di, Tri and Total Glycerine
trans 5 minute
trans 10 minute
trans 15 minute
trans 5 min after washing
trans 10 min after washing
[5] K. G. Georgogianni, M. G. Kontominas, P. J. Pomonis, D. Avlonitis, and V. Gergis, Conventional and in situ transesterification of sunflower seed oil for the production of biodiesel, Fuel Processing Technology, Vol. 89, 2008, pp. 503-509.
[6] K. G. Georgogianni, A. K. Katsoulidis, P. J. Pomonis, G. Manos, and M. G. Kontominas, Transesterification of rapeseed oil for the production of biodiesel using homogeneous and heterogeneous catalysis, Fuel Processing Technology, Vol. 90, 2009, pp. 1016-1022.
[7] K. G. Georgogianni, A. P. Katsoulidis, P. J. Pomonis, and M. G. Kontominas, Transesterification of soybean frying oil to biodiesel using heterogeneous catalysts, Fuel Processing Technology, Vol. 90, 2009, pp. 671-676.
[8] W. Haas, H. Sterk, and M. Mitelbach, Novel12-Desoxy-16-hydroxyphorbol Dieseters Isolated from the Seed Oil of Jatropha Curcas, Journal of Natural Product, Vol. 65, 2002, pp. 1434-1441.
[9] M. Canakci and J. Van Grepen, Biodiesel Producion via Acid Catalysis, Transactions of the ASAE, Vol. 44, 2001, pp. 1429-1436.
[10] E. W. Eckey, Esterification and interesterification., JAOCS, Vol. 33, 1956, pp. 575-579. [11] E. Crabbe, C. Nolasco-Hipolito, G. Kobayashi, K. Sonomoto, and A. Ishizaki,
Biodiesel production from crude palm oil and evaluation of butanol extraction and fuel properties, Process Biochemistry, Vol. 37, 2001, pp. 65-71.
[12] H. J. Berchmans and S. Hirata, Biodiesel production from crude Jatropha curcas L. seed oil with a high content of free fatty acids, Bioresource Technology, Vol. 99, 2008, pp. 1716-1721.
[13] K. S. Suslick, J. J. Gawienowski, P. F. Schubert, and H. H. Wang, Sonochemistry in non-aqueous liquids, Ultrasonics, Vol. 22, 1984, pp. 33-36.
[14] A. B. Pandit, P. S. Kumar, and M. Sivakumar, Improve reactions with hydrodynamic cavitation, Chem. Eng. Prog, Vol. 95, 1999, pp 43.
[15] T. J. Mason, Ultrasound in Synthetic Organic Chemistry,Chem. Eng. Prog, vol. 26, 1997, pp. 443-451.
[16] H. Makkar, J. Maes, W. De Greyt, and K. Becker, Removal and Degradation of Phorbol Esters during Pre-treatment and Transesterification of ;Jatropha curcas; Oil, Journal of the American Oil Chemists' Society, Vol. 86, 2009, pp. 173-181.
[17] F. F. P. Santos, J. Q. Malveira, M. G. A. Cruz, and F. A. N. Fernandes, Production of biodiesel by ultrasound assisted esterification of Oreochromis niloticus oil, Fuel, Vol. 89, 2009, pp. 275-279.
[18] R. E. Armenta, M. Vinatoru, A. M. Burja, J. A. Kralovec, and C. J. Barrow, Transesterification of fish oil to produce fatty acid ethyl esters using ultrasonic energy, American Oil Chemists' Society, Vol 84 (11), 2007, pp. 1045-1052.
[19] V. Ruiz-Gutiérrez and L. J. R. Barron, Methods for the analysis of triacylglycerols, Journal of Chromatography B: Biomedical Sciences and Applications, Vol. 671, 1995, pp. 133-168.
[20] G. Knothe, Rapid monitoring of transesterification and assessing biodiesel fuel quality by near-infrared spectroscopy using a fiber-optic probe, Journal of the American Oil Chemists' Society, Vol. 76, 1999, pp. 795-800.
[21] N. Siatis, A. Kimbaris, C. Pappas, P. Tarantilis, and M. Polissiou, Improvement of biodiesel production based on the application of ultrasound: Monitoring of the procedure by FTIR spectroscopy, Journal of the American Oil Chemists' Society, Vol. 83, 2006, pp. 53-57.
Feedstock Feedstock, European Journal of Scientific Research, Vol.29 No.3, 2009, pp. 396-403.
[23] R. M. Silverstein and F. X. Webster, Spectrometric Identification of Organic Compounds, 7th Edition, 7th
[24] G. Socrates, Infrared Characteristic Group Frequencies vol. 2nd Edition. New York: John Wiley & Sons, 1994.
![Table 1: Fatty Acid Composition of Crude Jatropha Curcas Oil [22]. Fatty Acid Formula Systemic Name Structure wt %](https://thumb-us.123doks.com/thumbv2/123dok_us/8779179.903213/2.595.75.521.469.600/table-composition-crude-jatropha-curcas-formula-systemic-structure.webp)