Compared to Etest and CLSI Broth Microdilution for MIC Testing of
Aerobic Gram-Positive and Gram-Negative Bacterial Species
R. P. Rennie,aL. Turnbull,aC. Brosnikoff,aand J. Clokeb
Medical Microbiology Research Laboratory, Department of Laboratory Medicine and Pathology, University of Alberta Hospital, Edmonton, Alberta, Canada,a
and Thermo Fisher Scientific, Basingstoke, United Kingdomb
The M.I.C. Evaluator strip (Thermo Fisher Scientific, Basingstoke, United Kingdom) uses a methodology similar to that of Etest.
In this first assessment of the M.I.C. Evaluator device, 409 strains of aerobic Gram-positive bacteria (staphylococci, streptococci,
and enterococci) and 325 strains of
Enterobacteriaceae
,
Pseudomonas
species, and
Acinetobacter
species were tested by M.I.C.
Evaluator strip, Etest, and broth microdilution as a reference standard. The Gram-positive bacteria included staphylococci
(me-thicillin-resistant
Staphylococcus aureus
, methicillin-susceptible
S. aureus
, and coagulase-negative staphylococci),
Streptococcus
pneumoniae
, beta-hemolytic streptococci and viridians group strains, vancomycin-resistant enterococci, and other enterococci.
The Gram-negative bacteria included 250 strains of 60
Enterobacteriaceae
species plus 50
Pseudomonas
and 25
Acinetobacter
species. A total of 14 antimicrobial agents (depending on the species) were included. The same methodology and reading format
were used for M.I.C. Evaluator strips and Etest. Broth microdilution methodology was performed according to CLSI document
M07-A8. For the clinical strains,
>
95% of results were plus or minus one doubling dilution for all species. There were fewer than
5% minor errors, fewer than 3% major errors, and fewer than 1% very major errors. M.I.C. Evaluator strips and Etest often
re-ported higher MICs than the reference broth microdilution method. The M.I.C. Evaluator strips provided results comparable to
those of the predicate Etest device and are of value for the accurate testing of MICs for these important pathogens.
T
here are three methods that permit accurate MIC testing.
These are broth and agar dilution tests and a gradient endpoint
method that incorporates the antimicrobial agent as a defined
gradient onto the back of a solid plastic strip. MICs are read where
the zone of inhibition intersects with the drug concentration on
the strip. Until now, the only gradient endpoint device available
was Etest, developed by AB Biodisk, Solna, Sweden, and currently
marketed by bioMérieux. This method has previously been shown
to be an accurate and simple alternative to reference broth or disk
methods (9, 12, 15, 18).
The M.I.C. Evaluator strip (M.I.C.E) is a new gradient
end-point susceptibility test device. Both the M.I.C. Evaluator strip
and Etest are performed similarly and have excellent utility for
directed MIC testing against specific agents and microorganisms
isolated from clinical samples. The advantage of these devices is
the ease of use and accurate MIC results for patient management.
MIC data also are valuable for clinical pharmacists to determine
optimal pharmacodynamic dosing. In these situations, it is
impor-tant to be able to detect resistance early in the course of treatment
(5, 7, 10). To ensure that any new device is effective in the clinical
laboratory, appropriate validation studies, including both control
strains and an extensive collection of clinical isolates, is essential to
ensure evaluable results for patient care.
Gram-positive and Gram-negative aerobic and facultative
an-aerobic bacteria occupy the largest group of microorganisms
as-sociated with infections in patients in critical care settings. The
consequences of inappropriate therapy or of inadequate dosing in
these patients may have important clinical consequences. It is,
however, important that the
in vitro
MIC device provides an
ac-curate estimation of the efficacy of the antimicrobial agent against
the infecting organism. We compared the new M.I.C. Evaluator
strip to Etest to investigate any discordance between the two
de-vices, as well as to the standard CLSI reference broth
microdilu-tion method (2), on a collecmicrodilu-tion of staphylococci, streptococci,
and enterococci. We also evaluated the device on a large collection
of enterobacteriaceae, as well as
Pseudomonas
species and
Acineto-bacter
species. This is the first comprehensive evaluation of this
new gradient endpoint device that compares it to the CLSI
refer-ence broth dilution method. The M.I.C. Evaluator device has been
compared to the British Society for Antimicrobial Chemotherapy
(BSAC) method, with observations similar to those in the current
study (1, 8). Other collections of bacterial species, including
an-aerobes and fastidious bacteria, are reported in a companion
pub-lication (11).
MATERIALS AND METHODS
Bacterial species. (i) Gram-positive bacteria.A total of 409 fresh or re-cently frozen clinical strains of staphylococci, streptococci, and entero-cocci were tested. All isolates were from individual patients at the Univer-sity of Alberta Hospital, Edmonton, Canada. They were identified in our laboratory using primary tests, standard automated methods, or molecu-lar tests as required. Strains were stored at⫺70°C in litmus milk prior to testing. Strains were also characterized for resistance determinants where appropriate. Methicillin resistance in Staphylococcus aureus was con-firmed by cefoxitin disc testing, PBP 2=testing, andmecAgene testing. There were 157 strains ofS. aureus, including methicillin-susceptible
Received16 September 2011Returned for modification3 October 2011 Accepted3 January 2012
Published ahead of print11 January 2012
Address correspondence to R. P. Rennie, [email protected].
Copyright © 2012, American Society for Microbiology. All Rights Reserved.
doi:10.1128/JCM.05395-11
on May 16, 2020 by guest
http://jcm.asm.org/
strains (MSSA) (84), methicillin-resistantS. aureus(MRSA) (20), and coagulase-negative staphylococci (CNS) (53); 151 strains of streptococci, including Streptococcus pneumoniae(60), beta-hemolytic streptococci (40), and viridans group streptococci (51); and 100 strains of enterococci (52 vancomycin-resistant enterococci [VRE] and 48Enterococcus spe-cies). The species of strains of coagulase-negative staphylococci and van-comycin-susceptible enterococci were not fully determined, since this did not bear on the comparison of antimicrobial test results. Among the 51 strains included as viridans group streptococci, there were 13S. mitis, 4S. salivarius, 3S. sanguis, 2S. dysgalactiae, 1 each ofS. mutansandS. equi
subsp.zooepidemicus, and 16S. anginosusstrains; the species of 11 strains were not determined. Within the beta-hemolytic streptococci, there were 25 strains ofS. pyogenes(group A), 11 strains ofS. agalactiae(group B), and 4 strains of other species (group C). Among the vancomycin-resistant enterococci, 29 strains carried VanA and 14 strains carried VanB. There were 8 strains classified as VanC (Enterococcus casseliflavusorEnterococcus gallinarum), and there was 1 strain ofE. gallinarumwith both VanA and VanC genes. The quality control strains for Gram-positive tests wereS. aureusATCC 29213,S. pneumoniaeATCC 49619, andEnterococcus faeca-lisATCC 29212.
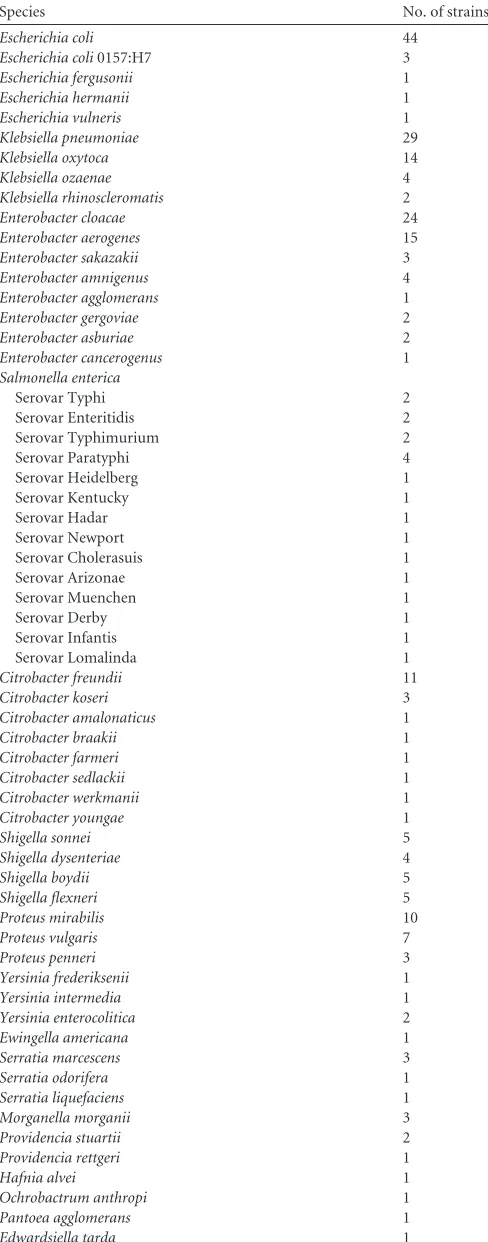
(ii) Gram-negative bacteria.For the enterobacteriaceae, a total of 250 strains, each from individual patients, were tested. There were 16 com-mon genera and 60 species in this collection of strains (Table 1). For
Pseudomonasand Acinetobacterspecies, the following organisms were tested: 50Pseudomonasspecies (40P. aeruginosa, 5P. stutzeri, 3P. fluore-scens, and 1 each ofP. pseudoalcaligenesandP. mendocina) and 25 strains of theAcinetobacter baumanniicomplex. The same methodologies as those for the Gram-positive species were used for the identification and for the storage of strains prior to testing.
Four standard quality control strains were tested against the Gram-negative isolates as appropriate. These wereEscherichia coliATCC 25922,
P. aeruginosaATCC 27853,S. aureus ATCC 29213, and Enterococcus faecalisATCC 29212. CLSI quality control MIC ranges were available for all antimicrobial agents tested in this study.
Antimicrobial agents. (i) Gram-positive bacteria.A total of 13 anti-microbial agents were tested against the Gram-positive bacterial strains. The agents tested were ampicillin, amoxicillin, amoxicillin-clavulanate, cefotaxime, ciprofloxacin, erythromycin, gentamicin, levofloxacin, lin-ezolid, oxacillin, penicillin, tetracycline, and vancomycin. Agents were tested as appropriate for the species.
(ii) Gram-negative bacteria.In this study, nine agents produced for the M.I.C. Evaluator strips were tested: ampicillin, amoxicillin, amoxicil-lin-clavulanate, cefotaxime, tetracycline, gentamicin, ciprofloxacin, imi-penem, and levofloxacin. The concentration ranges were similar for Etest and the M.I.C. Evaluator device. Etest strips were purchased from the manufacturer (bioMérieux). M.I.C. Evaluator strips were supplied by Thermo Fisher Scientific, Basingstoke, United Kingdom.
CLSI broth microdilution tests.Standard CLSI broth microdilution methodology (2) was used to test for susceptibility, with media of cation-supplemented Mueller-Hinton broth (CSMHB) for staphylo-cocci, enterostaphylo-cocci, and for the Gram-negative species and CSMHB with 5% horse blood for streptococci. Strains were incubated at 35°C for 20 to 24 h, and susceptibility was determined according to standard CLSI breakpoints (3).
[image:2.585.299.543.79.700.2]Gradient endpoint device testing.The same strains were tested using the same inocula as those used for the broth microdilution tests. The bacterial strains were inoculated onto appropriate Mueller-Hinton agar (Thermo Fisher, Basingstoke, United Kingdom) according to CLSI M07-A8 (2). M.I.C.E and Etest strips were added to the plates according to the manufacturers’ instructions and were incubated for 20 to 24 h at 35°C. Complete inhibition was read for each manufacturers’ strip at the point where the elliptical zone intersected with the strip. For trimethoprim-sulfamethoxazole, erythromycin, tetracycline, and linezolid, where 80% inhibition was taken as the endpoint, the manufacturer’s diagrams and photographs were used for the analysis of the test results.
TABLE 1Enterobacterial species testeda
Species No. of strains
Escherichia coli 44
Escherichia coli0157:H7 3
Escherichia fergusonii 1
Escherichia hermanii 1
Escherichia vulneris 1
Klebsiella pneumoniae 29
Klebsiella oxytoca 14
Klebsiella ozaenae 4
Klebsiella rhinoscleromatis 2
Enterobacter cloacae 24
Enterobacter aerogenes 15
Enterobacter sakazakii 3
Enterobacter amnigenus 4
Enterobacter agglomerans 1
Enterobacter gergoviae 2
Enterobacter asburiae 2
Enterobacter cancerogenus 1
Salmonella enterica
Serovar Typhi 2
Serovar Enteritidis 2
Serovar Typhimurium 2
Serovar Paratyphi 4
Serovar Heidelberg 1
Serovar Kentucky 1
Serovar Hadar 1
Serovar Newport 1
Serovar Cholerasuis 1
Serovar Arizonae 1
Serovar Muenchen 1
Serovar Derby 1
Serovar Infantis 1
Serovar Lomalinda 1
Citrobacter freundii 11
Citrobacter koseri 3
Citrobacter amalonaticus 1
Citrobacter braakii 1
Citrobacter farmeri 1
Citrobacter sedlackii 1
Citrobacter werkmanii 1
Citrobacter youngae 1
Shigella sonnei 5
Shigella dysenteriae 4
Shigella boydii 5
Shigella flexneri 5
Proteus mirabilis 10
Proteus vulgaris 7
Proteus penneri 3
Yersinia frederiksenii 1
Yersinia intermedia 1
Yersinia enterocolitica 2
Ewingella americana 1
Serratia marcescens 3
Serratia odorifera 1
Serratia liquefaciens 1
Morganella morganii 3
Providencia stuartii 2
Providencia rettgeri 1
Hafnia alvei 1
Ochrobactrum anthropi 1
Pantoea agglomerans 1
Edwardsiella tarda 1
aSixteen genera and 250 strains were tested.
on May 16, 2020 by guest
http://jcm.asm.org/
Performance criteria.Standard performance criteria were included in this method for comparisons of the two gradient endpoint devices against the reference broth microdilution method, includingⱖ95% quality con-trol strains within acceptable ranges, ⱖ90% essential and categorical agreement,ⱕ10% minor errors,ⱕ3% major errors, andⱕ1.5% very major errors. Essential agreement was defined for this study as a result being plus or minus one doubling dilution of that from broth microdilu-tion. These criteria are identified in FDA guidance documents (16) and are universally used.
RESULTS
The quality control organisms for both positive and
Gram-negative isolates were tested a total of seven times during this
evaluation. Quality control strains were included with each test
run. Results for all of the strains tested showed that the MICs were
within published CLSI ranges for each of the antimicrobial agents
tested. Each strain tested in the study was isolated from a different
patient, although as would be expected in most current hospital
settings, it is possible that some of the resistant strains were in fact
clonal and associated with ongoing outbreaks.
For the Gram-negative enterobacterial isolates, a total of 250
strains of 16 genera and 60 species were tested by all three methods
(Table 1). For isolates of
Pseudomonas
and
Acinetobacter
species, a
total of 75 strains were tested.
The number of susceptible (S), intermediate (I), and resistant
(R) strains and their essential agreements in comparisons of
M.I.C. Evaluator strips and Etest to the standard reference method
for each of the Gram-positive genera are summarized in Tables 2
(staphylococci), 3 (streptococci), and 4 (enterococci). There were
very few resistant streptococci, as would be expected, and S, I, and
R results for those species are not included. The combined error
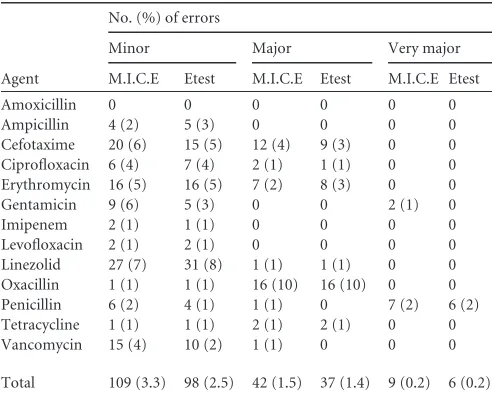
rates for all Gram-positive bacteria are shown in Table 5.
[image:3.585.40.550.76.256.2]For the staphylococci, essential agreement was
⬍
90% for all
agents except erythromycin and gentamicin. Categorical
agree-ment, however, was
⬎
95% for all agents except cefotaxime and
TABLE 2Essential agreement for M.I.C.E and Etest compared to broth microdilution for 157 strains of staphylococci
Drug
No. of strains in each resistance category
No. of strains according to no. of doubling dilutions away from reference
Essential agreement (%) (⫾1 dilution)
No. of strains according to no. of doubling dilutions away from reference
⬎⫺2 ⫺2 2 ⬎2
S I R M.I.C.E Etest M.I.C.E Etest M.I.C.E. Etest M.I.C.E Etest M.I.C.E Etest
Cefotaxime 132 9 16 0 0 0 0 105 (67) 128 (82) 31 16 21 13
Ciprofloxacin 104 3 50 0 0 1 1 67 (43) 70 (45 62 55 27 31
Erythromycin 81 0 76 7 6 3 0 147 (94) 150 (96) 0 0 0 1
Gentamicin 133 7 17 3 3 7 8 144 (92) 145 (92) 2 1 1 0
Levofloxacin 102 4 51 0 0 2 2 131 (83) 129 (82) 21 22 3 4
Linezolid 155 1 1 0 23 39 53 116 (74) 81 (52) 2 0 0 0
Oxacillin 111 0 46 0 0 1 1 103 (66) 95 (61) 20 29 34 33
Penicillin 26 0 131 12 17 9 9 110 (70) 110 (70) 20 13 6 8
Tetracycline 142 3 12 1 1 0 0 115 (73) 70 (45) 32 68 9 18
Vancomycin 154 2 1 0 0 0 0 95 (61) 132 (84) 59 9 3 1
Total 1,140 29 401 23 50 62 74 1,133 (72) 1,110 (71) 218 197 83 96
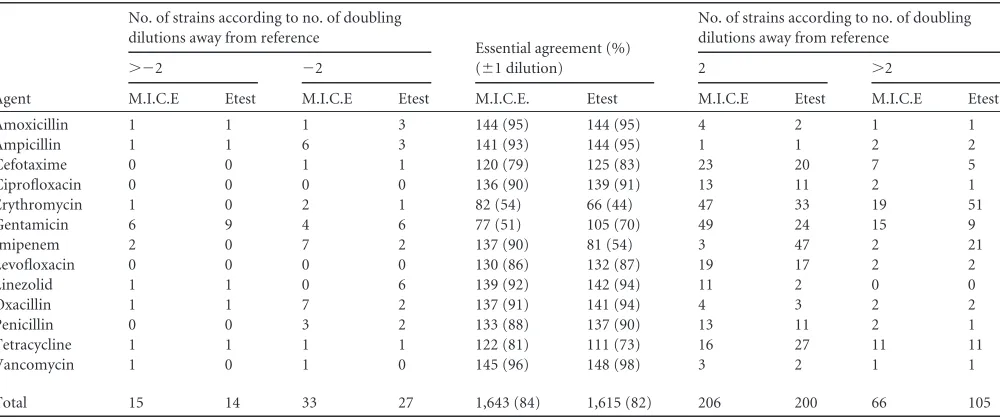
TABLE 3Essential agreement for M.I.C. Evaluator strips (M.I.C.E) and Etest compared to broth microdilution for 151 strains of streptococci
Agent
No. of strains according to no. of doubling dilutions away from reference
Essential agreement (%) (⫾1 dilution)
No. of strains according to no. of doubling dilutions away from reference
⬎⫺2 ⫺2 2 ⬎2
M.I.C.E Etest M.I.C.E Etest M.I.C.E. Etest M.I.C.E Etest M.I.C.E Etest
Amoxicillin 1 1 1 3 144 (95) 144 (95) 4 2 1 1
Ampicillin 1 1 6 3 141 (93) 144 (95) 1 1 2 2
Cefotaxime 0 0 1 1 120 (79) 125 (83) 23 20 7 5
Ciprofloxacin 0 0 0 0 136 (90) 139 (91) 13 11 2 1
Erythromycin 1 0 2 1 82 (54) 66 (44) 47 33 19 51
Gentamicin 6 9 4 6 77 (51) 105 (70) 49 24 15 9
Imipenem 2 0 7 2 137 (90) 81 (54) 3 47 2 21
Levofloxacin 0 0 0 0 130 (86) 132 (87) 19 17 2 2
Linezolid 1 1 0 6 139 (92) 142 (94) 11 2 0 0
Oxacillin 1 1 7 2 137 (91) 141 (94) 4 3 2 2
Penicillin 0 0 3 2 133 (88) 137 (90) 13 11 2 1
Tetracycline 1 1 1 1 122 (81) 111 (73) 16 27 11 11
Vancomycin 1 0 1 0 145 (96) 148 (98) 3 2 1 1
Total 15 14 33 27 1,643 (84) 1,615 (82) 206 200 66 105
on May 16, 2020 by guest
http://jcm.asm.org/
[image:3.585.44.544.514.724.2]oxacillin. M.I.C. Evaluator strips and Etest performed in an
equiv-alent manner. As shown in Table 2, both gradient endpoint
de-vices gave larger numbers of results at two or more dilutions above
the reference method MIC for most of the agents tested with
staphylococci. The major issue that was discovered was with
oxa-cillin and penioxa-cillin. Higher MICs for the two gradient devices
resulted in some major errors for oxacillin, and some lower
gra-dient penicillin MICs resulted in a number of very major errors.
Therefore, the gradient endpoint devices would report oxacillin as
resistant, whereas the reference method called these strains
susceptible. The opposite occurred for penicillin (Table 5). On
closer examination, all of the oxacillin discrepancies were among
methicillin-resistant
S. aureus
isolates that were captured by
M.I.C.E strips and Etest but not by broth microdilution. For
pen-icillin, discordant results all occurred among oxacillin-susceptible
S. aureus
strains. We did not observe any small colonies (so-called
fuzzy zones) surrounding the gradient endpoint strips in these
isolates. There were two very major errors with gentamicin, one
for an
S. pyogenes
isolate and one for an
S. anginosus
isolate.
For the streptococci (Table 3), essential agreement was low for
erythromycin, gentamicin, tetracycline, and cefotaxime, but the
categorical agreement was
⬎
95% for all agents that have CLSI
breakpoints except for erythromycin (90 and 87% for M.I.C.
Eval-uator and Etest, respectively). The essential agreement of Etest
(54%) for imipenem was much lower than that of M.I.C.E (90%).
As in the case of staphylococci, streptococcal MICs with the
gra-dient endpoint devices tended to be higher than the reference
MICs (Table 3). Most of the streptococci have very low MICs for
all agents tested, such that a 2-fold difference in MIC between the
gradient endpoint and reference broth method might only reflect
a change from a MIC of 0.004 to 0.016, for example. This would
not affect categorical agreement or reporting on the likely efficacy
of that agent.
For the 100 strains of enterococci tested, ampicillin had a
high essential agreement, but for linezolid and vancomycin the
agreements were variable and lower between the two devices
compared to reference broth microdilution. For linezolid, all
results were clustered within a narrow range of MICs (0.5 to 4
mg/liter), so that while the essential agreements were good, the
categorical agreements were lower (74 and 70% for M.I.C.
Evaluator and Etest, respectively) because the result for some
strains was 4 mg/liter, whereas the MIC for the gradient
end-points devices was 2 mg/liter. For vancomycin, as was the case
of other Gram-positive species, the gradient endpoint devices
had slightly higher MICs than the reference method. Thus,
almost all of the categorical results had minor errors for both
linezolid and vancomycin. There was one major error for
M.I.C. Evaluator strips and Etest with linezolid and one major
error for M.I.C.E with vancomycin (Table 5).
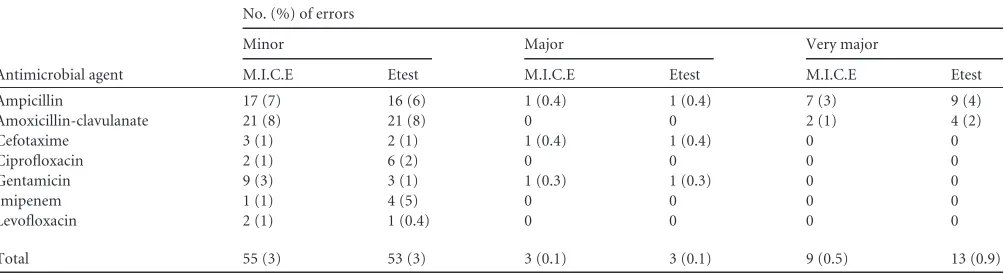
For the Gram-negative species studied (Table 6), essential
agreement also was high, except for the two fluoroquinolones
cip-rofloxacin and levofloxacin, but these results did not affect
cate-gorical agreements. Catecate-gorical agreement was
ⱖ
95% for all
strains tested except for ampicillin and amoxicillin-clavulanic acid
(both were 90 to 91%). Very major errors were observed only with
ampicillin and amoxicillin-clavulanate (Table 7). All of these
oc-curred with
P. vulgaris
and one
C. freundii
isolate. All other
mi-croorganism-antimicrobial agent combinations were within
ac-ceptable rates of error.
DISCUSSION
[image:4.585.43.545.76.206.2]This study was performed with the first available antimicrobial
agents produced for the M.I.C. Evaluator strips. For those agents,
the comparison was made first against Etest as the predicate device
to identify any major method discrepancies and then against the
CLSI broth microdilution method as the reference method.
TABLE 4Essential agreement for M.I.C.E and Etest compared to broth microdilution for 100 enterococcal strains
Agent
No. of strains in each resistance categorya
No. of strains according to no. of doubling dilutions away from reference
Essential agreement (%) (⫾1 dilution)
No. of strains according to no. of doubling dilutions away from reference
⬎⫺2 ⫺2 2 ⬎2
S I R M.I.C.E Etest M.I.C.E Etest M.I.C.E Etest M.I.C.E Etest M.I.C.E Etest
Ampicillin 63 0 38 0 0 1 1 92 (91) 95 (94) 8 5 0 0
Gentamicin NA 0 0 0 0 72 (71) 86 (85) 21 14 8 1
Imipenem NA 0 0 2 1 97 (96) 96 (95) 2 3 0 1
Linezolid 70 31 0 1 0 0 10 100 (99) 91 (90) 0 0 0 0
Vancomycin 61 9 31 0 0 1 1 78 (77) 92 (91) 20 6 2 2
Total 194 40 69 1 0 4 13 439 (88) 460 (92) 51 28 10 4
a
NA, no CLSI breakpoints available.
TABLE 5Error rates for 409 strains of staphylococcal, streptococcal, and enterococcal species
Agent
No. (%) of errors
Minor Major Very major
M.I.C.E Etest M.I.C.E Etest M.I.C.E Etest
Amoxicillin 0 0 0 0 0 0
Ampicillin 4 (2) 5 (3) 0 0 0 0
Cefotaxime 20 (6) 15 (5) 12 (4) 9 (3) 0 0 Ciprofloxacin 6 (4) 7 (4) 2 (1) 1 (1) 0 0 Erythromycin 16 (5) 16 (5) 7 (2) 8 (3) 0 0
Gentamicin 9 (6) 5 (3) 0 0 2 (1) 0
Imipenem 2 (1) 1 (1) 0 0 0 0
Levofloxacin 2 (1) 2 (1) 0 0 0 0
Linezolid 27 (7) 31 (8) 1 (1) 1 (1) 0 0 Oxacillin 1 (1) 1 (1) 16 (10) 16 (10) 0 0 Penicillin 6 (2) 4 (1) 1 (1) 0 7 (2) 6 (2) Tetracycline 1 (1) 1 (1) 2 (1) 2 (1) 0 0
Vancomycin 15 (4) 10 (2) 1 (1) 0 0 0
Total 109 (3.3) 98 (2.5) 42 (1.5) 37 (1.4) 9 (0.2) 6 (0.2)
on May 16, 2020 by guest
http://jcm.asm.org/
[image:4.585.40.286.524.721.2]The data showed that the M.I.C. Evaluator strips are
compara-ble to Etest and to the broth dilution reference method for these
agents against a comprehensive range of aerobic Gram-positive
and Gram-negative bacterial species. For most antimicrobial
agents with most bacterial species, it was remarkable how similarly
the two gradient endpoint methods performed for a large number
of strains of these varied species. Additional agents are now being
produced and will be tested in the same manner to verify the
capabilities of the M.I.C. Evaluator strips.
The categorical agreements for both M.I.C. Evaluator strips
and for Etest were comparable. The most notable issues occurred
with beta-lactam antimicrobials, erythromycin, and with the
fluo-roquinolones. Since all of these agents were not tested against
every species, it is difficult to know if this is a genus phenomenon
or is broadly observed across species. For erythromycin, it is well
known that there is less agreement between broth and agar
meth-ods, since testing is affected by pH changes from the CO
2required
for incubation in agar. We have also discovered with the
entero-bacteriaceae, for example, that there are more minor errors with
beta-lactam agents. In most cases the gradient endpoint methods
tend to give higher MICs than the reference broth dilution
method, and this was consistent for the Gram-positive species. For
a number of antimicrobial-organism combinations, particularly
carbapenems, the Etest has been reported to yield higher MICs
than broth microdilution (4, 6, 13, 17). It is possible that the small
volume used in the broth method reduces the likelihood of finding
slower-growing resistant subpopulations, but this is not well
un-derstood.
[image:5.585.39.549.88.254.2]Unlike our findings with the enterobacteriaceae, categorical
agreements with ampicillin for streptococci and enterococci were
very high. This is due to very low MICs for these species compared
to those for enterobacteriaceae, so the categorical agreements
would be expected to be much better. We have noted that with
some microorganism-antimicrobial agent combinations, both
M.I.C. Evaluator strips and Etest tend to report slightly higher
MICs than broth microdilution and may well identify resistance
determinants more readily (data not shown). This phenomenon
has been observed in comparisons of the Etest to commercial
broth dilution systems when testing for resistance markers such as
vancomycin in staphylococci (14). In this study, we observed
higher oxacillin MICs among the staphylococci, resulting in 10%
major errors for both M.I.C. Evaluator strips and Etest compared
to the reference broth method. We determined that these errors
were for methicillin-resistant staphylococci. This is significant,
since the reference broth dilution method would undercall
oxa-cillin resistance. Most laboratories use more than one test to detect
TABLE 6Combined essential agreement for 325 strains of enterobacterial,Pseudomonas, andAcinetobacterspecies for M.I.C.E and Etest compared to broth microdilution
Agent
No. of strains in each resistance category
No. of strains according to no. of doubling dilutions away from reference
Essential agreement (%) (⫾1 dilution)
No. of strains according to no. of doubling dilutions away from reference
⬎⫺2 ⫺2 ⫹2 ⬎2
S I R M.I.C.E Etest M.I.C.E Etest M.I.C.E Etest M.I.C.E Etest M.I.C.E Etest
Amoxicillina 7 7 10 12 227 (91) 225 (90) 4 4 2 2
Amoxicillin-clavulanate 154 26 70 1 2 5 10 219 (88) 224 (90) 20 11 4 3
Ampicillin 92 15 143 3 6 10 11 221 (89) 226 (90) 13 3 4 5
Ciprofloxacin 269 8 48 2 1 12 4 257 (76) 281 (85) 49 35 5 4
Cefotaxime 224 1 25 4 6 10 9 225 (90) 221 (88) 9 13 2 1
Gentamicin 275 6 31 3 4 18 17 292 (89) 297 (92) 1 1 3 2
Imipenem 59 1 15 0 0 0 1 70 (93) 61 (81) 5 13 0 0
Levofloxacin 227 6 17 0 0 1 1 209 (84) 192 (77) 36 51 5 6
Total 1,638 65 372 20 26 66 65 1,720 (87) 1,727 (87) 137 131 25 23
a
No resistance breakpoints were found for the strains tested.
TABLE 7Combined error rates for 325 strains of enterobacterial,Pseudomonas, andAcinetobacterspecies for M.I.C.E and Etest compared to broth microdilution
Antimicrobial agent
No. (%) of errors
Minor Major Very major
M.I.C.E Etest M.I.C.E Etest M.I.C.E Etest
Ampicillin 17 (7) 16 (6) 1 (0.4) 1 (0.4) 7 (3) 9 (4)
Amoxicillin-clavulanate 21 (8) 21 (8) 0 0 2 (1) 4 (2)
Cefotaxime 3 (1) 2 (1) 1 (0.4) 1 (0.4) 0 0
Ciprofloxacin 2 (1) 6 (2) 0 0 0 0
Gentamicin 9 (3) 3 (1) 1 (0.3) 1 (0.3) 0 0
Imipenem 1 (1) 4 (5) 0 0 0 0
Levofloxacin 2 (1) 1 (0.4) 0 0 0 0
Total 55 (3) 53 (3) 3 (0.1) 3 (0.1) 9 (0.5) 13 (0.9)
on May 16, 2020 by guest
http://jcm.asm.org/
[image:5.585.43.545.586.723.2]MRSA, but our observations support the validity of the gradient
endpoint methods to find these isolates.
In more than 90% of minor and major errors, when we
exam-ined the results, the M.I.C. Evaluator strip and Etest MICS were
higher than the broth microdilution results. For enterococci, there
was only one M.I.C.E result where the broth microdilution result
was susceptible. These test systems measure different interactions
between an antimicrobial agent and microorganism. It is to be
expected that there will be some minor differences between the
systems. It is quite satisfying that both gradient endpoint systems
provide MIC measurements that are very close to those of the
broth microdilution reference method.
We expect that these results will establish a mechanism to test
additional M.I.C. Evaluator strip agents against Gram-positive
and Gram-negative bacteria as they become available. A
compan-ion manuscript (11) will report on the validity of the M.I.C.
Eval-uator strips against anaerobes and other fastidious bacterial
spe-cies. All of these studies have shown that the M.I.C. Evaluator
strips provide accurate estimations of the MIC of these bacteria
that are equivalent to results from Etest. Differences with
refer-ence broth microdilution observations are due to the different
formats for these tests and to the mechanics of the interactions
between bacterial cells on agar versus those in broth. For the most
part, the results are very consistent and provide a rationale for the
use of the M.I.C. Evaluator strips for routine MIC antimicrobial
susceptibility testing.
ACKNOWLEDGMENT
This study was supported by an unrestricted grant in aid from Thermo Fisher Scientific, Basingstoke, United Kingdom.
REFERENCES
1.Carvalhaes CG, Campana EH, Barbosa PP, Paula AM, Gales AC.2011. Comment on: performance of the Oxoid M.I.C. evaluator strips com-pared with the Etest and BSAC agar dilution. J. Antimicrob. Chemother. 66:1192–1193.
2.Clinical and Laboratory Standards Institute.2009. Methods for dilution antimicrobial susceptibility tests for bacteria that grow aerobically; ap-proved standard, 8th ed. M07-A8. CLSI, Wayne, PA.
3.Clinical and Laboratory Standards Institute.2011. Performance stan-dards for antimicrobial susceptibility testing: twenty-first informational supplement. M100 –S21. CLSI, Wayne, PA.
4.Ishii Y, Alba J, Kimura S, Shiroto K, Yamaguchi K.2005. Evaluation of antimicrobial activity of beta-lactam antibiotics using Etest against clinical isolates from 60 medical centres in Japan. Int. J. Antimicrob. Agents25: 296 –301.
5.Joly-Guillou M-L, et al.2010. Comparativein vitroactivity of mero-penem, imimero-penem, and piperacillin/tazobactam against 1071 clinical iso-lates using 2 different methods: a French multicentre study. BMC Infect. Dis.10:72– 80.
6.Kuzucu C, Yetkin F, Gorgec S, Ersoy Y. 2011. Investigation of the susceptibilities of extended-spectrum beta-lactamase producing Esche-richia coliandKlebsiellaspp. strains to ertapenem and other carbapenems. Mikrobiyol. Bul.45:28 –35.
7.Lo-Ten-Foe JR, de Smet AM, Diederen BM, Kluytmans JA, van Keulen PH.2007. Comparative evaluation of the VITEK2, disk diffusion, Etest, broth microdilution, and agar dilution susceptibility testing methods for colistin in clinical isolates, including heteroresistantEnterobacter cloacae
andAcinetobacter bumanniistrains. Antimicrob. Agents Chemother.51: 3726 –3730.
8.Mushtaq S, Warner M, Cloke J, Mariya A-S, Livermore DM. 2010. Performance of the Oxoid M.I.C. Evaluator strips compared with the Etest assay and BSAC agar dilution. J. Antimicrob. Chemother.65:1702–1711. 9.Pfaller MA, Jones RN.2006. Performance accuracy of antibacterial and antifungal susceptibility test methods. Report from the College of Amer-ican Pathologists Microbiology Surveys Program (2001–2003). Arch. Pathol. Lab. Med.130:767–778.
10. Pillar CM, Draghi DC, Dowzicky MJ, Sahm DF.2008. In vitro activity of tigecycline against gram-positive and gram-negative pathogens as evalu-ated by broth microdilution and Etest. J. Clin. Microbiol.46:2862–2867. 11. Rennie RP, Turnbull L, Brosnikoff C.2011. First comprehensive evalu-ation of the M.I.C. Evaluator device compared to Etest and CLSI reference dilution methods for antimicrobial susceptibility testing of clinical strains of anaerobes and other fastidious bacterial species. J. Clin. Microbiol. 50:1153–1157.
12. Schumacher H, Hoffmann S, Holmboc C, Moller JK.2001. A procedure for evaluation and documentation of susceptibility test methods using the susceptibility ofKlebsiella pneumoniaeto ciprofloxacin as a model. J. An-timicrob. Chemother.48:493–500.
13. Steward CD, et al.2003. Antimicrobial susceptibility testing of carbap-enems: multicenter validity testing and accuracy levels of five antimicro-bial test methods for detecting resistance inEnterobacteriaceaeand Pseu-domonas aeruginosaisolates. J. Clin. Microbiol.41:351–358.
14. Tenover FC, et al.1998. Characterization of staphylococci with reduced susceptibilities to vancomycin and other glycopeptides. J. Clin. Microbiol. 36:1020 –1027.
15. Thornsberry C, Yee YC.1996. Comparative activity of eight antimicro-bial agents against clinical bacterial isolates from the United States, mea-sured by two methods. Am. J. Med.24:26S–38S.
16. U.S. Food and Drug Administration.2007. Class II special controls guidance document: antimicrobial susceptibility test (AST) systems; guid-ance for industry and FDA. FDA, Rockville, MD.
17. Vading M, Samuelsen O, Haldersen B, Sundsfjord AS, Giske CG.2011. Comparison of disk diffusion, Etest and VITEK2 for detection of carbap-enemase-producingKlebsiella pneumoniaewith the EUCAST and CLSI breakpoint systems. Clin. Microbiol. Infect.17:668 – 674.
18. van Klingeren B, et al.1994. A multicenter survey of resistance in The Netherlands using the Etest. Diagn. Microbiol. Infect. Dis.19:151–156.