R E S E A R C H
Open Access
Human and great ape red blood cells differ in
plasmalogen levels and composition
Ann B Moser
1, Steven J Steinberg
1, Paul A Watkins
1, Hugo W Moser
1, Krishna Ramaswamy
2,
Kimberly D Siegmund
3, D Rick Lee
4, John J Ely
5, Oliver A Ryder
6and Joseph G Hacia
2*Abstract
Background:Plasmalogens are ether phospholipids required for normal mammalian developmental, physiological, and cognitive functions. They have been proposed to act as membrane antioxidants and reservoirs of
polyunsaturated fatty acids as well as influence intracellular signaling and membrane dynamics. Plasmalogens are particularly enriched in cells and tissues of the human nervous, immune, and cardiovascular systems. Humans with severely reduced plasmalogen levels have reduced life spans, abnormal neurological development, skeletal dysplasia, impaired respiration, and cataracts. Plasmalogen deficiency is also found in the brain tissue of individuals with Alzheimer disease.
Results:In a human and great ape cohort, we measured the red blood cell (RBC) levels of the most abundant types of plasmalogens. Total RBC plasmalogen levels were lower in humans than bonobos, chimpanzees, and gorillas, but higher than orangutans. There were especially pronounced cross-species differences in the levels of plasmalogens with a C16:0 moiety at thesn-1 position. Humans on Western or vegan diets had comparable total RBC plasmalogen levels, but the latter group showed moderately higher levels of plasmalogens with a C18:1 moiety at thesn-1 position. We did not find robust sex-specific differences in human or chimpanzee RBC plasmalogen levels or composition. Furthermore, human and great ape skin fibroblasts showed only modest differences in peroxisomal plasmalogen biosynthetic activity. Human and chimpanzee microarray data indicated that genes involved in plasmalogen biosynthesis show cross-species differential expression in multiple tissues. Conclusion:We propose that the observed differences in human and great ape RBC plasmalogens are primarily caused by their rates of biosynthesis and/or turnover. Gene expression data raise the possibility that other human and great ape cells and tissues differ in plasmalogen levels. Based on the phenotypes of humans and rodents with plasmalogen disorders, we propose that cross-species differences in tissue plasmalogen levels could influence organ functions and processes ranging from cognition to reproduction to aging.
Background
Several decades after an early report that humans and Japanese macaques (Macaca fuscata) have different sus-ceptibilities to atheromatosis [1], it was established that lipid metabolism and cardiovascular disease risks vary among human and nonhuman primates [2-5]. In agree-ment with phylogenetic relationships [6-9], human blood lipid profiles most closely resemble those of their closest living relatives, the great apes (chimpanzees,
bonobos, gorillas, and orangutans) [10-17] (Figure 1). Nevertheless, technological limitations restricted the types of lipids that could be quantified in these early studies. More comprehensive measurements are impor-tant for testing hypotheses that changes in lipid metabo-lism influenced the evolution of numerous traits in the human lineage, including those relevant to cognition and cardiovascular health [18-27].
Plasmalogens are ether-phospholipids present in mam-malian plasma and intracellular membranes [28-31]. They comprise about 20% of the phospholipid mass in humans and chemically differ from more abundant gly-cerophospholipids as well as other ether phospholipids
by the presence of a vinyl ether bond at the sn-1
* Correspondence: [email protected]
2Department of Biochemistry and Molecular Biology, Broad Center for
Regenerative Medicine and Stem Cell Research, University of Southern California, Los Angeles, CA, 90089, USA
Full list of author information is available at the end of the article
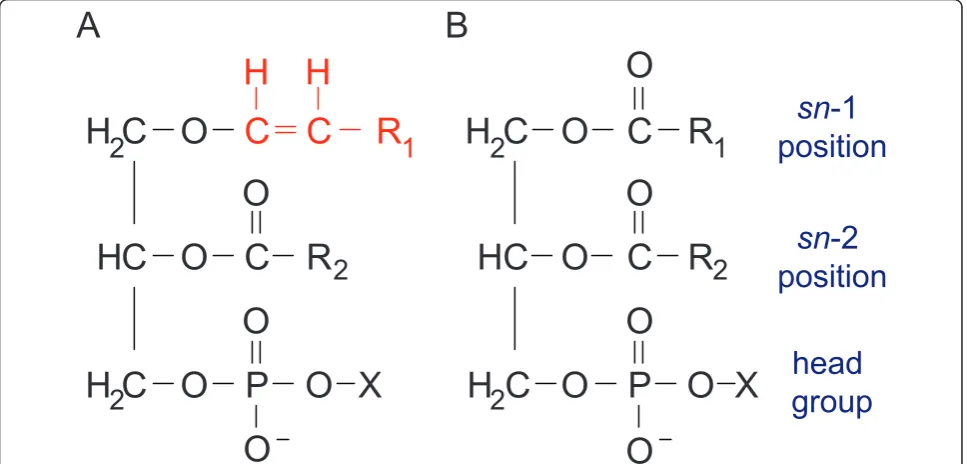
position [30-35]. Plasmalogens can differ based on the chemical group at the sn-1 position (primarily derived from C16:0, C18:0, and C18:1 fatty alcohols) and thesn -2 position (commonly arachidonic acid or docosahexae-noic acid) as well as their head group [36-39] (Figure 2). The majority of plasmalogens in mammalian tissues bear ethanolamine (1-O-alk-1’-enyl-2-acyl-sn -glycero-phosphoethanolamine, plasmenylethanolamine) or cho-line-linked head groups (1-O-alk-1’-enyl-2-acyl-sn -glycerophosphocholine, plasmenylcholine) [30]. Plasma-logens are especially enriched in nervous and cardiac tissues as well as the spleen and cells of the immune system [30]. Genetic deficiency or cellular mislocaliza-tion of one of the two peroxisomal enzymes that initiate plasmalogen biosynthesis, GNPAT and AGPS, results in the severe disorder rhizomelic chondrodysplasia punc-tata (RCDP) [40-42] (Figure 3). The clinical phenotypes of human RCDP patients [40-47] and genetically engi-neered mouse models [32] indicate that plasmalogens are necessary for normal neurological, skeletal, visual, respiratory, and reproductive functions. Decreased brain tissue plasmalogen levels also have been associated with Alzheimer Disease [48-55], X-linked adrenoleukodystro-phy [56,57], and Down syndrome [58].
Here, we address the possibility that plasmalogens influence species-specific traits among humans and great apes. We compared red blood cell (RBC) plasma-logen levels and cellular rates of plasmaplasma-logen biosynth-esis in cohorts of humans and great apes. Human vegan RBC data were used to assess the effects of meat and dairy consumption, which are relevant to comparisons with the mostly plant-eating great apes [24]. Overall, we observed that human RBC plasmalogen profiles differed from those of the great apes and provide indirect evi-dence that this extends to other tissues, which could affect functions relevant to the evolution of these species.
Materials and methods Cohort for RBC lipid profiling
Blood samples from adult humans with Western diets were collected from healthy individuals attending an international conference. Blood samples from adult humans on vegan diets for over one year were col-lected in conjunction with a blood donor center. Appropriate Institutional Review Board (IRB) approval from the University of Southern California and Johns Hopkins Medicine was obtained for all human subjects
Ggo
Ppa
Ptr
Hsa
Ppy
0.9 - 1
4.5 - 6
6 - 8
12 - 16
m
illi
on years ago
Figure 1Phylogenetic relationships of our cohort. We provide a simplified overview of the phylogenies of the species examined in this study along with the inferred age of the last common ancestors at different branch points [8,9]. The present day is indicated by the light blue dotted line and the human lineage is highlighted in red.Ppy=Pongo pygmaeus(orangutan),Ppa=Pan panisicus(bonobo),Ptr=Pan
research. Chimpanzee blood samples were collected at the Alamogordo Primate Facility. All chimpanzees took part in daily enrichment activities to maintain psycho-logical well-being. The chimpanzees were maintained in accordance with the Guide for the Care and Use of Animals (U.S. Dept. of Health and Human Services, Public Health Service, Bethesda, MD., 1996). The APF and its program were fully accredited by the Associa-tion for Assessment and AccreditaAssocia-tion of Laboratory Animal Care, International (AAALAC). Other great ape bloods were collected at the Zoological Society of San Diego (ZSSD). The gender and ages of all blood donors are provided in Additional File 1. Great ape diets contain fresh fruits, vegetables, and nutritional biscuits.
RBC lipid profiling
Whole blood samples were collected from fasting sub-jects and stored in EDTA blood collection tubes. RBCs were collected by centrifugation, washed twice with phy-siological saline, transferred to freezer vials, flushed with nitrogen, and stored at -80°C until analysis. RBCs were thawed briefly before 100μl aliquots were taken for ana-lysis of the total lipid fatty acid content as their DMAs by capillary GC with flame ionization detection [59]. Processed data are provided in Additional File 2.
Primary fibroblast cultures
Great ape dermal fibroblasts were obtained from the ZSSD while human dermal fibroblasts were obtained from the Coriell Institute for Medical Research or the Kennedy Krieger Institute. All individuals are thought to be unrelated. The gender, age, and biopsy site of all fibroblast donors and corresponding biochemical ana-lyses are provided in Additional File 3. Fibroblasts were cultured as previously described [60].
Plasmalogen biosynthesis in cultured fibroblasts
Assays were performed as previously described [61]. They are based on the incorporation of14C-hexadecanol and 3H-hexadecyl-glycerol into plasmalogens. All pro-cessed data are provided in Additional File 4.
Statistical considerations
We analyzed all data on the log2 scale. We used analysis of variance (ANOVA) to compare average blood lipid
data across humans and great apes. Heterogeneity P
-values are reported for the test that the mean level is different in at least one of great apes groups, and Wald
P-values for tests comparing the average level in indivi-dual non-human primate groups to humans. Under ANOVA, statistical tests use an estimate of within-group variation from all samples. Due to the unbalanced
C
C
C
C C
C
C
C
C
C
O
O
O
O
O
O
C
O
O
O
O
O
O
O
O
O
R
R
R
R
X
X
H
H
H
H
H
H
H H
P
P
2
2
2
2
sn
-1
position
sn
-2
position
A
B
1
1
2
2
head
group
Figure 2Basic plasmalogen structure. (A) Plasmalogens are glycerophospholipids characterized by the presence of a vinyl-ether linkage at the
sn-1 position and an ester-linkage at thesn-2 position. R1 and R2 represent straight-chain carbon groups. At thesn-1 position, the chemical moiety highlighted in red is an alkenyl group, which we use to measure plasmalogen abundance and molecular composition. These alkenyl groups are most commonly derived from C16:0, C18:0, or C18:1 fatty alcohols. Thesn-2 position of plasmalogens is occupied typically by polyunsaturated fatty acids. X represents the head group, typically ethanolamine or choline for plasmalogens. In contrast, (B)
R-C-S-CoA O
R1-CH2-CH2-C-S-CoA
O
R1-CH2-CH2-CH2
OH
R-C-OH O
+
GNPATFAR1, FAR2
AGPS
additional enzymatic reactions
Acyl-CoA DHAP
Acyl-CoA Fatty alcohol Fatty acid
Plasmalogen 1-acyl-DHAP
1-akyl-DHAP
H2C
O-H2C-OH
C=O
P-O2
-O O
H2C-O-C-R
H2C
O-C=O
P-O2
-O O O
H2C-O-CH2-CH2-R1
H2C O-C=O
P-O2
-O O
HC-O-C-R2
H2
C-O-H2C-O-C=C-R1 O
P-O-X O -O H H
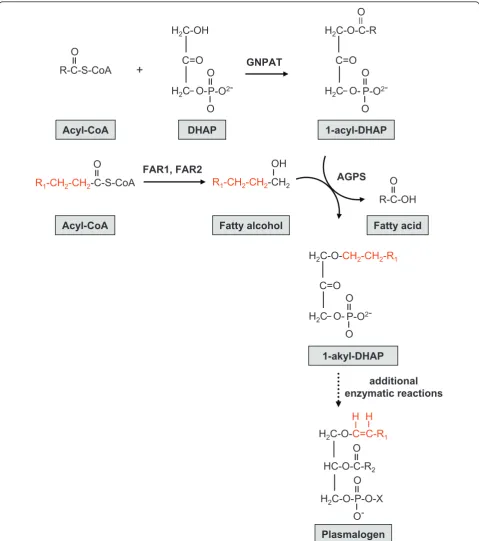
Figure 3Initial steps of plasmalogen biosynthesis. Plasmalogen biosynthesis requires enzymes located in peroxisomes and the endoplasmic reticulum. The initial step, catalyzed by the peroxisomal enzyme dihydroxyacetonephosphate acyltransferase (GNPAT), is the acylation of dihydroxyacetone phosphate (DHAP) at thesn-1position to form 1-acyl-DHAP [34]. Fatty acyl-CoA reductase (FAR1 and/or FAR2), located on the cytoplasmic aspect of the peroxisomal membrane, catalyzes the NADPH-dependent conversion of a fatty acyl-CoA to the corresponding fatty alcohol [33]. The fatty alcohol enters the peroxisome and displaces thesn-1fatty acid in a reaction catalyzed by alkyl-dihydroxyacetone phosphate synthase (AGPS), resulting in formation of 1-akyl-DHAP, which has an ether linkage [35]. Subsequent enzymatic steps occur outside the peroxisome, including the reduction of alkyl-dihydroxyacetone phosphate to alkyl-glycerophosphate, addition of an acyl group in thesn-2
group sizes, this estimate is driven by the variation in humans and in chimpanzees. Box plots showing the dis-tribution of the data suggest that the equal-variance assumption is appropriate. For gene expression studies, we only considered data from oligonucleotide probes predicted to be perfectly matched to both genomes and only assigned gene expression scores to probe sets con-taining at least four such probes [62]. We tested for dif-ferential expression using moderated t-tests and F-tests, as described [63]. All analyses were done using the R programming language. All processed data are provided in Additional File 5.
Results
RBC plasmalogen levels are used in diagnostic tests for human disorders involving impaired plasmalogen bio-synthesis [64,65]. To conduct a cross-species compari-son of cellular plasmalogen profiles, we measured RBC plasmalogen levels in a cohort of humans with Western diets (N = 120), humans with vegan diets for over one year (N = 16), chimpanzees (N = 46), bonobos (N = 4), lowland gorillas (N = 7), and Sumatran orangutans (N = 3) (Additional File 1). We measured the levels of the C16:0, C18:0, and C18:1 chemical moieties most
com-monly present in the sn-1 position of plasmalogens
based on their dimethyl acetal (DMA) derivatives pro-duced during sample preparation (Methods) (Additional
File 2). Total plasmalogen levels were estimated based on the sum of C16:0 DMA, C18:0 DMA, and C18:1 DMA levels. Plasmalogen composition was analyzed based on the levels of specific DMA derivatives.
Human and great ape RBC plasmalogen levels
Total RBC plasmalogen levels differed in the human Western diet (WD) and vegan groups relative to the great apes (ANOVAP< 1 × 10⁻⁴ for both comparisons) (Figure 4). Both human diet groups had lower total plas-malogen levels relative to chimpanzees, bonobos, and gorillas (≥1.3-fold,P < 1 × 10⁻⁶for all six comparisons). In contrast, total RBC plasmalogen levels in both human diet groups were elevated relative to orangutans (1.9-fold,P< 1 × 10⁻¹⁰for both comparisons).
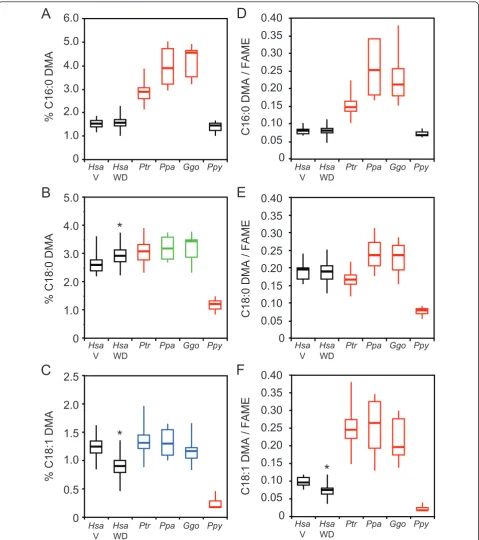
Human and great ape RBC plasmalogen composition
The C16:0 DMA, C18:0 DMA, and C18:1 DMA levels from both human diet groups differed from those of the great apes (ANOVA P< 1 × 10-15for all six compari-sons) (Figure 5A-C). Both human diet groups had sub-stantially lower C16:0 DMA levels relative to chimpanzees, bonobos, and gorillas (≥1.9-fold,P < 1 ×
10-15 for all six comparisons) (Figure 5A), but only
mildly lower C18:0 DMA levels relative to chimpanzees (≤1.2-fold,P < 0.05) (Figure 5B). Vegans also had lower C18:0 DMA levels relative to bonobos and gorillas
(1.2-0
2.0
4.0
6.0
8.0
10.0
12.0
Total % DMAs
Hsa
V
Hsa
WD
Ptr
Ppa
Ggo
Ppy
0
1.0
2.0
3.0
4.0
5.0
6.0
0
1.0
2.0
3.0
4.0
5.0
0
0.5
1.0
1.5
2.0
2.5
Hsa
V HsaWD Ptr Ppa Ggo Ppy
% C18:0
DMA
% C16:0
DMA
% C18:1
DMA
0
0.05
0.10
0.15
0.20
0.25
0.30
0.35
0.40
0
0.05
0.10
0.15
0.20
0.25
0.30
0.35
0.40
0
0.05
0.10
0.15
0.20
0.25
0.30
0.35
0.40
C16:0 DMA / FAME
C18:0 DMA / FAME
C18:1 DMA / FAME
A
B
C
D
E
F
HsaV HsaWD Ptr Ppa Ggo Ppy
Hsa
V
Hsa
WD
Ptr Ppa Ggo Ppy
Hsa
V
Hsa
WD
Ptr Ppa Ggo Ppy Hsa
V HsaWD Ptr Ppa Ggo Ppy
Hsa
V
Hsa
WD
Ptr Ppa Ggo Ppy
*
*
*
fold,P < 0.05 for both comparisons). Both human diet groups had markedly higher C18:0 DMA and C18:1 DMA levels relative to orangutans (≥2.3-fold, P < 1 ×
10-12 for both comparisons). The human WD group
also had lower C18:1 DMA levels relative to chimpan-zees, bonobos, and gorillas (≥1.3-fold,P < 1 × 10⁻³for all three comparisons) (Figure 5C).
To address the fact that the identity of the moiety at the sn-1 position of plasmalogens is influenced by the cellular levels of related fatty acid levels, we normalized C16:0, C18:0, and C18:1 DMA levels with respect to those of their cognate fatty acids. Since fatty acids are converted to methyl ester (FAME) derivatives after sam-ple processing, we report these as DMA/FAME ratios (Figure 5D-F). C16:0, C18:0, and C18:1 DMA/FAME ratios in both human diet groups differed from those of the great apes (ANOVAP< 1 × 10⁻⁶ for all six compar-isons). Relative to both human diet groups, the chim-panzees, bonobos, and gorillas had higher C16:0 and C18:1 DMA/FAME ratios (≥1.9-fold, P< 1 × 10⁻⁹ for all six comparisons), but the orangutans had lower C18:0 and C18:1 DMA/FAME ratios (≥2.5-fold,P< 1 × 10-14 for all four comparisons) (Figure 5E,F). Also relative to both human diet groups, the C18:0 DMA/FAME ratio was lower in chimpanzees (≤1.1-fold,P < 0.05 for both comparisons), but higher in bonobos and gorillas (1.2-1.3-fold,P< 0.05 for all four comparisons).
RBC plasmalogen levels and composition relative to human and chimpanzee gender
Our cohort provided adequate statistical power to screen for possible sexual dimorphism in human (WD
group) and chimpanzee plasmalogen levels and compo-sition. No significant (>1.1-fold, P < 0.05) sex-specific differences in total DMA levels, specific DMA levels, or DMA/FAME ratios were found within this cohort of chimpanzees or humans. Nevertheless, human males had a slightly higher (1.1-fold, P < 0.05) C16:0 DMA/ FAME ratio relative to human females.
Human RBC plasmalogen levels in the vegan and Western diet (WD) groups
The human vegan and WD groups showed no signifi-cant differences in total plasmalogen or C16:0 DMA levels or their C16:0 and C18:0 DMA/FAME ratios (P> 0.05) (Figures 4 and 5). Nevertheless, C18:0 DMA levels were slightly higher (1.1-fold, P < 0.01) for the WD group. Vegans had higher C18:1 DMA level and C18:1 DMA/FAME ratios relative to the WD group (1.3-1.4-fold elevated,P< 1 × 10⁻²for both comparisons).
Cellular rates of peroxisomal plasmalogen biosynthesis
Cultured skin fibroblasts are used in clinical settings to measure cellular plasmalogen levels, rates of plasmalogen synthesis, and other peroxisomal functions [61,66-68] (Additional File 3). We used this system to show that the rates of the peroxisomal component of plasmalogen synthesis, recently suggested to regulate the entire bio-synthetic pathway [69], differed in human relative to
great ape cultured skin fibroblasts (ANOVAP= 2.2 ×
10-4) (Figure 6) (Additional File 4). These rates were greater in human relative to bonobo (1.4-fold,P= 3.6 × 10⁻⁶), gorilla (1.3-fold, P= 6.7 × 10⁻⁴), and orangutan (1.3-fold,P= 2.8 × 10⁻³) skin fibroblasts. No differences
0
0.5
1.0
1.5
2.0
Hsa
7
Ptr
6
Ppa
9
Ggo
8
Ppy
6
peroxisomal
plasmalogen
synthesis (
relative activity)
in the rates of peroxisomal plasmalogen biosynthesis were found between human and chimpanzee skin fibroblasts.
Comparative transcriptomics of peroxisomal plasmalogen biosynthetic pathways
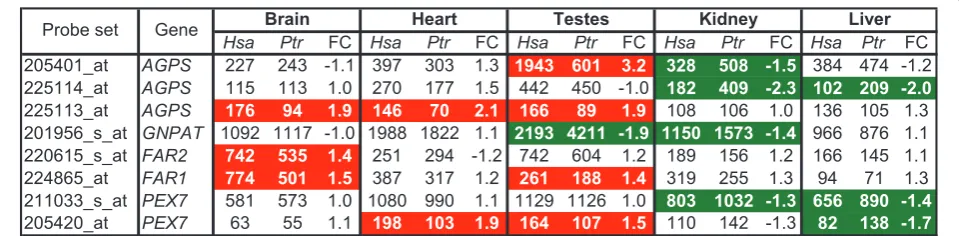
We re-analyzed existing gene expression data [70] from human and chimpanzee livers, brains, kidneys, heart, and testes to begin to explore the possibility that cross-species differences in plasmalogen composition occur in these tissues (Methods). We focused on genes described in Figure 3 that are specifically involved in the initial steps of plasmalogen biosynthesis [30,69] and identified differentially expressed genes (DEGs), as stated in the Figure 7 legend. Cross-species DEGs varied according to the tissue examined (Figure 7 and Additional File 5). For example, all the DEGs in brain (AGPS, FAR1, and
FAR2 transcripts) and heart (AGPS and PEX7
tran-scripts) were more abundant in humans relative to chimpanzees. In contrast, all the DEGs in kidney (AGPS,
GNPAT, and PEX7 transcripts) and liver (AGPSand
PEX7transcripts) were more abundant in chimpanzees
relative to humans. In testes, humans showed 3.2-fold
increases in AGPS, but 1.9-fold reductions in GNPAT
transcript levels, relative to chimpanzees. FAR1 and
PEX7 transcripts were also more abundant in human
relative to chimpanzee testes.
Discussion
Plasmalogens have had a complex evolutionary history with differing biosynthetic pathways in aerobic and anaerobic organisms [71]. Their levels are also known to vary among mammals. For example, human, rat, and guinea pig plasmalogen levels differ in multiple tissues [72] Furthermore, the higher tissue plasmalogen levels in long relative to short-lived rodents has been
suggested confer a lower susceptibility to oxidative membrane damage and contribute to an extended life-span [29]. Considering how plasmalogen deficits impact human and rodent health, they represent intriguing can-didate molecules that could contribute to developmen-tal, physiological, and cognitive differences among humans and great apes.
We observed striking differences in human and great ape RBC plasmalogens. For example, both human diets groups had lower RBC total plasmalogen levels relative to the African great apes (chimpanzees, bonobos, and gorillas), but higher RBC total plasmalogen levels rela-tive to orangutans (Figure 4). Most notably, RBC
plas-malogens with a C16:0 moiety at their sn-1 position
were considerably more abundant in African great apes relative to both human diet groups and orangutans, which had similar levels (Figure 5 A, D). The diverse plasmalogen profiles in our cohort highlight the impor-tance of including all four great ape species in compara-tive studies with humans in order to avoid spurious inferences. Adaptations that occurred in each lineage, especially those related to their historic diets, could make it challenging to infer ancestral states.
We favor the hypothesis that cross-species differences in plasmalogen metabolism are responsible for the dis-tinctions between human and great ape RBC plasmalo-gen profiles. Although open to discussion [30], recent evidence suggests that plasmalogen biosynthesis in regu-lated by the peroxisomal component of this pathway [69]. In this regard, we observed small differences in the rates of peroxisomal plasmalogen biosynthesis in human relative to other great ape skin fibroblasts (Figure 6). These studies should be replicated and expanded in order to examine rigorously intraspecies variation, malogen composition, and the ER component of plas-malogen biosynthesis. Likewise, cross-species differences
Hsa Ptr FC Hsa Ptr FC Hsa Ptr FC Hsa Ptr FC Hsa Ptr FC
205401_at AGPS 227 243 -1.1 397 303 1.3 1943 601 3.2 328 508 -1.5 384 474 -1.2 225114_at AGPS 115 113 1.0 270 177 1.5 442 450 -1.0 182 409 -2.3 102 209 -2.0
225113_at AGPS 176 94 1.9 146 70 2.1 166 89 1.9 108 106 1.0 136 105 1.3 201956_s_at GNPAT 1092 1117 -1.0 1988 1822 1.1 2193 4211 -1.9 1150 1573 -1.4 966 876 1.1 220615_s_at FAR2 742 535 1.4 251 294 -1.2 742 604 1.2 189 156 1.2 166 145 1.1 224865_at FAR1 774 501 1.5 387 317 1.2 261 188 1.4 319 255 1.3 94 71 1.3 211033_s_at PEX7 581 573 1.0 1080 990 1.1 1129 1126 1.0 803 1032 -1.3 656 890 -1.4
205420_at PEX7 63 55 1.1 198 103 1.9 164 107 1.5 110 142 -1.3 82 138 -1.7
Testes Heart
Brain Kidney Liver
Probe set Gene
in plasmalogen turnover rates could have influenced our results. In this regard, plasmalogen-selective phospholi-pase A2 (PLA2) can release thesn-2 fatty acid to yield lysoplasmalogens [30,31,73], which can be degraded by lysoplasmalogenases or acylated to produce intact plas-malogens [73-78]. Although lysoplasmalogen levels can increase after stress [79,80], they are generally thought to be of minor abundance relative to intact plasmalo-gens. To the best of our knowledge, RBC plasmalogen half-lives have not been reported, but the turnover rates of RBC membrane phospholipids is relatively slow com-pared to other organs, such as liver [64]. Nevertheless, rat brain ethanolamine and choline plasmalogens have short, but different, half-lives [31,49,81].
Another candidate explanation for our observations is that humans and great apes differ in their ability to derive plasmalogens from dietary sources. Plasmalogens are present in substantial amounts in meat and fish pro-ducts commonly found in Western diets [82]; however, they are rarely found in plants [83,84]. Wild great apes are mainly plant-eating and our captive population is not exposed to significant amounts of meat products based on their diets, which we previously showed have very low levels of phytanic acid, a sensitive biomarker of ruminant fats, dairy, and certain fish products [24]. We found that the human WD and vegan groups had quite similar RBC plasmalogen levels and composition (Fig-ures 4 and 5). Even the moderately higher C18:1 DMA levels in the vegan group did not alter the conclusions from cross-species comparisons involving C18:1 DMA/ FAME ratios. This is in broad agreement with other stu-dies wherein RBC plasmalogen levels did not change in a limited number of humans on corn oil, triolein, or butter fat-enriched diets [85,86]. Nevertheless, modest increases in C18:1 ethanolamine plasmalogen RBC levels occurred in subjects on a triolein-enriched diet [85].
Animal models have produced a complex picture of how diet influences tissue plasmalogens [87-105]. Rats consuming unnaturally high levels of plasmalogens (>10% by weight) showed elevated blood plasma and liver plasmalogen levels; however, their RBC, skeletal muscle, brain, kidney, lung, or adipose tissue plasmalo-gen levels were not significantly altered [89]. Alkylgly-cerols (AGs) are natural products present in human and other mammalian diets that can be incorporated into plasmalogens and influence the identity of the chemical group at thesn-1 position [88,106]. Neverthe-less, AG consumption only has a minor influence on total plasmalogen levels in tissues from whole animals [107,108]. While the AG dietary levels are not well-defined, one report [88] suggests that adults can daily consume 10-100 mg of batyl alcohol, a type of AG especially abundant in shark liver oil [109]. Dietary fatty alcohols obtained from certain vegetables and fish
could also affect the identity of the chemical group at thesn-1 position [30]. Nevertheless, the strong simila-rities between the vegan and WD group plasmalogen profiles suggest that differences in AG and/or fatty alcohol consumption did not significantly influence our results.
Age is another factor reported to affect RBC plasmalo-gens. In a cohort of younger (25-39 years old) and older (average 79 years old) humans, RBC 16:0 DMA levels did not correlate with age, but small age-related decreases in RBC C18:0 DMA levels were observed (0.04% per decade) [110]. Nevertheless, although our human WD group is older on average than our vegan group (51 vs 35 years), the former has slightly elevated C18:0 DMA levels relative to the latter. Considering cross-species differences in life expectancies [111-115], the age composition of our human and great ape cohorts is relatively uniform (Additional File 1).We also note that the C16:0 and C18:0 DMA/FAME ratios in both our human diet groups are in good agreement with those reported for neonates and children [116]. While we cannot preclude that donor age influenced our results, we suggest that these effects are minor com-pared to those related to donor species.
In efforts to explore the possibility that differences in plasmalogen levels and composition extend to other tis-sues, we found that key genes specifically involved in their biosynthesis were differentially expressed in human and chimpanzee organs (Figure 7). The higher
abun-dance of FAR1, FAR2, andAGPS transcripts in human
Although we cannot make definitive conclusions about the physiological ramifications of the cross-species dif-ferences observed in our studies, specific clinical pheno-types have been associated human RBC plasmalogen levels and composition [127-133]. For example, it was reported that hyperlipidemic individuals had 20% reduced RBC ethanolamine plasmalogen levels relative to healthy controls [127]. Furthermore, significant inverse correlations have been found between human RBC C16:0 DMA/FAME ratios and total cholesterol, tri-glycerides, body fat mass, and glycosylated hemoglobin [128]. Reduced RBC C16:0 and C18:0 DMA/FAME ratios were also associated with human malnutrition [128]. It is formally possible that the observed differ-ences in plasmalogen levels and composition relate to differences in cholesterol regulation in humans, captive chimpanzees, and possibly other captive NHPs [21]. Furthermore, it is tempting to speculate that low RBC total plasmalogen levels in orangutans relate to the basal metabolic rate of this species, which is lower than those of humans and chimpanzees [134,135]. Given their anti-oxidant properties, an increased plasmalogen levels could be beneficial for species with higher metabolic rates.
Although caution must be taken when using human medical data to interpret genetic and biochemical differ-ences among human and NHPs, this approach is useful for generating hypotheses, which can be tested in appro-priate cell culture and/or laboratory animal models [136-140]. It also will be necessary to measure the levels of distinct plasmalogens in multiple human and NHP cell types and tissues in order to refine and test these hypotheses. Comparative analyses of the human and NHP nervous, cardiovascular, and reproductive systems are especially relevant given the phenotypes of humans and mice with severely impaired plasmalogen biosynth-esis. The application and further development of lipido-mic tools and technologies will play a vital role in this process [141].
Conclusions
We observed robust differences in RBC total plasmalo-gen levels and composition among humans and great apes. Our favored hypothesis is that cross-species dif-ferences in plasmalogen metabolism are responsible for the distinctions between human and great ape RBC plasmalogen profiles. In contrast to these species-related differences, the human diets studied had lesser impacts on RBC plasmalogen composition and none on total plasmalogen levels. Likewise, we did not observe robust sex-specific differences in human or chimpanzee RBC plasmalogen levels or composition. Gene expression profiles raise the possibility that other human and great ape cells and tissues differ in
plasmalogen levels, which could influence developmen-tal, physiological, and cognitive functions relevant to the evolution of these species.
Additional material
Additional file 1: Composition of blood donor cohort. A summary of
the numbers, ages, and sex of blood donors is provided.
Additional file 2: Red blood cell plasmalogen composition from all
donors. Relative levels of plasmalogens for all RBC donors are provided.
Additional file 3: Skin fibroblast cultures used for plasmalogen
analysis. A summary of donor sex and age and anatomical source of the
skin fibroblasts is provided.
Additional file 4: Rates of peroxisomal plasmalogen biosynthesis in
cultured dermal fibroblasts. The rates of peroxisomal plasmalogen
biosynthesis from all individual fibroblast cultures are provided.
Additional file 5: Detailed summary of gene expression data for
cross-species comparisons. More complete gene expression data
summary statistics relevant to Figure 7 are provided.
Acknowledgements
We thank C. Finch, M. Goodman, and N. Braverman for thoughtful discussion, and M. Houck and L. Chemnick for technical assistance. This study was funded by the National Institutes of Health (GM072447 to JGH and HD24061 to PAW and ABM). This research was facilitated by NIH/NCRR contract #N02-RR-1-209 to the Alamogordo Primate Facility.
Author details
1Hugo W. Moser Research Institute at Kennedy Krieger, and Department of
Neurology, Johns Hopkins University School of Medicine, Baltimore, MD, 21205, USA.2Department of Biochemistry and Molecular Biology, Broad
Center for Regenerative Medicine and Stem Cell Research, University of Southern California, Los Angeles, CA, 90089, USA.3Department of Preventive
Medicine, University of Southern California, Los Angeles, CA, 90089, USA.
4Washington National Primate Research Center, University of Washington,
Seattle, WA, 98195, USA.5Alamogordo Primate Facility, New Mexico, NM 88330, USA.6Institute for Conservation and Research, Zoological Society of
San Diego, Escondido, CA, 92027, USA.
Authors’contributions
ABM, and SJS carried out the biochemical analyses in this project. ABM, PAW, and HWM were involved in the design and conception of the peroxisome components of this project. KR maintained and conducted genetic and biochemical analysis on human and great ape cells. KDS conducted statistical analyses of all biochemical and gene expression data. RL and JJE provided characterized chimpanzee blood samples and diet information. OAR provided characterized great ape cells, blood samples, and diet information. OAR, JJE and RL were involved in the design and conception of the great ape components of the project. JGH was involved in the overall design and conception of the project, statistical analysis of all data sets, and wrote the manuscript with the help of all authors. All authors have read and approved the final manuscript.
Competing interests
The authors declare that they have no competing interests.
Received: 20 April 2011 Accepted: 17 June 2011 Published: 17 June 2011
References
1. Kawamura R:Neue Beitrage zur Morphologie und Physiologie der CholinesterinsteatosJena, Germany: Gustav Fischer; 1927, 267. 2. Fox H:Artiosclerosis in lower mammals and birds: Its relation to the
3. Hueper WC:Experimental Studies in Cardiovascular Pathology: XIV. Experimental Atheromatosis in Macacus rhesus monkeys.Am J Pathol
1946,22(6):1287-1291.
4. Peeters H, Blaton V:Comparison of lipid and lipoprotein patterns in primates.Acta Zool Pathol Antverp1969,48:221-231.
5. Gresham GA, Howard AN:Vascular lesions in primates.Ann N Y Acad Sci
1965,127(1):694-701.
6. Goodman M, Grossman LI, Wildman DE:Moving primate genomics beyond the chimpanzee genome.Trends Genet2005,21(9):511-517. 7. Hacia JG:Genome of the apes.Trends Genet2001,17(11):637-645. 8. Locke DP, Hillier LW, Warren WC, Worley KC, Nazareth LV, Muzny DM,
Yang SP, Wang Z, Chinwalla AT, Minx P, Mitreva M, Cook L, Delehaunty KD, Fronick C, Schmidt H, Fulton LA, Fulton RS, Nelson JO, Magrini V, Pohl C, Graves TA, Markovic C, Cree A, Dinh HH, Hume J, Kovar CL, Fowler GR, Lunter G, Meader S, Heger A,et al:Comparative and demographic analysis of orang-utan genomes.Nature2011,469(7331):529-533. 9. Hey J:The divergence of chimpanzee species and subspecies as
revealed in multipopulation isolation-with-migration analyses.Mol Biol Evol2010,27(4):921-933.
10. Huser HJ:Atlas of comparative primate hematology.New York: Academic Press; 1970.
11. Blaton V, Peeters H:The nonhuman primates as models for studying human atherosclerosis: studies on the chimpanzee, the baboon and the rhesus macacus.Adv Exp Med Biol1976,67:33-64.
12. McClure HM, Keeling ME, Guilloud NB:Hematologic and blood chemistry data for the gorilla (Gorilla gorilla).Folia Primatol (Basel)1972,
18(3):300-316.
13. McClure HM, Keeling ME, Guilloud NB:Hematologic and blood chemistry data for the orangutan (Pongo pygmaeus).Folia Primatol (Basel)1972,
18(3):284-299.
14. Baitchman EJ, Calle PP, Clippinger TL, Deem SL, James SB, Raphael BL, Cook RA:Preliminary evaluation of blood lipid profiles in captive western lowland gorillas (Gorilla gorilla gorilla).J Zoo Wildl Med2006,
37(2):126-129.
15. Schmidt DA, Ellersieck MR, Cranfield MR, Karesh WB:Cholesterol values in free-ranging gorillas (Gorilla gorilla gorilla and Gorilla beringei) and Bornean orangutans (Pongo pygmaeus).J Zoo Wildl Med2006,
37(3):292-300.
16. Videan EN, Heward CB, Chowdhury K, Plummer J, Su Y, Cutler RG:
Comparison of biomarkers of oxidative stress and cardiovascular disease in humans and chimpanzees (Pan troglodytes).Comp Med2009,
59(3):287-296.
17. Srinivasan SR, Radhakrishnamurthy B, Smith CC, Wolf RH, Berenson GS:
Serum lipid and lipoprotein responses of six nonhuman primate species to dietary changes in cholesterol levels.J Nutr1976,106(12):1757-1767. 18. O’Connell MJ, McInerney JO:Adaptive evolution of the human fatty acid
synthase gene: support for the cancer selection and fat utilization hypotheses?Gene2005,360(2):151-159.
19. Horrobin DF:Lipid metabolism, human evolution and schizophrenia.
Prostaglandins Leukot Essent Fatty Acids1999,60(5-6):431-437. 20. Erren TC, Erren M:Can fat explain the human brain’s big bang
evolution?-Horrobin’s leads for comparative and functional genomics.
Prostaglandins Leukot Essent Fatty Acids2004,70(4):345-347.
21. Finch CE, Stanford CB:Meat-adaptive genes and the evolution of slower aging in humans.Q Rev Biol2004,79(1):3-50.
22. Finch CE:Evolution in health and medicine Sackler colloquium: Evolution of the human lifespan and diseases of aging: roles of infection, inflammation, and nutrition.Proc Natl Acad Sci USA2010,107(Suppl 1):1718-1724.
23. Broadhurst CL, Wang Y, Crawford MA, Cunnane SC, Parkington JE, Schmidt WF:Brain-specific lipids from marine, lacustrine, or terrestrial food resources: potential impact on early African Homo sapiens.Comp Biochem Physiol B Biochem Mol Biol2002,131(4):653-673.
24. Watkins PA, Moser AB, Toomer CB, Steinberg SJ, Moser HW, Karaman MW, Ramaswamy K, Siegmund KD, Lee DR, Ely JJ, Ryder OA, Hacia JG:
Identification of differences in human and great ape phytanic acid metabolism that could influence gene expression profiles and physiological functions.BMC Physiol2010,10:19.
25. Blekhman R, Oshlack A, Chabot AE, Smyth GK, Gilad Y:Gene regulation in primates evolves under tissue-specific selection pressures.PLoS Genet
2008,4(11):e1000271.
26. Haygood R, Fedrigo O, Hanson B, Yokoyama KD, Wray GA:Promoter regions of many neural- and nutrition-related genes have experienced positive selection during human evolution.Nat Genet2007,
39(9):1140-1144.
27. Luca F, Perry GH, Di Rienzo A:Evolutionary adaptations to dietary changes.Annu Rev Nutr2010,30:291-314.
28. Wolff RL, Combe NA, Entressangles B:Modification of alkenyl chain profile in plasmalogens of rat heart mitochondria by dietary trielaidin.Lipids
1985,20(6):367-372.
29. Mitchell TW, Buffenstein R, Hulbert AJ:Membrane phospholipid composition may contribute to exceptional longevity of the naked mole-rat (Heterocephalus glaber): a comparative study using shotgun lipidomics.Exp Gerontol2007,42(11):1053-1062.
30. Nagan N, Zoeller RA:Plasmalogens: biosynthesis and functions.Prog Lipid Res2001,40(3):199-229.
31. Brites P, Waterham HR, Wanders RJ:Functions and biosynthesis of plasmalogens in health and disease.Biochim Biophys Acta2004, 1636(2-3):219-231.
32. Gorgas K, Teigler A, Komljenovic D, Just WW:The ether lipid-deficient mouse: tracking down plasmalogen functions.Biochim Biophys Acta2006,
1763(12):1511-1526.
33. Cheng JB, Russell DW:Mammalian wax biosynthesis. I. Identification of two fatty acyl-Coenzyme A reductases with different substrate specificities and tissue distributions.J Biol Chem2004,
279(36):37789-37797.
34. Webber KO, Hajra AK:Purification of dihydroxyacetone phosphate acyltransferase from guinea pig liver peroxisomes.Arch Biochem Biophys
1993,300(1):88-97.
35. Zomer AW, de Weerd WF, Langeveld J, van den Bosch H:Ether lipid synthesis: purification and identification of alkyl dihydroxyacetone phosphate synthase from guinea-pig liver.Biochim Biophys Acta1993,
1170(2):189-196.
36. Blank ML, Smith ZL, Lee YJ, Snyder F:Effects of eicosapentaenoic and docosahexaenoic acid supplements on phospholipid composition and plasmalogen biosynthesis in P388D1 cells.Arch Biochem Biophys1989,
269(2):603-611.
37. Ford DA, Gross RW:Plasmenylethanolamine is the major storage depot for arachidonic acid in rabbit vascular smooth muscle and is rapidly hydrolyzed after angiotensin II stimulation.Proc Natl Acad Sci USA1989,
86(10):3479-3483.
38. Gaposchkin DP, Farber HW, Zoeller RA:On the importance of plasmalogen status in stimulated arachidonic acid release in the macrophage cell line RAW 264.7.Biochim Biophys Acta2008,
1781(4):213-219.
39. Gaposchkin DP, Zoeller RA:Plasmalogen status influences
docosahexaenoic acid levels in a macrophage cell line. Insights using ether lipid-deficient variants.J Lipid Res1999,40(3):495-503. 40. Weller S, Gould SJ, Valle D:Peroxisome biogenesis disorders.Annu Rev
Genomics Hum Genet2003,4:165-211.
41. Wanders RJ, Waterham HR:Peroxisomal disorders I: biochemistry and genetics of peroxisome biogenesis disorders.Clin Genet2005,
67(2):107-133.
42. Wanders RJ, Waterham HR:Peroxisomal disorders: the single peroxisomal enzyme deficiencies.Biochim Biophys Acta2006,
1763(12):1707-1720.
43. White AL, Modaff P, Holland-Morris F, Pauli RM:Natural history of rhizomelic chondrodysplasia punctata.Am J Med Genet A2003,
118A(4):332-342.
44. Braverman N, Zhang R, Chen L, Nimmo G, Scheper S, Tran T, Chaudhury R, Moser A, Steinberg S:A Pex7 hypomorphic mouse model for
plasmalogen deficiency affecting the lens and skeleton.Mol Genet Metab
2010,99(4):408-416.
45. Braverman N, Chen L, Lin P, Obie C, Steel G, Douglas P, Chakraborty PK, Clarke JT, Boneh A, Moser A, Moser H, Valle D:Mutation analysis of PEX7 in 60 probands with rhizomelic chondrodysplasia punctata and functional correlations of genotype with phenotype.Hum Mutat2002,
20(4):284-297.
46. Braverman N, Steel G, Lin P, Moser A, Moser H, Valle D:PEX7 gene structure, alternative transcripts, and evidence for a founder haplotype for the frequent RCDP allele, L292ter.Genomics2000,
47. Braverman N, Steel G, Obie C, Moser A, Moser H, Gould SJ, Valle D:Human PEX7 encodes the peroxisomal PTS2 receptor and is responsible for rhizomelic chondrodysplasia punctata.Nat Genet1997,15(4):369-376. 48. Hartmann T, Kuchenbecker J, Grimm MO:Alzheimer’s disease: the lipid
connection.J Neurochem2007,103(Suppl 1):159-170.
49. Farooqui AA, Horrocks LA:Plasmalogens: workhorse lipids of membranes in normal and injured neurons and glia.Neuroscientist2001,7(3):232-245. 50. Goodenowe DB, Cook LL, Liu J, Lu Y, Jayasinghe DA, Ahiahonu PW,
Heath D, Yamazaki Y, Flax J, Krenitsky KF, Sparks DL, Lerner A, Friedland RP, Kudo T, Kamino K, Morihara T, Takeda M, Wood PL:Peripheral
ethanolamine plasmalogen deficiency: a logical causative factor in Alzheimer’s disease and dementia.J Lipid Res2007,48(11):2485-2498. 51. Farooqui AA:Studies on plasmalogen-selective phospholipase A2 in
brain.Mol Neurobiol2010,41(2-3):267-273.
52. Grimm MO, Kuchenbecker J, Rothhaar TL, Grosgen S, Hundsdorfer B, Burg VK, Friess P, Muller U, Grimm HS, Riemenschneider M, Hartmann T:
Plasmalogen synthesis is regulated via
alkyl-dihydroxyacetonephosphate-synthase by amyloid precursor protein processing and is affected in Alzheimer’s disease.J Neurochem2011,
116(5):916-925.
53. Han X, Holtzman DM, McKeel DW Jr:Plasmalogen deficiency in early Alzheimer’s disease subjects and in animal models: molecular characterization using electrospray ionization mass spectrometry.J Neurochem2001,77(4):1168-1180.
54. Farooqui AA, Rapoport SI, Horrocks LA:Membrane phospholipid alterations in Alzheimer’s disease: deficiency of ethanolamine plasmalogens.Neurochem Res1997,22(4):523-527.
55. Ginsberg L, Rafique S, Xuereb JH, Rapoport SI, Gershfeld NL:Disease and anatomic specificity of ethanolamine plasmalogen deficiency in Alzheimer’s disease brain.Brain Res1995,698(1-2):223-226. 56. Khan M, Singh J, Singh I:Plasmalogen deficiency in cerebral
adrenoleukodystrophy and its modulation by lovastatin.J Neurochem
2008,106(4):1766-1779.
57. Brites P, Mooyer PA, El Mrabet L, Waterham HR, Wanders RJ:Plasmalogens participate in very-long-chain fatty acid-induced pathology.Brain2009,
132(Pt 2):482-492.
58. Murphy EJ, Schapiro MB, Rapoport SI, Shetty HU:Phospholipid composition and levels are altered in Down syndrome brain.Brain Res
2000,867(1-2):9-18.
59. Bjorkhem I, Sisfontes L, Bostrom B, Kase BF, Blomstrand R:Simple diagnosis of the Zellweger syndrome by gas-liquid chromatography of
dimethylacetals.J Lipid Res1986,27(7):786-791.
60. Karaman MW, Houck ML, Chemnick LG, Nagpal S, Chawannakul D, Sudano D, Pike BL, Ho VV, Ryder OA, Hacia JG:Comparative analysis of gene-expression patterns in human and african great ape cultured fibroblasts.Genome Res2003,13(7):1619-1630.
61. Hommes FA:Techniques in diagnostic human biochemical genetics: a laboratory manual.New York: Wiley-Liss; 1991.
62. Toleno DM, Renaud G, Wolfsberg TG, Islam M, Wildman DE, Siegmund KD, Hacia JG:Development and evaluation of new mask protocols for gene expression profiling in humans and chimpanzees.BMC Bioinformatics
2009,10(1):77.
63. Smyth GK:Linear models and empirical bayes methods for assessing differential expression in microarray experiments.Stat Appl Genet Mol Biol
2004,3:Article3.
64. Quinn PJ, Rainteau D, Wolf C:Lipidomics of the red cell in diagnosis of human disorders.Methods Mol Biol2009,579:127-159.
65. Moser AB, Jones DS, Raymond GV, Moser HW:Plasma and red blood cell fatty acids in peroxisomal disorders.Neurochem Res1999,
24(2):187-197.
66. Gootjes J, Mooijer PA, Dekker C, Barth PG, Poll-The BT, Waterham HR, Wanders RJ:Biochemical markers predicting survival in peroxisome biogenesis disorders.Neurology2002,59(11):1746-1749.
67. Dranchak PK, Di Pietro E, Snowden A, Oesch N, Braverman NE, Steinberg SJ, Hacia JG:Nonsense suppressor therapies rescue peroxisome lipid metabolism and assembly in cells from patients with specific PEX gene mutations.J Cell Biochem2011.
68. Yik WY, Steinberg SJ, Moser AB, Moser HW, Hacia JG:Identification of novel mutations and sequence variation in the Zellweger syndrome spectrum of peroxisome biogenesis disorders.Hum Mutat2009,30(3): E467-480.
69. Honsho M, Asaoku S, Fujiki Y:Posttranslational regulation of fatty acyl-CoA reductase 1, Far1, controls ether glycerophospholipid synthesis.J Biol Chem2010,285(12):8537-8542.
70. Khaitovich P, Hellmann I, Enard W, Nowick K, Leinweber M, Franz H, Weiss G, Lachmann M, Paabo S:Parallel patterns of evolution in the genomes and transcriptomes of humans and chimpanzees.Science2005,
309(5742):1850-1854.
71. Goldfine H:The appearance, disappearance and reappearance of plasmalogens in evolution.Prog Lipid Res2010,49(4):493-498. 72. Diagne A, Fauvel J, Record M, Chap H, Douste-Blazy L:Studies on ether
phospholipids. II. Comparative composition of various tissues from human, rat and guinea pig.Biochim Biophys Acta1984,793(2):221-231. 73. Farooqui AA, Yang HC, Horrocks LA:Plasmalogens, phospholipases A2
and signal transduction.Brain Res Brain Res Rev1995,21(2):152-161. 74. Jurkowitz MS, Horrocks LA, Litsky ML:Identification and characterization
of alkenyl hydrolase (lysoplasmalogenase) in microsomes and identification of a plasmalogen-active phospholipase A2 in cytosol of small intestinal epithelium.Biochim Biophys Acta1999,1437(2):142-156. 75. Jurkowitz-Alexander M, Ebata H, Mills JS, Murphy EJ, Horrocks LA:
Solubilization, purification and characterization of lysoplasmalogen alkenylhydrolase (lysoplasmalogenase) from rat liver microsomes.
Biochim Biophys Acta1989,1002(2):203-212.
76. Arthur G, Page L, Mock T, Choy PC:The catabolism of plasmenylcholine in the guinea pig heart.Biochem J1986,236(2):475-480.
77. Gunawan J, Debuch H:Lysoplasmalogenase–a microsomal enzyme from rat brain.J Neurochem1982,39(3):693-699.
78. Jurkowitz-Alexander MS, Horrocks LA:Lysoplasmalogenase: solubilization and partial purification from liver microsomes.Methods Enzymol1991,
197:483-490.
79. Schonefeld M, Noble S, Bertorello AM, Mandel LJ, Creer MH, Portilla D:
Hypoxia-induced amphiphiles inhibit renal Na+, K(+)-ATPase.Kidney Int
1996,49(5):1289-1296.
80. McHowat J, Liu S, Creer MH:Selective hydrolysis of plasmalogen phospholipids by Ca2+-independent PLA2 in hypoxic ventricular myocytes.Am J Physiol1998,274(6 Pt 1):C1727-1737.
81. Rintala J, Seemann R, Chandrasekaran K, Rosenberger TA, Chang L, Contreras MA, Contreras MA, Rapoport SI, Chang MC:85 kDa cytosolic phospholipase A2 is a target for chronic lithium in rat brain.Neuroreport
1999,10(18):3887-3890.
82. Blank ML, Cress EA, Smith ZL, Snyder F:Meats and fish consumed in the American diet contain substantial amounts of ether-linked
phospholipids.J Nutr1992,122(8):1656-1661.
83. Felde R, Spiteller G:Search for plasmalogens in plants.Chemistry and Physics of Lipids1994,71(1):109-113.
84. Wang G, Wang T:The role of plasmalogen in the oxidative stability of neutral lipids and phospholipids.J Agric Food Chem2010,58(4):2554-2561. 85. Farquhar JW, Ahrens EH Jr:Effects of dietary fats on human erythrocyte
fatty acid patterns.J Clin Invest1963,42:675-685.
86. Hill JG, Kuksis A, Beveridge JM:The Effect of Diet on the Phospholipid Composition of the Red Blood Cells of Man.J Am Oil Chem Soc1965,
42:137-141.
87. Robinson DR, Xu LL, Knoell CT, Tateno S, Olesiak W:Modification of spleen phospholipid fatty acid composition by dietary fish oil and by n-3 fatty acid ethyl esters.J Lipid Res1993,34(8):1423-1434.
88. Das AK, Holmes RD, Wilson GN, Hajra AK:Dietary ether lipid incorporation into tissue plasmalogens of humans and rodents.Lipids1992,
27(6):401-405.
89. Nishimukai M, Wakisaka T, Hara H:Ingestion of plasmalogen markedly increased plasmalogen levels of blood plasma in rats.Lipids2003,
38(12):1227-1235.
90. Kitajka K, Puskas LG, Zvara A, Hackler L Jr, Barcelo-Coblijn G, Yeo YK, Farkas T:The role of n-3 polyunsaturated fatty acids in brain: modulation of rat brain gene expression by dietary n-3 fatty acids.Proc Natl Acad Sci USA2002,99(5):2619-2624.
91. Murthy M, Hamilton J, Greiner RS, Moriguchi T, Salem N Jr, Kim HY:
Differential effects of n-3 fatty acid deficiency on phospholipid molecular species composition in the rat hippocampus.J Lipid Res2002,
43(4):611-617.
93. Andre A, Juaneda P, Sebedio JL, Chardigny JM:Plasmalogen metabolism-related enzymes in rat brain during aging: influence of n-3 fatty acid intake.Biochimie2006,88(1):103-111.
94. Barcelo-Coblijn G, Kitajka K, Puskas LG, Hogyes E, Zvara A, Hackler L Jr, Farkas T:Gene expression and molecular composition of phospholipids in rat brain in relation to dietary n-6 to n-3 fatty acid ratio.Biochim Biophys Acta2003,1632(1-3):72-79.
95. Lin DS, Connor WE, Anderson GJ, Neuringer M:Effects of dietary n-3 fatty acids on the phospholipid molecular species of monkey brain.J Neurochem1990,55(4):1200-1207.
96. Hiratsuka S, Ishihara K, Kitagawa T, Wada S, Yokogoshi H:Effect of dietary docosahexaenoic acid connecting phospholipids on the lipid peroxidation of the brain in mice.J Nutr Sci Vitaminol (Tokyo)2008,
54(6):501-506.
97. Blank ML, Smith ZL, Cress EA, Snyder F:Molecular species of
ethanolamine plasmalogens and transacylase activity in rat tissues are altered by fish oil diets.Biochim Biophys Acta1994,1214(3):295-302. 98. Chapkin RS, Carmichael SL:Effects of dietary n-3 and n-6 polyunsaturated
fatty acids on macrophage phospholipid classes and subclasses.Lipids
1990,25(12):827-834.
99. Chapkin RS, Cole KJ:Remodeling of mouse kidney phospholipid classes and subclasses by diet.The Journal of Nutritional Biochemistry1991,
2(3):158-164.
100. Barcelo-Coblijn G, Hogyes E, Kitajka K, Puskas LG, Zvara A, Hackler L Jr, Nyakas C, Penke Z, Farkas T:Modification by docosahexaenoic acid of age-induced alterations in gene expression and molecular composition of rat brain phospholipids.Proc Natl Acad Sci USA2003,
100(20):11321-11326.
101. Lin DS, Anderson GJ, Connor WE, Neuringer M:Effect of dietary N-3 fatty acids upon the phospholipid molecular species of the monkey retina.
Invest Ophthalmol Vis Sci1994,35(3):794-803.
102. Favreliere S, Barrier L, Durand G, Chalon S, Tallineau C:Chronic dietary n-3 polyunsaturated fatty acids deficiency affects the fatty acid composition of plasmenylethanolamine and phosphatidylethanolamine differently in rat frontal cortex, striatum, and cerebellum.Lipids1998,33(4):401-407. 103. Favreliere S, Perault MC, Huguet F, De Javel D, Bertrand N, Piriou A,
Durand G:DHA-enriched phospholipid diets modulate age-related alterations in rat hippocampus.Neurobiol Aging2003,24(2):233-243. 104. Hiratsuka S, Koizumi K, Ooba T, Yokogoshi H:Effects of dietary
docosahexaenoic acid connecting phospholipids on the learning ability and fatty acid composition of the brain.J Nutr Sci Vitaminol (Tokyo)2009,
55(4):374-380.
105. Destaillats F, Joffre C, Acar N, Joffre F, Bezelgues JB, Pasquis B, Cruz-Hernandez C, Rezzi S, Montoliu I, Dionisi F, Bretillon L:Differential effect of maternal diet supplementation with alpha-Linolenic adcid or n-3 long-chain polyunsaturated fatty acids on glial cell phosphatidylethanolamine and phosphatidylserine fatty acid profile in neonate rat brains.Nutr Metab (Lond)2010,7:2.
106. Zoeller RA, Grazia TJ, LaCamera P, Park J, Gaposchkin DP, Farber HW:
Increasing plasmalogen levels protects human endothelial cells during hypoxia.Am J Physiol Heart Circ Physiol2002,283(2):H671-679. 107. Blank ML, Cress EA, Smith ZL, Snyder F:Dietary supplementation with
ether-linked lipids and tissue lipid composition.Lipids1991,26(2):166-169. 108. Das AK, Hajra AK:High incorporation of dietary 1-O-heptadecyl glycerol
into tissue plasmalogens of young rats.FEBS Lett1988,227(2):187-190. 109. Pugliese PT, Jordan K, Cederberg H, Brohult J:Some biological actions of
alkylglycerols from shark liver oil.J Altern Complement Med1998,
4(1):87-99.
110. Brosche T, Summa JD, Platt D:Erythrocyte membrane changes associated with nutrition and aging–the role of plasmalogens.Arch Gerontol Geriatr
1989,9(3):291-296.
111. Hof PR, Gilissen EP, Sherwooda CC, Duan H, Lee PWH, Delman BN, Naidich TP, Gannond PJ, Perl DP, Erwin JM:Comparative neuropathology of brain aging in primates.InAging in nonhuman primates. Volume 31.
Edited by: Hof PR, Erwin JM. Basel: Karger; 2002:130-154. 112. Mace GM:The genetic and demographic status of the Western
lowland gorilla (Gorilla g. gorilla) in captivity.Journal of Zoology2009,
216:629-654.
113. Anderson HB, Emery Thompson M, Knott CD, Perkins L:Fertility and mortality patterns of captive Bornean and Sumatran orangutans: is there a species difference in life history?J Hum Evol2008,54(1):34-42.
114. Miles L, Caldecott J, Nellemann C:Challenges to great ape survival.In
World Atlas of great apes and their conservation.Edited by: Caldecott J, Miles L. Berkeley: University of California Press; 2005:217-241.
115. Bronikowski AM, Altmann J, Brockman DK, Cords M, Fedigan LM, Pusey A, Stoinski T, Morris WF, Strier KB, Alberts SC:Aging in the natural world: comparative data reveal similar mortality patterns across primates.
Science2011,331(6022):1325-1328.
116. Labadaridis I, Moraitou M, Theodoraki M, Triantafyllidis G, Sarafidou J, Michelakakis H:Plasmalogen levels in full-term neonates.Acta Paediatr
2009,98(4):640-642.
117. Fields RD:White matter in learning, cognition and psychiatric disorders.
Trends Neurosci2008,31(7):361-370.
118. Schoenemann PT, Sheehan MJ, Glotzer LD:Prefrontal white matter volume is disproportionately larger in humans than in other primates.
Nat Neurosci2005,8(2):242-252.
119. Smaers JB, Schleicher A, Zilles K, Vinicius L:Frontal white matter volume is associated with brain enlargement and higher structural connectivity in anthropoid primates.PLoS One2010,5(2):e9123.
120. Smaers JB, Steele J, Case CR, Cowper A, Amunts K, Zilles K:Primate Prefrontal Cortex Evolution: Human Brains Are the Extreme of a Lateralized Ape Trend.Brain Behav Evol2011.
121. Sherwood CC, Holloway RL, Semendeferi K, Hof PR:Is prefrontal white matter enlargement a human evolutionary specialization?Nat Neurosci
2005,8(5):537-538, author reply 538.
122. Semendeferi K, Lu A, Schenker N, Damasio H:Humans and great apes share a large frontal cortex.Nat Neurosci2002,5(3):272-276.
123. Leonard WR, Snodgrass JJ, Robertson ML:Effects of brain evolution on human nutrition and metabolism.Annu Rev Nutr2007,
27:311-327.
124. Nenicu A, Luers GH, Kovacs W, David M, Zimmer A, Bergmann M, Baumgart-Vogt E:Peroxisomes in human and mouse testis: differential expression of peroxisomal proteins in germ cells and distinct somatic cell types of the testis.Biol Reprod2007,77(6):1060-1072.
125. Darin-Bennett A, White IG, Hoskins DD:Phospholipids and phospholipid-bound fatty acids and aldehydes of spermatozoa and seminal plasma of rhesus monkeys.J Reprod Fertil1977,49(1):119-122.
126. Dixson AF:Primate sexuality: comparative studies of the prosimians, monkeys, apes, and human beings.Oxford; New York: Oxford University Press; 1998.
127. Engelmann B, Streich S, Schonthier UM, Richter WO, Duhm J:Changes of membrane phospholipid composition of human erythrocytes in hyperlipidemias. I. Increased phosphatidylcholine and reduced sphingomyelin in patients with elevated levels of triacylglycerol-rich lipoproteins.Biochim Biophys Acta1992,1165(1):32-37.
128. Stenvinkel P, Holmberg I, Heimburger O, Diczfalusy U:A study of plasmalogen as an index of oxidative stress in patients with chronic renal failure. Evidence of increased oxidative stress in malnourished patients.Nephrol Dial Transplant1998,13(10):2594-2600.
129. Stenvinkel P, Diczfalusy U, Lindholm B, Heimburger O:Phospholipid plasmalogen, a surrogate marker of oxidative stress, is associated with increased cardiovascular mortality in patients on renal replacement therapy.Nephrol Dial Transplant2004,19(4):972-976.
130. Antoku Y, Sakai T, Tsukamoto K, Goto I, Iwashita H, Kuroiwa Y:A study on erythrocyte membrane plasmalogen in myotonic dystrophy.J Neurochem
1985,44(6):1667-1671.
131. Moraitou M, Dimitriou E, Zafeiriou D, Reppa C, Marinakis T, Sarafidou J, Michelakakis H:Plasmalogen levels in Gaucher disease.Blood Cells Mol Dis
2008,41(2):196-199.
132. Kohlschutter A, Schade B, Blomer B, Hubner C:Low erythrocyte plasmalogen and plasma docosahexaenoic acid (DHA) in juvenile neuronal ceroid-lipofuscinosis (JNCL).J Inherit Metab Dis1993,
16(2):299-304.
133. Acar N, Berdeaux O, Juaneda P, Gregoire S, Cabaret S, Joffre C, Creuzot-Garcher CP, Bretillon L, Bron AM:Red blood cell plasmalogens and docosahexaenoic acid are independently reduced in primary open-angle glaucoma.Exp Eye Res2009,89(6):840-853.
134. Russon AE:Life history: the energy-efficient orangutan.Curr Biol2010,
20(22):R981-983.
136. Somel M, Creely H, Franz H, Mueller U, Lachmann M, Khaitovich P, Paabo S:
Human and chimpanzee gene expression differences replicated in mice fed different diets.PLoS ONE2008,3(1):e1504.
137. Groszer M, Keays DA, Deacon RM, de Bono JP, Prasad-Mulcare S, Gaub S, Baum MG, French CA, Nicod J, Coventry JA, Enard W, Fray M, Brown SD, Nolan PM, Paabo S, Channon KM, Costa RM, Eilers J, Ehret G, Rawlins JN, Fisher SE:Impaired synaptic plasticity and motor learning in mice with a point mutation implicated in human speech deficits.Curr Biol2008,
18(5):354-362.
138. Reimers-Kipping S, Hevers W, Paabo S, Enard W:Humanized Foxp2 specifically affects cortico-basal ganglia circuits.Neuroscience2011,
175:75-84.
139. Hedlund M, Tangvoranuntakul P, Takematsu H, Long JM, Housley GD, Kozutsumi Y, Suzuki A, Wynshaw-Boris A, Ryan AF, Gallo RL, Varki N, Varki A:
N-glycolylneuraminic acid deficiency in mice: implications for human biology and evolution.Mol Cell Biol2007,27(12):4340-4346. 140. Soto PC, Stein LL, Hurtado-Ziola N, Hedrick SM, Varki A:Relative
over-reactivity of human versus chimpanzee lymphocytes: implications for the human diseases associated with immune activation.J Immunol2010,
184(8):4185-4195.
141. Wenk MR:Lipidomics: new tools and applications.Cell2010,
143(6):888-895.
doi:10.1186/1476-511X-10-101
Cite this article as:Moseret al.:Human and great ape red blood cells
differ in plasmalogen levels and composition.Lipids in Health and
Disease201110:101.
Submit your next manuscript to BioMed Central and take full advantage of:
• Convenient online submission
• Thorough peer review
• No space constraints or color figure charges
• Immediate publication on acceptance
• Inclusion in PubMed, CAS, Scopus and Google Scholar
• Research which is freely available for redistribution
![Figure 1 Phylogenetic relationships of our cohortstudy along with the inferred age of the last common ancestors at different branch points [8,9]](https://thumb-us.123doks.com/thumbv2/123dok_us/9165980.1913805/2.595.57.540.88.366/figure-phylogenetic-relationships-cohortstudy-inferred-common-ancestors-different.webp)