Recommended System for Neighborhoo-Based
Collaborative Filtering Algorithm Using Pearson
Correlation
THOMURTHY. Murali Mohan.
Assistant Professor,Kaushik College of Engineering, India Email: [email protected]
KOICHI Harada
Professor,Department of Engineering, Hiroshima University, Hiroshima, Japan
Balakrishna.ANNEPU
Assistant Professor, Noble Institute of Science andTechnology. Vsp, India.
Abstract – Memory based collaborative filtering technique is successful approach to build a recommender system uses the known preferences of a group of users to make predictions of the unknown preferences for other users. In order to make such predictions the Pearson correlation coefficient is considered for user similarity. User-based Collaborative Filtering is efficient when compared to k-Nearest Neighbor algorithm (k-NN) and Item-based collaborative filtering algorithms from the experiment results. In this Paper a Memory based technique on user similarity using Pearson correlation coefficient is proposed and applied for Collaborative Filtering. The methodology using Pearson correlation coefficient used for predictions have been discussed. The Formulas that were used to implement these models including Pearson correlation coefficient, Weighted average rating, Simple weighted average and Prediction. The measured Mean Absolute Error (MAE) of the proposed model are compared with available models from literature and finally the performance analysis is done based on parameter MAE.
Keywords – Item-Based, K-NN, Memory-Based, User-Based.
I.
I
NTRODUCTIONMemory-based collaborative filtering or neighborhood-based CF algorithm is one among the traditional collaborative filtering technique [5] in recommender system which utilizes the entire or a sample of the user-item database to generate predictions. It evaluates the similarity between each user or item, generates nearest neighborhood [1], and predicts preference scores with nearest neighborhoods. The evaluation of similarity is the most essential step, and the evaluated similarity is used as a weight for predicting preference scores and as a measure for generating nearest neighborhood [3]. These systems utilize statistical techniques to find a set of users, known as neighbors that have a history of agreeing with the target user. Once a neighborhood of users is formed, these systems use different algorithms to combine the preferences of neighbors to produce a prediction for the active user. In section 1 explains the Introduction part of the wok, section 2 explains Related work, Section 3 & 4
Proposed Model and Algorithm, Section 5
Implementation, Section 6 contains Experimentation, section 7 shows the results discussions, Section 8 completes with Conclusion.
II.
R
ELATEDW
ORKThe task in CF is to predict the preference of a particular user based on a database of user‟s preferences. There are two general classes of CF algorithm [8]: Memory-based methods and Model-based methods. Memory base algorithm is the most popular prediction technique in CF applications. The basic idea is to compute the active user‟s vote on a target item as a weighted average [9] of the votes given to that an item by other like-minded users. Memory based collaborative techniques are classified into three categories and they are:
1. Item-based collaborative filtering 2. k-NN collaborative filtering 3. User-based collaborative filtering.
2.1. Item-based Collaborative Filtering:
Item-based recommendation algorithms [6][7] are meant for producing predictions to users with different approach looks into the set of items the target user has rated and computes how similar they are to the target item i and then selects k most similar items{i1,i2,…,ik} . At the same time their corresponding similarities {si1,si2,…,sik} are also computed. After computation of the predictions, the mean of the predictions of the active users and the actual ratings can be computed with mean absolute error (MAE) and the results are tabulated as follows:
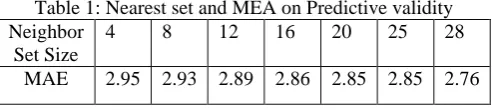
Table 1: Nearest set and MEA on Predictive validity Neighbor
Set Size
4 8 12 16 20 25 28
MAE 2.95 2.93 2.89 2.86 2.85 2.85 2.76
The influence of various nearest neighbors set on predictive validity is tested by gradually increasing the size of neighbors set.
2.2. k-NN collaborative filtering:
Copyright © 2013 IJECCE, All right reserved computed with mean absolute error (MAE) and the results
are tabulated as follows:
Table 2: Results of K-NN Algorithm UID Total Movies Like Dislike
925 20 14 06
887 20 13 07
817 20 09 13
299 20 09 11
026 18 09 11
684 20 13 07
595 20 09 11
474 20 07 13
299 20 06 14
165 20 10 10
092 20 09 11
050 23 12 11
026 25 15 10
018 20 09 11
2.3 User-based Collaborative Filtering:
User-based CF algorithm produces recommendation list for object user according to the view of other users. The assumptions are if the ratings of some items rated by some users are similar, the rating of other items rated by these users will also be similar. CF recommendation [4] system uses statistical techniques to search the nearest neighbors of the object user and then basing on the item rating rated by the nearest neighbors to predict the item rating rated by the object user, and then produce corresponding recommendation list.
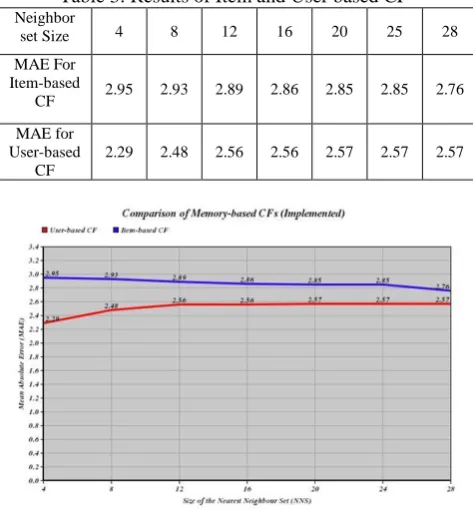
Table 3: Results of Item and User based CF
Neighbor
set Size 4 8 12 16 20 25 28
MAE For Item-based
CF 2.95 2.93 2.89 2.86 2.85 2.85 2.76
MAE for User-based
CF
2.29 2.48 2.56 2.56 2.57 2.57 2.57
Fig.1. Comparison of MAE of User Base algorithm VS item based Algorithm
The influence of various nearest neighbors set on predictive validity is tested by gradually increasing the number of neighbors [2]. It is observed that when Nearest Neighbor Set value increases the corresponding MAE also increased but the quality of prediction is increased when compared to the item-based collaborative filtering technique.
III.
P
ROPOSEDM
ODEL(M
ETHODOLOGY OFM
EMORY-B
ASEDC
OLLABORATIVEF
ILTERINGA
LGORITHMB
ASED ONU
SERS
IMILARITYU
SINGP
EARSONC
ORRELATION)
In user-based collaborative filtering the predictions are computed as the weighted average of deviations from the neighbor‟s mean. In the modification process, a neighborhood size is considered as a constant. It is common for the active user to have highly correlated neighbors that are based on very few co-rated items. These neighbors based on a small number of overlapping items tend to be bad predictors. The correlations based co-rated items are devalued by multiplying the correlation by a Significance Weighting factor then the resulting weighted sum will be decreased which is caused for improvement of the prediction quality. It is proposed to introduce a coefficient is E which represents the number of neighborhood set in the intersection set that rated both by user i and j, the range of the coefficient is derived based the size of neighborhood[10] set. The condition that the users take part in majority rating and the rating items are almost the same can the user have the most possibility to become similar user. The users that take part in a few items rating, even though these rating are similar, in fact the users are not similar. In traditional similarity measurement method, large similarity could be acquired which is not accurate. After modify it and applied with a proportion coefficient E, the final value of weight factor becomes small; obviously the Mean Absolute Error (MAE) is decreased. The quality of the prediction is improved
IV.
P
ROPOSEDA
LGORITHM BASED ONU
SERS
IMILARITYU
SINGP
EARSONC
ORRELATIONInput: set of items and average ratings.
Output: Prediction and MAE
Step 1: All users are weighted with respect to similarity with the active user.
Step 2: Similarity between users is measured as the Pearson correlation between their ratings vectors.
rn
i
rn
i ui u
a i a rn
i ai a ui u
u a
r
r
r
r
r
r
r
r
P
1 1
3 , 3
,
1 , ,
,
)
(
)
(
)
(
Where
r r
a,
u are the average ratings for the user a and u on all other rated items. The summations are over all the users who have rated item i.Step 3: Select n active users that have the highest similarity.
Step 4: Predictions are computed as the weighted average of deviations from the neighbor's mean.
n
u au
n
u ui u au
i a
P
P
r
r
E
P
1 ,
1 , ,
,
)
(
Step 5: Compute a predictions from a weighted
combination.
V.
I
MPLEMENTATIONThe implementation of the proposed model is done using JAVA. The description of implementation process is as follows:
NBSSimblanceRow objects each one containing its row number and its rating with the 1st row. Probability.java
Probability class‟s constructor will calculate the probability of a class (1-5) of the given a document given a user. XYSplineRendererDemoTest.java: This class is responsible for generating the graph for exposed neighbor set size on X-axis and its corresponding MAE values on Y-axis. CBA5.java: this class is responsible for generating the MAE values.
CFA3.java is generating the MAE values for user-based collaborative filtering algorithm [6]. It achieved through the steps Step 1, Step2, Step3 explained in the pseudo code algorithm which is mentioned earlier.
CFA3 we = new CFA3();
List original = new ArrayList();
String fileName2 = D:\\Excelwork\\movielens-data-x.xls";
int requiredSize = 30;
we.populateExcelToList(original, fileName2, requiredSize.
In the above code snippet, the excel sheet data to an array list „original’ is generated and the implementation of above function could be done in populateExcelToList
method. Here „fileName2’ is the path to the excel sheet we are testing. „requiredSize’ is the number of users tested assumed as 30.
List sheetData = new ArrayList();
„sheetData‟ is an array list which will hold the randomly picked values from the „original‟ data.
int[] randoms = we.getRandomUsers(original);
int[] lines = newint[randoms.length];
int[] columns = newint[randoms.length]; Arrays.sort(randoms); int counter = 0; for(int d : randoms){
lines[counter] = d/100;
columns[counter] = d%100; counter++; }
we.getRandomList(lines, columns, original, sheetData);
In the above line we are initializing „sheetData‟ with all zeros.
getRandomList function generated 500 random numbers
from the dataset numbers which rating is to be picked up by using the division with 30 (number of users). In this process, „lines‟ represents the users and „columns‟ represents the items. Lines[i] and columns[k] together would represent ith user‟s rating on k item. we.getRandomList(lines, columns, original, sheetData) is shuffled the randomly picked 500 ratings from „original‟ list to „sheetData‟.
NBSSimblanceRow[] nbsSimilarRows = null;
NBSSimblanceRow oNBSSimblanceRow = null;
ArrayList<NBSSimblanceRow[]>listSimblances=new
ArrayList<NBSSimblanceRow[]>();
for(int i=0; i<30; i++){
nbsSimilarRows = new NBSSimblanceRow[30];
for(int j=0; j<30; j++){
oNBSSimblanceRow = new NBSSimblanceRow();
nbsSimilarRows[j] = oNBSSimblanceRow;} listSimblances.add(nbsSimilarRows);}
Then initialize array list which holds the prediction.
we.populateRows(listSimblances,sheetData);
for(int i=0; i<30; i++){
nbsSimilarRows = listSimblances.get(i); Arrays.sort(nbsSimilarRows,we.new
MyComparator()); }
In the above lines, we are sorting the obtained semblances.
List sheetData1 = ((List) ((ArrayList) sheetData).clone());
Hashtable table = new Hashtable();
for(int i=4; i<30; i=i+4){ List s3 =
we.populatePredictUJ(sheetData1, listSimblances, i);
List s4 = new ArrayList();
doublemae= we.getMAE(sheetData,
original, s3);
BigDecimalz1=new
BigDecimal(mae).setScale(2,BigDecimal.ROUND_HALF _UP);
mae = z1.doubleValue();
System.out.println("For neighbourset size -- " + i +" MAE is " + mae); table.put(new Double(i), mae); }
VI.
M
ODELE
XPERIMENTATIONCopyright © 2013 IJECCE, All right reserved having less than 20 ratings or in complete demographic
information. A subset of the ratings data from the MovieLens data set used for the purposes of comparison. 20% of the users were randomly selected to be the test users. The data sets u1.base and u1.test through u5.base and u5.test are 80%/20% splits of the u data into training and test data. Each of u1, u2, u3, u4, and u5 has disjointed test sets for cross validation. These data sets can be generated from u.data by mku.sh.
The influence of various nearest neighbors set on predictive validity is tested by gradually increasing the number of neighbors. User-based collaborative filtering (UBCF) predicts item rating of the users are evaluated as per the opinions of the users chosen ratings. The results are shown in graphically representing MAE values and respective their neighbor set sizes.
VII.
R
ESULTS&
D
ISCUSSIONThe MAE values are computed using existing user-based collaborative filtering (UBCF) and modified UBCF for U1.test, U2.test, U3.test, U4.test and U5.test for test dataset and tabulated in table 4 to table 8. The Comparative analysis of these computed values are presented.
a) MAE values for UBCF on U1.test dataset
Table 4: MAE values for different neighbor sets for CF on u1.test
Neighbor
Set Size 4 8 12 16 20 24 28 MAE
existing 2.61 2.62 2.62 2.62 2.62 2.62 2.62 MAE
Proposed Model
1.37 1.37 1.37 1.37 1.37 1.37 1.37
Fig.2. Comparison of MAE for user-based collaborative filtering (UBCF) algorithm vs proposed
algorithm on the U1.test.
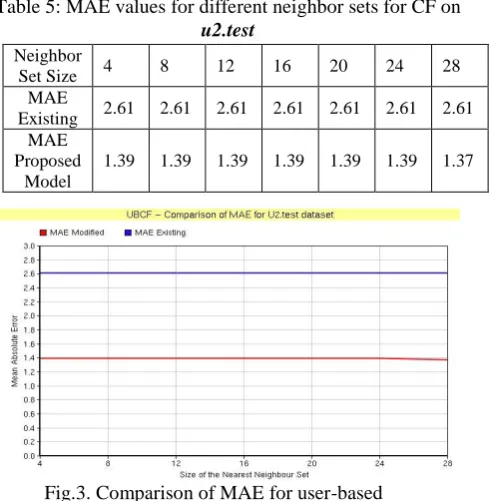
MAE values derived based on prediction quality recommendations is generated, lower values of MAE indicate better performance. MAE is shown in as two graphical representations, the blue line, represents an existing user-based CF using Pearson correlation and the red line, and represents a modified algorithm, with lesser values than the existing.
b) MAE values for UBCF on U2.test dataset:
Table 5: MAE values for different neighbor sets for CF on
u2.test
Fig.3. Comparison of MAE for user-based collaborative filtering (UBCF) algorithm vs modified
algorithm on the U2.test.
c) MAE Values for UBCF on U3. Test dataset:
Table 6: MAE values for different neighbor sets for CF on u3.test
Neighbor
Set Size 4 8 12 16 20 24 28 MAE
existing 2.62 2.61 2.61 2.61 2.61 2.61 2.61 MAE
Proposed Model
1.38 1.39 1.39 1.39 1.39 1.38 1.39
Fig.4. Comparison of MAE for user-based collaborative filtering (UBCF) algorithm vs proposed algorithm on the
U3.test
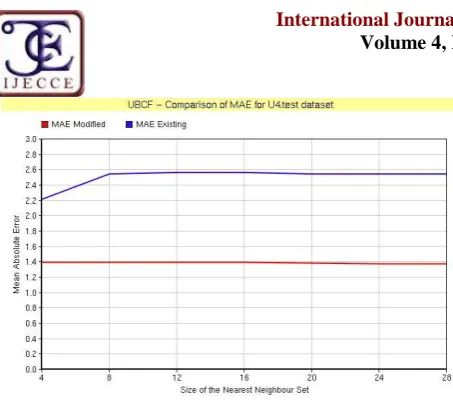
d) MAE values for UBCF on U4.test dataset:
Table 7.MAE values for different neighbor sets for CF on u5.test
Neighbor
Set Size 4 8 12 16 20 24 28 MAE
existing 2.21 2.54 2.56 2.56 2.54 2.54 2.54 MAE
Propose Model
1.39 1.39 1.39 1.39 1.38 1.37 1.37 Neighbor
Set Size 4 8 12 16 20 24 28 MAE
Existing 2.61 2.61 2.61 2.61 2.61 2.61 2.61 MAE
Proposed Model
Fig.5. Comparison of MAE for user-based collaborative filtering (UBCF) algorithm versus
proposed algorithm on the U4.test.
e) MAE values for UBCF on U5.test dataset
Table 8: MAE values for different neighbor sets for CF on u5.test
Neighbor
Set Size 4 8 12 16 20 24 28 MAE
existing 2.29 2.48 2.56 2.56 2.57 2.57 2.57 MAE
Proposed Model
1.39 1.39 1.39 1.39 1.39 1.40 1.40
Fig.6. Comparison of MAE for user-based collaborative filtering (UBCF) algorithm vs proposed
algorithm on the U5.test.
The results presented in this chapter are given according to evaluation procedures with the experiments performed. The results for traditional user-based collaborative filtering and the proposed user-based collaborative filtering algorithm will be compared and presented. Derived MAE values for different test datasets from U1.test to U5.test is related with recommendation accuracy which is computed and compared for the existing and modified methods to see which one performs better. MAE is obtained for every fold in our 5-fold cross validation experiment. Finally the total MAE was computed from the whole set of users and folds in the experiments.
The results presented in table‟s shows the MAEs for the different NNSs evaluation users using U1.test dataset performs 46.7% better improvement over existing UBCF.
Whereas with U2.test dataset it is 47.5%, slightly increase is noticed. 47.1% improvement is noticed in case of the results performed with U3.test dataset and U4.test dataset. 39.3% improvement is noticed in U5.test dataset. It can be observe that both methods are the performed with unique performance in most of the cases, but the improvement of the prediction quality is decreased with increase of NNS. One thing that it is important to notice is the differences between the overall performances of the modified UBCF apparently perform much better than the existing UBCF.
Although UBCF presents a relatively good performance, it is expecting to obtain better results from it. The main reason for this relatively low performance is due to the correlations between users. Hence, it is proposed to use the modified UBCF for further experiments in this thesis in model-based collaborative filtering and hybrid collaborative filtering algorithm evaluations.
VIII.
C
ONCLUSIONWith an idea to compute the active user‟s choice on a target item as a weighted average of the ratings given to that item by other like-minded users, Pearson correlation was introduced to measure the similarity in the algorithm. Derived results show that the user-based collaborative filtering algorithm allows CF-based algorithms to scale to large data sets and at the same time produce high-quality recommendations. Here the user-based collaborative filtering algorithm (UBCF) is modified and tested its suitability.
R
EFERENCES[1] R. Bell and Y. Koren. Scalable collaborative filtering with jointly derived neighborhood interpolation weights. IEEE International Conference on Data Mining (ICDM‟07), pp. 43– 52, 2007.
[2] R. M. Bell, Y. Koren and C. Volinsky. Modeling relationships at multiple scales to improve accuracy of large recommender systems. Proc. 13th ACM SIGKDD International Conference on Knowledge Discovery and Data Mining (KDD‟07), pp. 95–104, 2007
[3] Herlocker, J. L., Konstan, J. A., and Riedl, J. An empirical analysis of design choices in neighborhood-based collaborative filtering algorithms. Inf. Retr. 5, 4 (2002), 287{310.
[4] Burke, R. 2002. Hybrid recommender systems: Survey and experiments. User Modeling and User-Adapted Interaction 12:331–370.
[5] Herlocker, J.; Konstan, J.; Terveen, L.; and Reidl, J.2004. Evaluating collaborative filtering recommender systems ACM Transactions on Information Systems 22:5–53.
[6] B. Sarwar, G. Karypis, J. Konstan and J. Riedl. Item-based collaborative filtering recommendation algorithms. Proc.10th International Conference on the World Wide Web, pp.285–295, 2001.
[7] J. Wang, A. P. de Vries and M. J. T. Reinders, “Unifying User-based and Item-User-based Collaborative Filtering Approaches by Similarity Fusion”, Proc. 29th ACM SIGIR Conference on Information Retrieval, pp. 501–508, 2006.
[8] Resnick, P., Iacovou, N., Suchak, M., Bergstrom, P., and Riedl, J. Grouplens: An open architecture for collaborative Filtering of netnews. In CSCW (1994), pp. 175{186.
Copyright © 2013 IJECCE, All right reserved
[10] Xue, G. R., Lin, C., Yang, Q., Xi, W., Zeng, H. J., Yu, Y., and Chen, Z. Scalable collaborative filtering using cluster-based smoothing. In SIGIR (2005), ACM, pp. 114{121}.
A
UTHOR’
SP
ROFILEThomurthy Murali Mohan
is a Assistant Professor from Kaushik College of Engineering, affiliated to Jawaharlal Nehru Technological University. He received the B.Sc (Computer Science), M.Sc (Computer Science) in 2003 & 2005 from Andhra University. He Completed M.Tech (Computer Science & Engineering) in 2012 from Jawaharlal Nehru Technology University, Kakinada. He received MBA in 2010 from Punjab Technical University. His current research is mainly in Data Mining, and Data Warehousing. Special interests include in Robotics.
Koichi Harada
is a professor of the graduate Schools of Engineering at Hiroshima University. He received the BE in 1973 from Hiroshima University, and MS and Phd in 1975 and 1978, respectively, from Tokyo Institute of Technology. His current research is mainly in the area of the computer graphics. Special interests include man-machine interface through graphics; 3D data input techniques, data conversion between 2D and 3D geometry, effective interactive usage of curved surfaces. He is a member of ACM, IPS of Japan, and IEICE of Japan