827
Performance of Bit Error Rate and Q-Factor for OFDM-RoF System
using QAM Modulation
R. Karthikeyan1, S. Prakasam2
PhD-Research Scholar1, Associate Professor2 Department of CSA, SCSVMV University, Kanchipuram,
Asst. Professor1, Dept. of Computer Science, Pachaiyappa’s College for Men, Kanchipuram Tamil Nadu, India.
1
[email protected], [email protected]
Abstract — The wide range of applications on wireless platforms requires direct access to large amounts of wireless avenues that can be achieved in the orthogonal channel. Orthogonal Frequency Division Multiplexing (OFDM) is a modulation technique for transmission of communication through recent wireless and optical channel. The OFDM is a recent multiple access technology for both wired and wireless mediums. This research focuses on the OFDM modulation technique that can be adapted to the RoF system. The combination of OFDM-RoF (Radio over Fiber) is found to satisfy various demands on the OFDM system. The main objective of this research work is to identify the minimum bit error rate and better Q-Factor for the QAM modulation. This work executes two cases based on QAM modulation namely 4 and 16-QAM modulations and each case has various data rates, subcarriers, and their different distances are compared with the BER and Q-Factor.
Keyword: — OFDM, RoF, QAM, BER, Q-Factor, Radio
over Fiber, Optical – OFDM, Bit Error Rate, Coherent OFDM.
I.
Introduction
The development of a new age wireless communication technology is more resourceful and many industries will be more capable, inventive and intelligent constituents of the next generation wireless technology. During the last decade, wireless and mobile communication has admirable
growth of the internet user’s move from desktop to mobile
applications. The recent and upcoming generation of wireless and mobile communication system support many new applications such as high bandwidth that includes IPv6, High Definition Television, Mobile TV, and Voice over IP (VoIP), video conference and online multimedia service. Due to umpteen demands, wireless and mobile communication system need to improve a high capacity for recent and next generation wireless technology. Orthogonal Frequency Division Multiplexing (OFDM) is the recent multiple techniques for both wired and wireless mediums. [1, 2, 9]
a.
OFDM Modulation
OFDM is a modulation technique that has been adapted to recent and upcoming broadband wired and wireless communication systems such as WiFi, WiMAX, LTE, DAB, and DVB. The recent wireless network faces the imperative to increase the number of users, network coverage and high data transmission in the fixed and mobile users. OFDM is a multicarrier transmission technology that transmits a high-speed data stream by splitting into a number of orthogonal channels considering to the sub-carrier. Each sub-carrier has a low data rate. But
OFDM allows the spectrum of the individual sub-carrier to overlap because of its Orthogonality. OFDM can deal with the various techniques possible to transmit through an optical medium. [1] They are Guard Interval, Cyclic Prefix, Channel Estimation and Link Adaption. The mobile system network needs to prove its frequency signal everywhere in the network, and it maintains to freely interact with another network service. The wireless and mobile broadband services demand the problem with low attenuation, electromagnetic interface, and power consumption. To overcome these problems, Radio over Fiber (RoF) system is introduced. RoF is considered a flexible and scalable system for long and backbone transport of high-frequency bandwidth for increasing the multicarrier frequency. [13, 14, 15]
b.
QAM
In digital transmit, the data packet can travel through different modulation formats such as PSK (Phase Shift Keying) and QAM (Quadrature Amplitude Modulation). OFDM has multi-sub-carrier to transmit low data rate stream using QAM and PSK modulation technique. But PSK is limited by the capacity to determinate constellation points and possible bit rate in phase. [2,3] To resolve this issue, the phase can pass through the various amplitude ranges that called as two carrier waves namely phase and quadrature with different levels for the each sub-carrier symbol of OFDM Modulation. Quadrature Amplitude Modulation (QAM) is both analog and digital scheme. This modulation is being used in optical systems for increasing bit rates. Usually higher order modulations such as 16 and 64-QAM can be optically followed with an interferometer for the modulation. [10, 12, 13]
The digital communications are usually arranged in binary form in QAM i.e. 16-QAM, 64-QAM, and 256-QAM. The higher QAM modulation is possible to put out more bits per symbol. The higher bit error rate and higher order QAM can be more reliable than the lower order QAM. [1, 2, 3] The higher order QAM without increasing the bit error rate can require a higher SNR by increasing signal energy and reducing the noise. The higher order QAM (64-QAM and 256-(64-QAM) is used in digital cable television and network device applications. The 64-QAM is used in digital terrestrial television, 256-QAM used in HDTV and 500Mb/s Ethernet device used in 1024-QAM modulations. [10, 12, 13]
II.
System Model
828 in comparison to the existing methodology. The OFDM can be implemented with Radio over Fiber system and has many features discussed in the previous section from various literature and related studies.
The function of the proposed architecture is to execute BER and Q-Factor for the OFDM-RoF system in Coherent detection method. Coherent Detection is classified into two basic methods, specifically FFT-based CO-OFDM and direct implementation using the Optical medium. This proposed architecture (Figure 1) describes the 4 and 16-QAM OFDM-RoF system using coherent detection. The architecture has four basic components (i) OFDM Signal Generator, (ii) Coherent-OFDM Model (iii) OFDM Receiver.
Fig.1. QAM based OFDM-RoF System
a.
OFDM Signal Generator
Pseudo Random Binary Sequence (PRBS) is used to generate bit sequence for the given input data. Figure (1) shows, the input data connected to a QAM sequence generator are modulated by the OFDM.
Fig.2. OFDM Signal Transmitter
The QAM code sequence generator can generate two parallel M-ary OFDM signal from different phases of the binary signal using PRBS Quadrature Amplitude Modulation. In OFDM transmitter, the input data stream is converted into many parallel data streams through serial to parallel converter. Each OFDM data stream symbol carries the sub-carrier within that input signal. These parallel data streams are modulated on the orthogonal sub-carrier and converted into time domain signal. The given OFDM
signal has 128, 256, 512 sub-carriers with 1024 IFFT points. The Inverse Fast Fourier Transform (IFFT) makes certain data carried into two separate sub-carriers in the form of the time domain to frequency domain at the
receiver’s side. The QAM sequence code generator can
split into two parallel subsequence bit symbol and its each symbol can be transmitted into two Quadrature symbols. The proposed system uses the QAM based modulation format. The OFDM-QAM input symbol can be shifted into a parallel format. The shifted data stream is transmitted in parallel by assigning each symbol. After assigning the symbol, the OFDM spectrum, an IFFT is used to find the corresponding waveform and to add the cyclic prefix guard band to each symbol. The Figure (2) simulations show 4 and 16-QAM OFDM modulation code of 10, 20, 30 and 40 GB/s data of each symbol. Then each symbol is mapped to 128,256 and 512 sub-carrier symbol. [4, 5]
b.
Coherent Model
The Coherent system receives the optical signal and mixes with local oscillator using a CW laser diode. This approach, the optical analog signal includes all the amplitude, phase and polarization in sequence form before they are received by the CW laser diode. The simulation for the coherent detection (Figure 3) component of this section is to simulate optical coherent signal at the
receiver’s side. From the OFDM transmitter block, the data
can be split into the serial to parallel conversion for phase and amplitude of the source signal. Thus the signal divided number of sub-carriers depends on the input QAM and QPSK modulation. The IFFT transmission can convert the signal from the frequency domain into time domain using a low-pass filter which is used to carry the information of the signal. [4]
Fig.3. Simulation for Coherent Detection
The RF-OFDM to the optical converter in Coherent detection and the unfiltered OFDM sub-carrier signal can be fed into the optical coherent using the I/Q modulator
which is embraced by two MZ phase shifters and it’s up -converted into OFDM baseband.
c.
OFDM Receiver
829 detection, after the conversion of serial-to-parallel the data stream is modulated into orthogonal sub-carrier for time and frequency domain of OFDM signal.
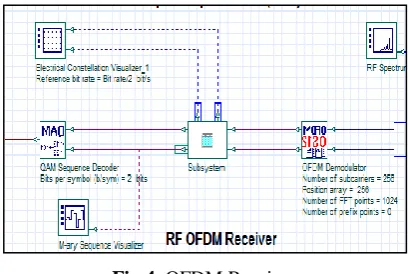
Fig.4. OFDM Receiver
The receiver OFDM demodulator converts the analog signal and it is filtered using a low pass filter for the reduction of the input data stream. The OFDM signal is demodulated using the FFT-based approach. The output of the FFT can achieve a number of points to show using the constellation diagram which allocates the symbol for 4 and 16-QAM possible constellation points.
d.
BER and Q-Factor Analyzer
The Bit Error Rate (BER) analyzer component to calculate the error rate of the OFDM output signal is at the end of the receiver side. The BER component is in respect to the various component parameters of the OptiSystem simulation software such as OFDM modulator, QAM sequence generator, sub-carrier modulation, fiber distance, optical power, etc. These parameters mainly depend on the OFDM input modulation that can be compared with input constellation points.
The BER analyzer can generate the visual graph and the results are based on the input parameter. It has various parameters that include maximum Q-Factor, minimum BER, pattern signal eye height and threshold. The Gaussian noise algorithm can be defined as the numerical method to perform BER and Q-Factor performance of the proposed model.
The symbol for the bit error probability is pbit and it can be
calculated approximately ‘n’ number of probabilities that
can be written as pn.
The sample digression of signal eye pattern in the signal is da and db.
pbit = + + ... ----(1)
Where, , is the probability of the number of
bit symbol. Sn is the total number of samples. N0 and N1 is the number of samples for initial and next bit of the symbol pattern respectively.
The probability of the input symbol with carrier noise of energy and noise power ratio that can be written as,
Carrier to noise ratio =
Where, Eb and N0 are the energy per bit and noise power
for OFDM spectral efficiency respectively.
So the probability of the bit with normalized Gaussian error function (erfun) can be
BER for 4-QAM or QPSK = Q erfun
--- (2) The equation (2) for the 2 bit/symbol. In the same way, this can be also written as for 4 and 8 bit/symbol is
BER for 16-QAM = Q erfun --- (3)
BER for 64-QAM = Q erfun --- (4)
The Q-Factor is calculated from the BER and that equation (2) can be rewritten as
= erfun --- (5)
The carrier noise ratio also is known as the Q-factor.
Q-Factor = --- (6)
Here ‘f’ is the constricted frequency of the corresponding
bandwidth f = f2 - f1 of the given signal.
The Q-Factor from BER can be written as,
Q-Factor =
--- (7)
The BER visual analyzer can be the measured ratio of energy (Eb) and the ratio of frequency (f). [4, 5, 6]
III.
Simulation Results
This section explains the simulation result of BER and Q-Factor for the model of the QAM-based OFDM-RoF system using OptiSystem13.0 simulation software. There are two cases of the result to execute. They are: the first case using 4-QAM (2-bit/symbol), the second case to be used in 16-QAM (4-bit/symbol) modulation technique.
a.
Simulation Results for 4-QAM
Fig.5. Input Constellation for 4-QAM
(4-830 QAM) OFDM-RoF System using Coherent detection technique.
Fig.6. Output Frequency
1.
4-QAM at Data rate at 10Gb/s
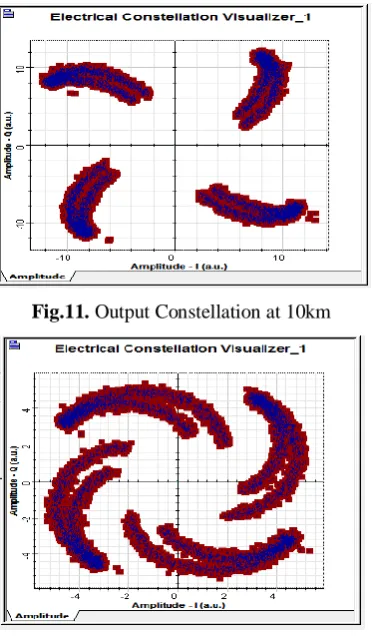
The simulation result for 4-QAM is at the data rate of 10Gbps signal deployment for given OFDM input at 7.5GHz carrier frequency through the QAM based OFDM-RoF system at the 10km to 50km distances with proper OFDM (128, 256 and 512) sub-carrier. Figure 4.2 (a) and 4.2 (b) show the output constellation diagram of the 4-QAM OFDM-RoF at 10Gbps, the constellation diagram of distance 10km and 50km respectively at the 512 sub-carrier.
Fig.7. Output Constellation at 10km
Fig.8. Output Constellation at 50km
The constellation diagram has two different colors − blue denotes noise and red denotes signal at the 4-QAM. The diagram clearly shows that the signal is successfully transmitted through the proposed method and the signal quality is significantly increased between 10km and 50km. While increasing the distance from 80km to 100km for the sub-carrier, the signal quality is slightly better when compared to the result of previous value. After increasing
the distance to 100km the signal is significantly better for 128 and 256 OFDM sub-carriers.
2.
4-QAM at Data rate at 20Gb/s
The 4-QAM at the data rate of 20Gbps signal is for present OFDM input at 7.5GHz carrier frequency through the QAM based OFDM-RoF system between the 10km to 30km distances with proper OFDM (256 and 512) sub-carrier.
Fig.9. Output Constellation at 10km
Fig.10. Output Constellation at 30km
The Figure (9 and 10) shows, the output constellation diagram for the data rate of 20Gbps. It shows that the better Q-Factor can be produced at the distance of 10km and 30km at the 256 and 512 OFDM sub-carrier. While increasing the distance of about more than 30km, the signal has a lot of noise and attenuation mean of the signal which is marginally corrupt due to interference and distortion of the signal noise ratio (SNR). This is because of the SNR value to reach more than 75dB and the output signal producing scattered constellation points, attenuation and signal dispersion.
3.
4-QAM at Data rate at 30Gb/s
The simulation result for 4-QAM at the data rate 30Gbps signal is for present OFDM input at 7.5GHz carrier frequency through the QAM based OFDM-RoF system between 5km and 10km distances with proper OFDM only in the 512 sub-carrier.
831 about more than 10km, the signal has a lot of noise and attenuation due to signal distortion that indicative of the signal is marginally corrupt. It is found that the better signal could be got only at 5km and 10km in 512 sub-carriers. [4, 6]
Fig.11. Output Constellation at 10km
Fig.12. Output Constellation at 50km
Table (1) BER and Q-Factor for 4-QAM
Data Rate
Distance (km)
Sub-carrier
MIN BER
Max. Q-Factor
10 Gb/s
80 256 0 5e+49
100 512 0 5e+49
20 Gb/s 30
256 0 5e+49
512 0 5e+49
30 Gb/s 10 512 0 5e+49
Table 2 shows, if the data rate 10Gb/s the result for MIN BER and MAX Q-Factor for various distance and sub-carrier value. The maximum Q-Factor value is 5e+49 produced at the 256 and 512 sub-carrier for the distance of 10km, 50km and 80km. If distance increases about 100km, then the better Q-Factor is produced at 128 and 256 sub-carrier. As the result of 4-QAM OFDM-RoF system at 10Gbps, the minimum BER and better maximum Q-Factor value created at 100km distance executes only at the 256 sub-carrier OFDM signal. The 512 sub-carrier maximum Q-Factor is produced at 50km of distance. So the efficient output parameter produced for 10Gbps at 50km to 80km distance 512 OFDM sub-carrier. [6]
If the data rate 30Gb/s, the minimum BER value was found at 10km distance with only at 512 OFDM sub-carrier signal. Therefore the BER and Q-Factor for 4-QAM modulation shows that if the data rate decreases, then the distance also undergoes decrease.
b.
Simulation Results for 16-QAM
The 16-QAM OFDM modulator is upconverted to nearly 10-15 GHz carrier frequency with various input bit sequence. The input constellation and the output of OFDM spectrum signal is shown in the following Figure (13 and 14).
Fig.13. Input Constellation for 16-QAM
Fig.14. Output OFDM Spectrum
1.
16-QAM at Data rate at 10Gb/s
The simulation result for 16-QAM is at the data rate 10Gbps signal operation for given OFDM input at 10-15GHz carrier frequency through the QAM based OFDM-RoF system at the 10km to 100km distances with 128, 256 and 512 OFDM sub-carrier. Figure (15 and 16) shows the output constellation diagram of the 16-QAM OFDM-RoF at 10Gbps with the constellation diagram of distance 75km and 100km at 512 sub-carrier.
832
Fig.16. Constellation for 512 subcarrier 100km
The constellation diagram has two different colors − blue denotes noise and red denotes signal at the 16-QAM. The diagram shows that the signal is successfully transmitted through the proposed method and the signal quality is significantly increased between 50km and 75km. While increasing the distance concerning 100km for the sub-carrier, the signal quality slightly is marginally corrupt compared to the result of previous value. It observed that the receiving signal at the receiver side is successfully transmitted and the signal quality is good after transmission between 50km and 75 km fiber distance. Figure (16) shows the constellation diagram after increasing the distance of about 100km for the same sub-carrier. [6, 7]
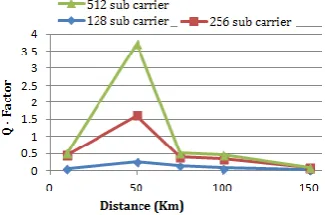
Fig.17. BER Vs Distance at 10Gb/s
Fig.18. Q-Factor Vs Distance at 10Gb/s
Figure (17) is the graph for MIN BER and the distance is compared with 128, 256 and 512 sub-carriers. It shows that if the distance increases, the MIN BER value also increases. The graph shows that the better MIN BER value is attained between 50km-100km for 256 and 512 sub-carriers at the data rate of 10Gbps. In Figure (18), the graph also explains the better Q-Factor found at 256 and 512 sub-carrier at 50km distance. The output of MIN BER is better and Q-Factor is established at the distance
50km-100km of 256, 512 sub-carrier values at the data rate of 10Gbps. [7]
2.
16-QAM at Data rate at 20Gb/s
From Figure (19) it is observed that the signal at the receiver side is successfully transmitted and the signal quality is better after transmitting the distance up to 75 km. After increasing the distance from 100km to 150km, the 512 sub-carrier receiving signal is significantly increases the noise and attenuation as compared with previous value and the result is shown in the table (2). This signal is totally corrupt after increasing the distance to 75km at the data rate of 20Gbps at 512 sub-carriers. [7]
Fig.19. Constellation with 75km and 512 subcarrier
The Figure (20) shows, the graph for BER and the distance is compared with 128, 256 and 512 sub-carriers. It also shows that if the distance increases, the BER value also increases. The graph shows that the better MIN BER value is attained between 50-75km for 256 and 512 sub-carriers at data rate of 20Gbps. In Figure (21) the graph clearly explains that the better Q-Factor is established the distance at 75km in 512 sub-carriers. The output of MIN BER is better and the Q-Factor has established the distance between 50-75km 512 sub-carrier values at the data rate of 20Gbps. [43]
Fig.20. BER Vs Distance and subcarrier at 20Gb/s
833
3.
16-QAM at Data rate at 30Gb/s
Figure (22) shows that the signal at the receiver side is successfully transmitted and the signal quality is normal after transmitting the distance up to 50km. The distance is increased up to more than 100km and in the 512 sub-carrier, the signal is significantly increases the noise and attenuation as compared with the previous value. This signal is totally corrupt after increasing the distance at 75km the data rate of 30Gbps with 128 and 256 sub-carriers. However, with the 512 sub-carrier, the MIN BER reaches at 75km distance.
Fig.22. Constellation for 75km with 512 subcarrier
Fig.23. BER Vs Distance at 30Gb/s
Fig.24. Q-Factor Vs Distance at 30Gb/s
Figure (23) shows the graph for MIN BER and the distance is compared with 128, 256 and 512 sub-carriers. It shows that if the distance increases, the MIN BER value also increases. The better MIN BER value is attained between 50km and 75km for 256 and 512 sub-carriers and the data rate of 30Gbps. The Figure (24) graph shows the better Q-Factor found in 512 sub-carriers at 75km distance. The output of MIN BER is better and Q-Factor is established at the distance between 50-75km 512 sub-carrier values at the data rate 30Gbps. [7]
4.
16-QAM at Data rate at 40Gb/s
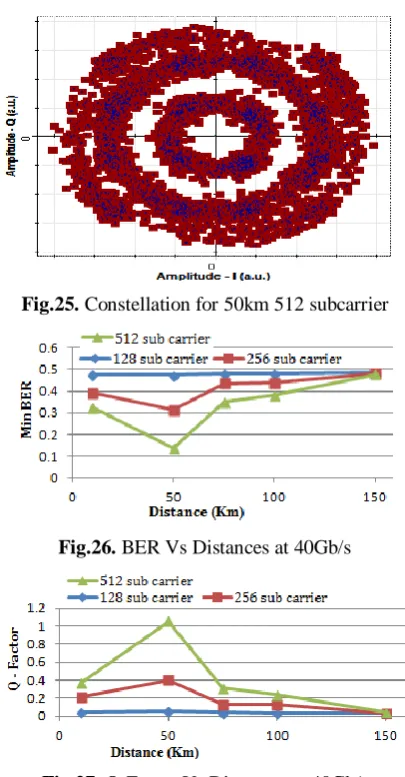
The Figure (25) shows that the constellation for the output signals with the data rate at 40Gbps 512 sub-carriers. The signal quality is better at the distance of 50km with 512
sub-carriers. after increasing the distance about 75km for the 512 sub-carrier, the signal significantly increases the noise and attenuation. This signal is marginally corrupt after increasing the distance. [7]
Fig.25. Constellation for 50km 512 subcarrier
Fig.26. BER Vs Distances at 40Gb/s
Fig.27. Q-Factor Vs Distances at 40Gb/s
The Figure (26) shows the better BER value is attained between 50km and 75km, at 512 sub-carrier with the data rate of 40Gbps. The Figure (27) graph shows the better Q-Factor found at 50-75km 512 sub-carrier the data rate at 40Gbps. Table (2) shows the bit error rate and Q-factor for various sub-carriers at 40Gbps.
Table (2) BER and Q-Factor for 4-QAM
Data Rate
Distance (km)
Sub carrier
MIN BER
Max. Q-Factor
10 Gb/s
50 128 0.15121713 0.973546
100 256 0.24892173 0.697253
20 Gb/s 50 512 0.01708652 3.7262
30 Gb/s 50 512 0.06382083 1.78472
834
IV.
Discussions
The simulation result of BER and Q-Factor for OFDM-RoF system using 4 and the 16-QAM modulation technique has been analyzed. This study has executed two cases with several data rates of 10, 20, 30 and 40Gbps with a 10-15GHz carrier frequency of the various sub-carriers, namely 128, 256 and 512 at the distance of 10-150km. The simulation result shows that when the distance increases, the MIN BER value also increases. The best bit error rate can be achieved from the distance between 50km-75km 512 sub-carrier. Table (3) shows, the simulation results of BER and Q-Factor for 4 and16-QAM modulations. The 4-QAM simulation result has been executed for the data rate 10, 20 and 30 Gb/s with various parameters like sub-carrier and distances. As evident from the result of 4-QAM, the data rate 10 Gb/s, the minimum BER and better Q-Factor value (5e+49) produced at 100km distances execute only of 256 sub-carrier OFDM signal. In the data rate 20 Gb/s, if the OFDM sub-carrier is increased 512 then the better Q-Factor value is found at 30km distances. At the data rate at 30Gb/s, the BER value found at a 10km distance with same 512 sub-carrier signal. Hence, the BER and Q-Factor for 4-QAM modulation is the data rate decreases, the number of sub-carrier to reach maximum distance. Table (3) clearly shows the bit error rate and Q-Factor value found at the data rate between 10-20Gb/s with 512 sub-carrier at the distance between 30-100km.
Table (3) Simulation Results for 4 and 16-QAM Modulations
Modulatio n
Dat a Rate Gb/s
Distance (km)
Sub- carrier
MIN BER
Max. Q-Factor
4-QAM
10 100 256 0 5e+49
20 30 512 0 5e+49
30 10 512 0 5e+49
16-QAM
10 100 512 0.2549347 0.562303
20 50-75 512 0.0170886 3.726267
30 50-75 512 0.0638271 1.784721
40 50 512 0.1374067 1.053221
The simulation result for 16-QAM modulation has been performed at the data rate between 10-40Gb/s, with suitable sub-carrier and distances. For the resulting of 16-QAM modulation, the data rate between 10-40 Gb/s the minimum BER and better Q-Factor value was found at the distance at 50-75km with 512 OFDM sub-carrier. The capable value of BER 0.017088au and the better Q-Factor value 3.726267au carry out the data rate 20Gb/s, 512 OFDM sub-carrier at the distance between 50-75km. If the data rate increases in 30Gb/s, then the efficient value has been decreases at 1.784721au.Similarly, the data about 40Gb/s the signal is scatters due to distortion that shows in the constellation diagram. Therefore, as regards the 16-QAM modulation the efficient value is executed with the
data rate between 20-30Gb/s with 512 sub-carrier at the distance involving in 50-75km.
Table (4) Comparisons between QAM based OFDM-RoF vs Existing Models [2, 8]
V.
Conclusion
835 shows, that if the distance increases, the MIN BER value also increases. The minimum bit error rate is achieved at the distance between 50km-75km,512 sub-carrier for 16-QAM. After applying various input frequencies with different modulations, the OFDM combining with RoF system increases the higher spectrum efficiency and the high performance of the Radio Frequency. RoF system has many applications for wireless and mobile communication technologies. In this work, it is concluded that the modulation technique of OFDM is to implement a RoF system for increasing high bandwidth, low attenuation, frequent sub-carrier allocation and low BER at the different modulation technique as QAM. The author feels that this study will have scope for further research and development of newer OFDM technology to use RoF for wireless and broadband communications. The proposed work and its findings are compared with the two existing models (see Table (4)) and the results are found to be better in the proposed work. [2, 8]
Reference
[1] Guoting Zhang, Marc De Leenheer (2013), Annalisa
Morea and Biswanath Mukherjee, “A Survey on
OFDM-Based Elastic Core Optical Networking” IEEE Communications Surveys & Tutorials, Vol. 15, No. 1. [2] Ayoob Alateeq, Mohammad Matin (March-2013),
“Study of the BER Performance in RoF-OFDM
system modulated by QAM and PSK” IOSR Journal
of Engineering (IOSRJEN), e-ISSN: 2250-3021, p-ISSN: 2278-8719, Vol. 3, Issue 3, PP 27-32.
[3] M. Trikha, N. Sharma and M. Singhal (August 2013),
“BER Performance Comparison between QPSK and 4
-QAM Modulation Schemes” International Journal of
Electrical and Instrumentation Engineering, Vol.3, No.2. PP. 62-66.
[4] Simulation Tool referenced from https://optiwave.com/.
[5] OptiSystem Library: OptiSystem Component Library
– Optical Communication System Design Software – Version 14.
[6] William Shieh and Ivan Djordjevic (2011), “OFDM
for Optical Communications”, Published by Elsevier, Springer, ISBN: 978-1-4419-8138-7.
[7] Karthikeyan R. and Prakasam S. (2016) “Performance analysis of BER in OFDM-RoF system using
16-QAM modulation for wireless network”, Int. J.
Wireless and Mobile Computing, Vol. 11, No. 4, pp.294-301.
[8] R. K. Sethi and Dr. Aditya Goel, “Performance Analysis of Optical Communication Systems using
OFDM by Employing QPSK Modulation”,
International Journal on Recent and Innovation Trends in Computing and Communication, Volume 3, Issue 1, January 2015.
[9] C.W. Chow et al., (2010) “Studies of OFDM Signal for Broadband Optical Access Networks”, IEEE Journal on Selected Areas in Communication, Vol. 28, No. 6, pp.800-807.
[10]Text Book: Behrouz A. Forouzan (2006) “Data Communications and Networking-Fourth Edition”, Published by Tata McGraw-Hill Education, ISBN-13: 978-0-07-064314-5.
[11]Manish Trikha et al., (2013) “BER Performance Comparison between QPSK and 4-QAM Modulation Schemes”, MIT-International Journal of Electrical and Instrumentation Engineering, Vol. 3, No. 2, pp.62-66. [12]QAM: https://en.wikipedia.org/ wiki/Quadrature
_amplitude_modulation
[13]QAM Applications: https://en.wikipedia.org /wiki/ QAM_(television)
[14]Orthogonal Frequency Division Multiplexing: https://en.wikipedia.org/wiki/Orthogonal_frequency-division_multiplexing.
[15]Text Book: Van Nee, R.D.J. and R. Prasad (2000)
![Table (4) Comparisons between QAM based OFDM-RoF vs Existing Models [2, 8]](https://thumb-us.123doks.com/thumbv2/123dok_us/8795855.1769179/8.595.321.526.130.678/table-comparisons-qam-based-ofdm-rof-existing-models.webp)
